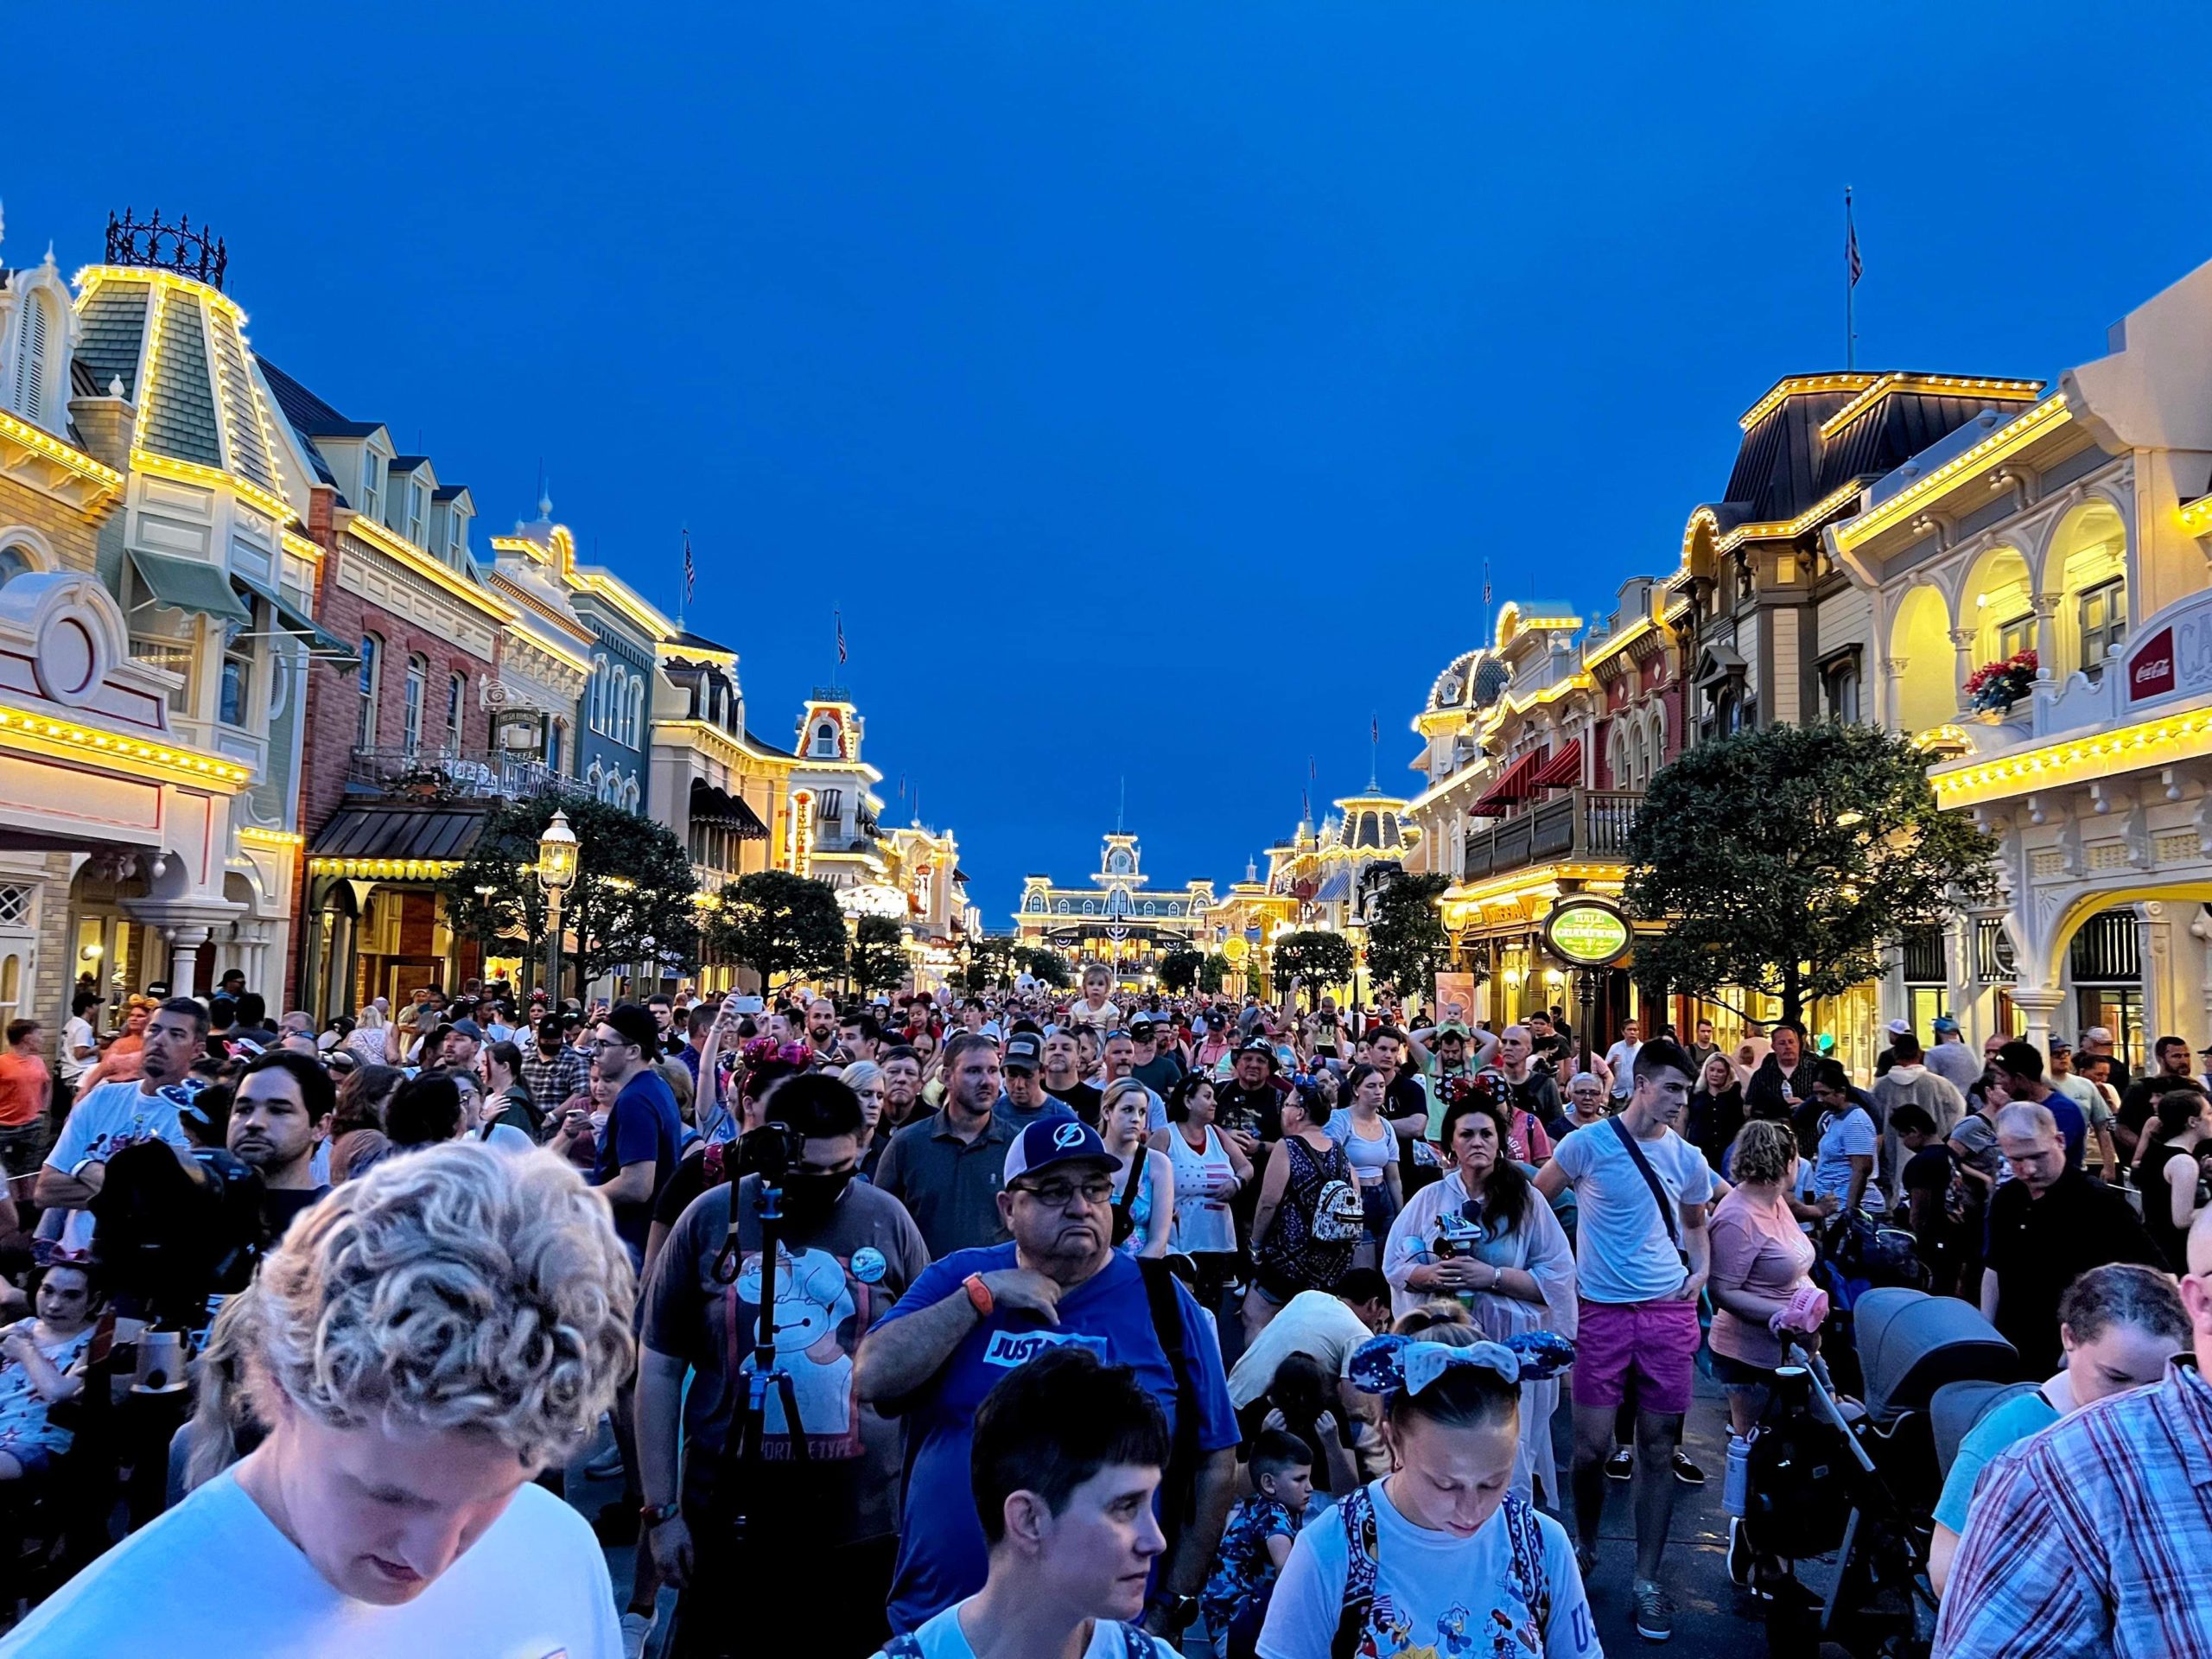
Let’s Talk about Walt Disney World Wait Times for July 4th Weekend
In a perfect world, Disney’s current Park Pass system would lead to uniform attraction wait times.
With the same number of guests in the park each day, Disney can anticipate crowds and staffing, thereby creating the most efficient theme park experience.
Counterpoint: July 4th.
Record-setting tourism has occurred throughout the country as pandemic-deprived folks crave the escapism of travel.
Walt Disney World has historically tracked the July 4th holiday as the busiest time of the year save for Christmas Week.
While Park Passes were a thing in 2021, they certainly didn’t face a test then like they have over the past few days.
For this reason, we have plenty of intrigue in this week’s update. Here are the Walt Disney World wait times for the week of July 4th.
Photo: Disney
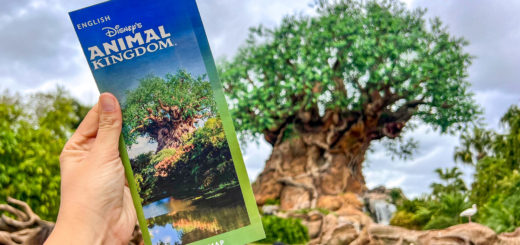
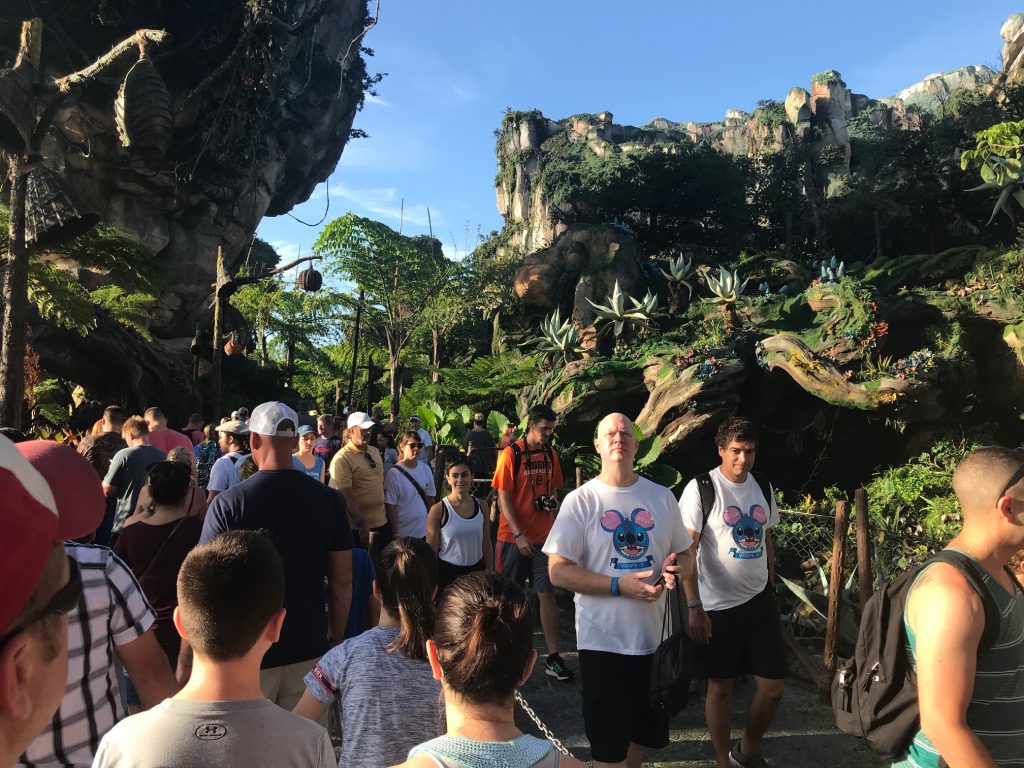
Disney’s Animal Kingdom
Before we get started, I should mention one quirk of this year’s evaluation. July 4th occurred on a Monday.
Without getting into the intricacies of tourist behavior, let’s just say that it’s a less-than-ideal day for workers.
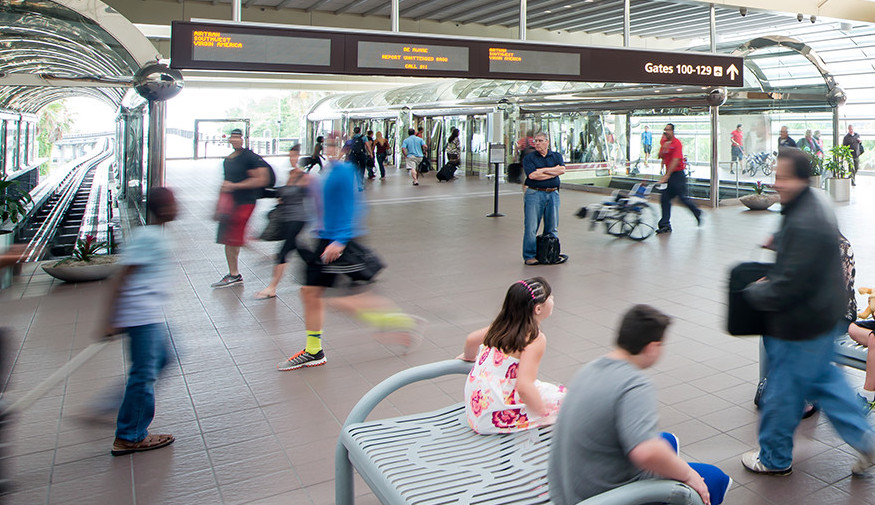
Image: OrlandoAirports.net
For many, the holiday is on Monday, which means people must work on Tuesday. Unfortunately, that accidentally turns Independence Day into a travel day for some.
You’ll find plenty of stories like this one. As such, July 4th wasn’t as busy a park day as July 3rd or (especially) July 2nd.

Photo: touring plans.com
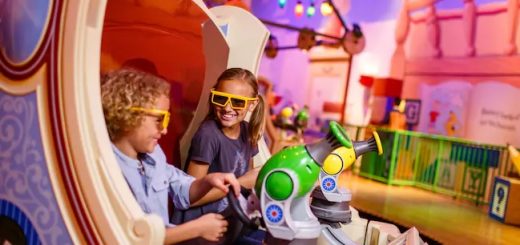
Keep this in mind when I provide you with the first surprising wait time. On average, guests waited 89 minutes to ride Avatar Flight of Passage.
Friends, that’s a drop of 20 minutes from the previous week! If this trend holds, Walt Disney World will have handled holiday crowds perfectly.
Here are the other wait times at Animal Kingdom:
- Na’vi River Journey – 69 minutes, down 1
- Kali River Rapids – 50 minutes, down 13
- Kilimanjaro Safaris – 44 minutes, down 11
- Adventurers Outpost – 39 minutes, down 11
- Expedition Everest – 38 minutes, down 1
- DINOSAUR – 34 minutes, down 6
- TriceraTop Spin – 13 minutes, down 2
- It’s Tough to Be a Bug – 12 minutes, down 2
Photo: Disney
Overall, guests waited for an average of 44 minutes during the holiday. Remarkably, that’s a drop of six minutes from before the holiday.
Disney’s Hollywood Studios
Let’s be realistic about the fact that crowds won’t go down as much at Hollywood Studios as at Animal Kingdom.
One park is super-hot and requires tons of walking, neither of which is great in early July.
The other is Walt Disney World’s smallest park and hosts plenty of indoor attractions.
Still, the trend remains our friend. Star Wars: Rise of the Resistance averaged a wait of 108 minutes, a drop of three minutes from the previous week.
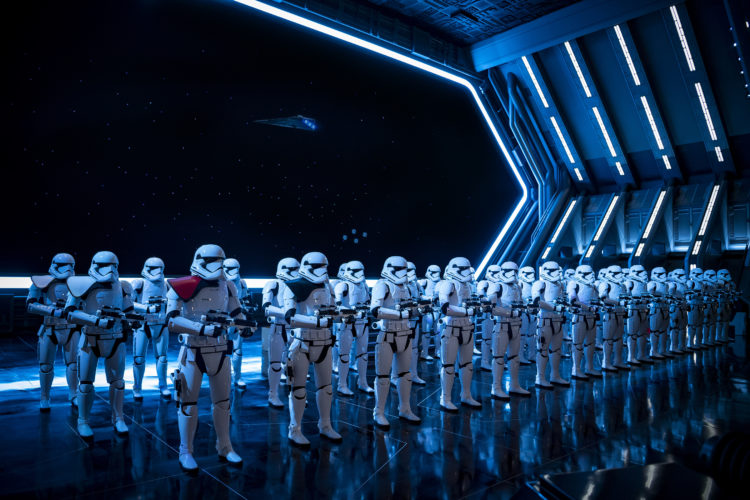
Photo: Matt Stroshane
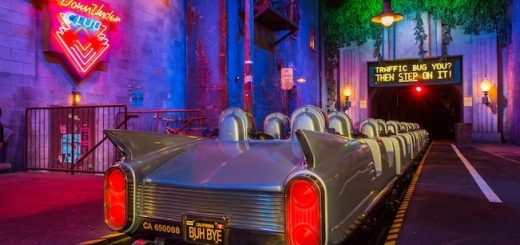
In fact, for a couple of days, Slinky Dog Dash required a longer wait! Of course, that’s ultra-rare at Hollywood Studios these days.
The Toy Story roller coaster averaged a 95-minute wait, which is still down two minutes from last time.
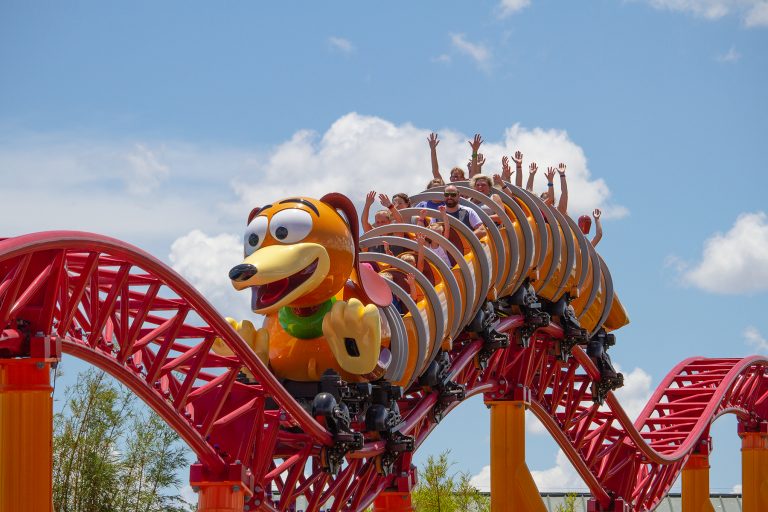
Photo: TheCoasterKings.com
Here are the other average waits at the park:
- Millennium Falcon: Smugglers Run – 85 minutes, up 7
- Rock ‘n’ Roller Coaster Starring Aerosmith – 75 minutes, up 12
- Toy Story Mania! – 73 minutes, down 2
- Mickey & Minnie’s Runaway Railway – 68 minutes, up 4
- Twilight Zone Tower of Terror – 57 minutes, down 16
- Red Carpet Dreams – 43 minutes, up 3
- Alien Swirling Saucers – 38 minutes, down 1
- Meet Sulley at Walt Disney Presents… — 38 minutes, no change
- Star Tours – The Adventures Continue! – 26 minutes, up 1
- Celebrity Spotlight – 24 minutes, no change
- Lightning McQueen’s Racing Academy – 16 minutes, down 2
- Muppet*Vision 3D – 10 minutes, no change
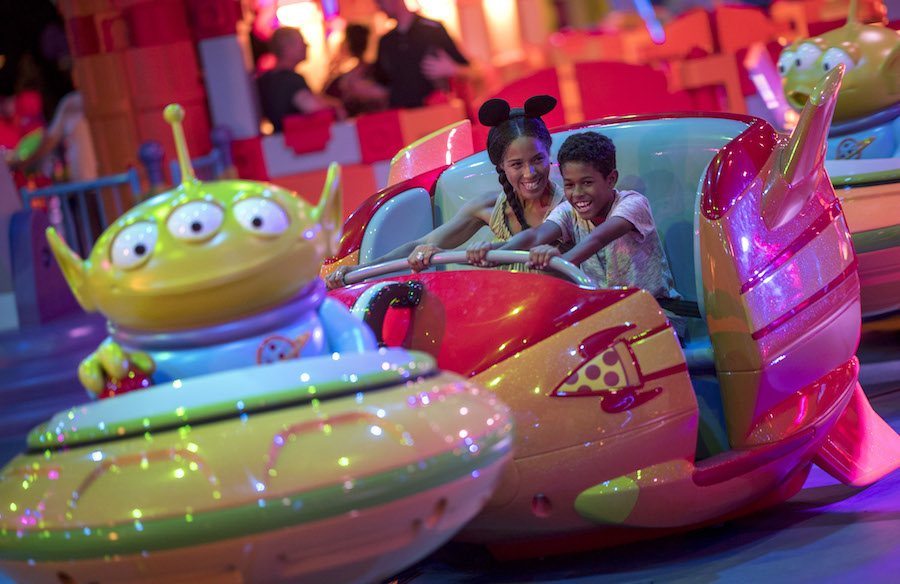
Photo: Disney
Overall, guests waited an average of 49 minutes for Hollywood Studios attractions during the holiday. That’s a drop of one minute from last time.
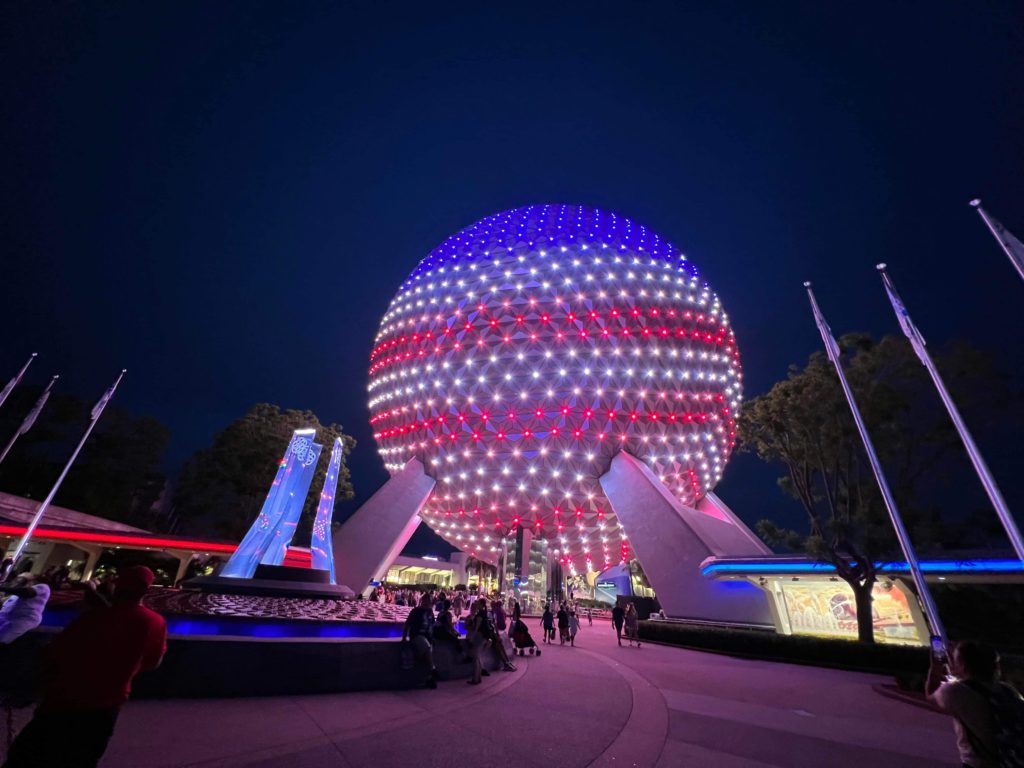
EPCOT
During the holiday week, the Big Two at EPCOT has turned into more of a big three.
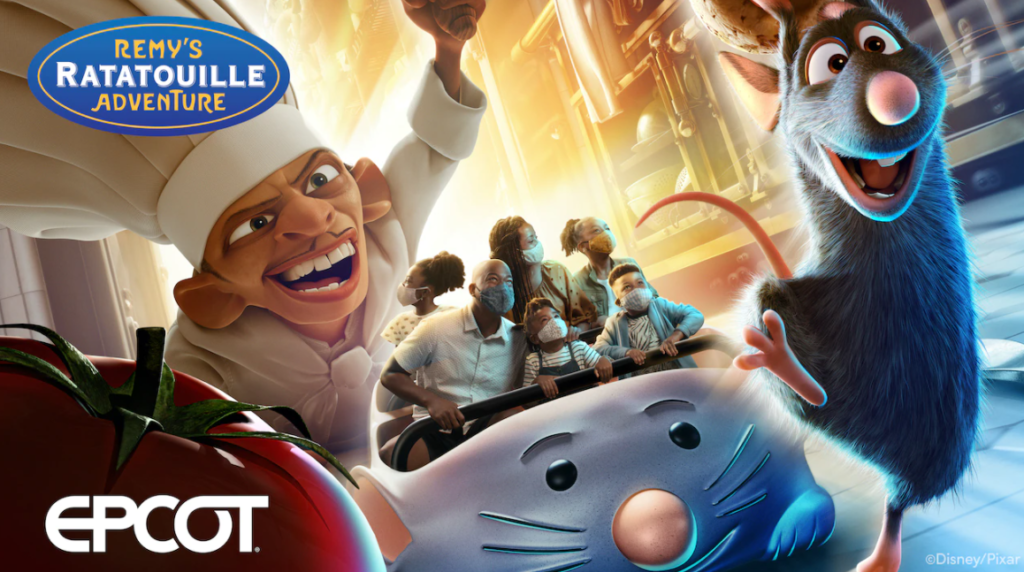
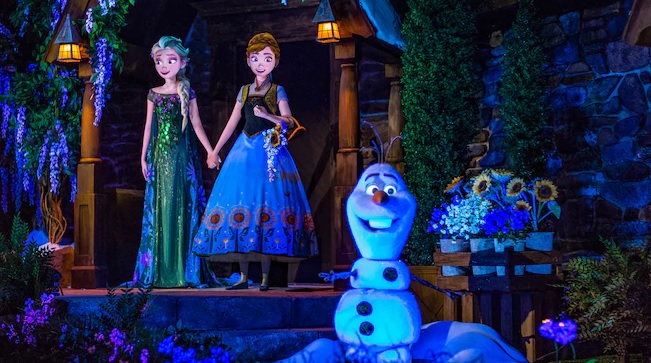
After months of Frozen Ever After and Remy’s Ratatouille Adventure flip-flopping at the top of the charts, we have a new leader this week.
Test Track required the longest average wait at 71 minutes, the same as last week. While it held at the same spot, the other two attractions reduced their wait times.
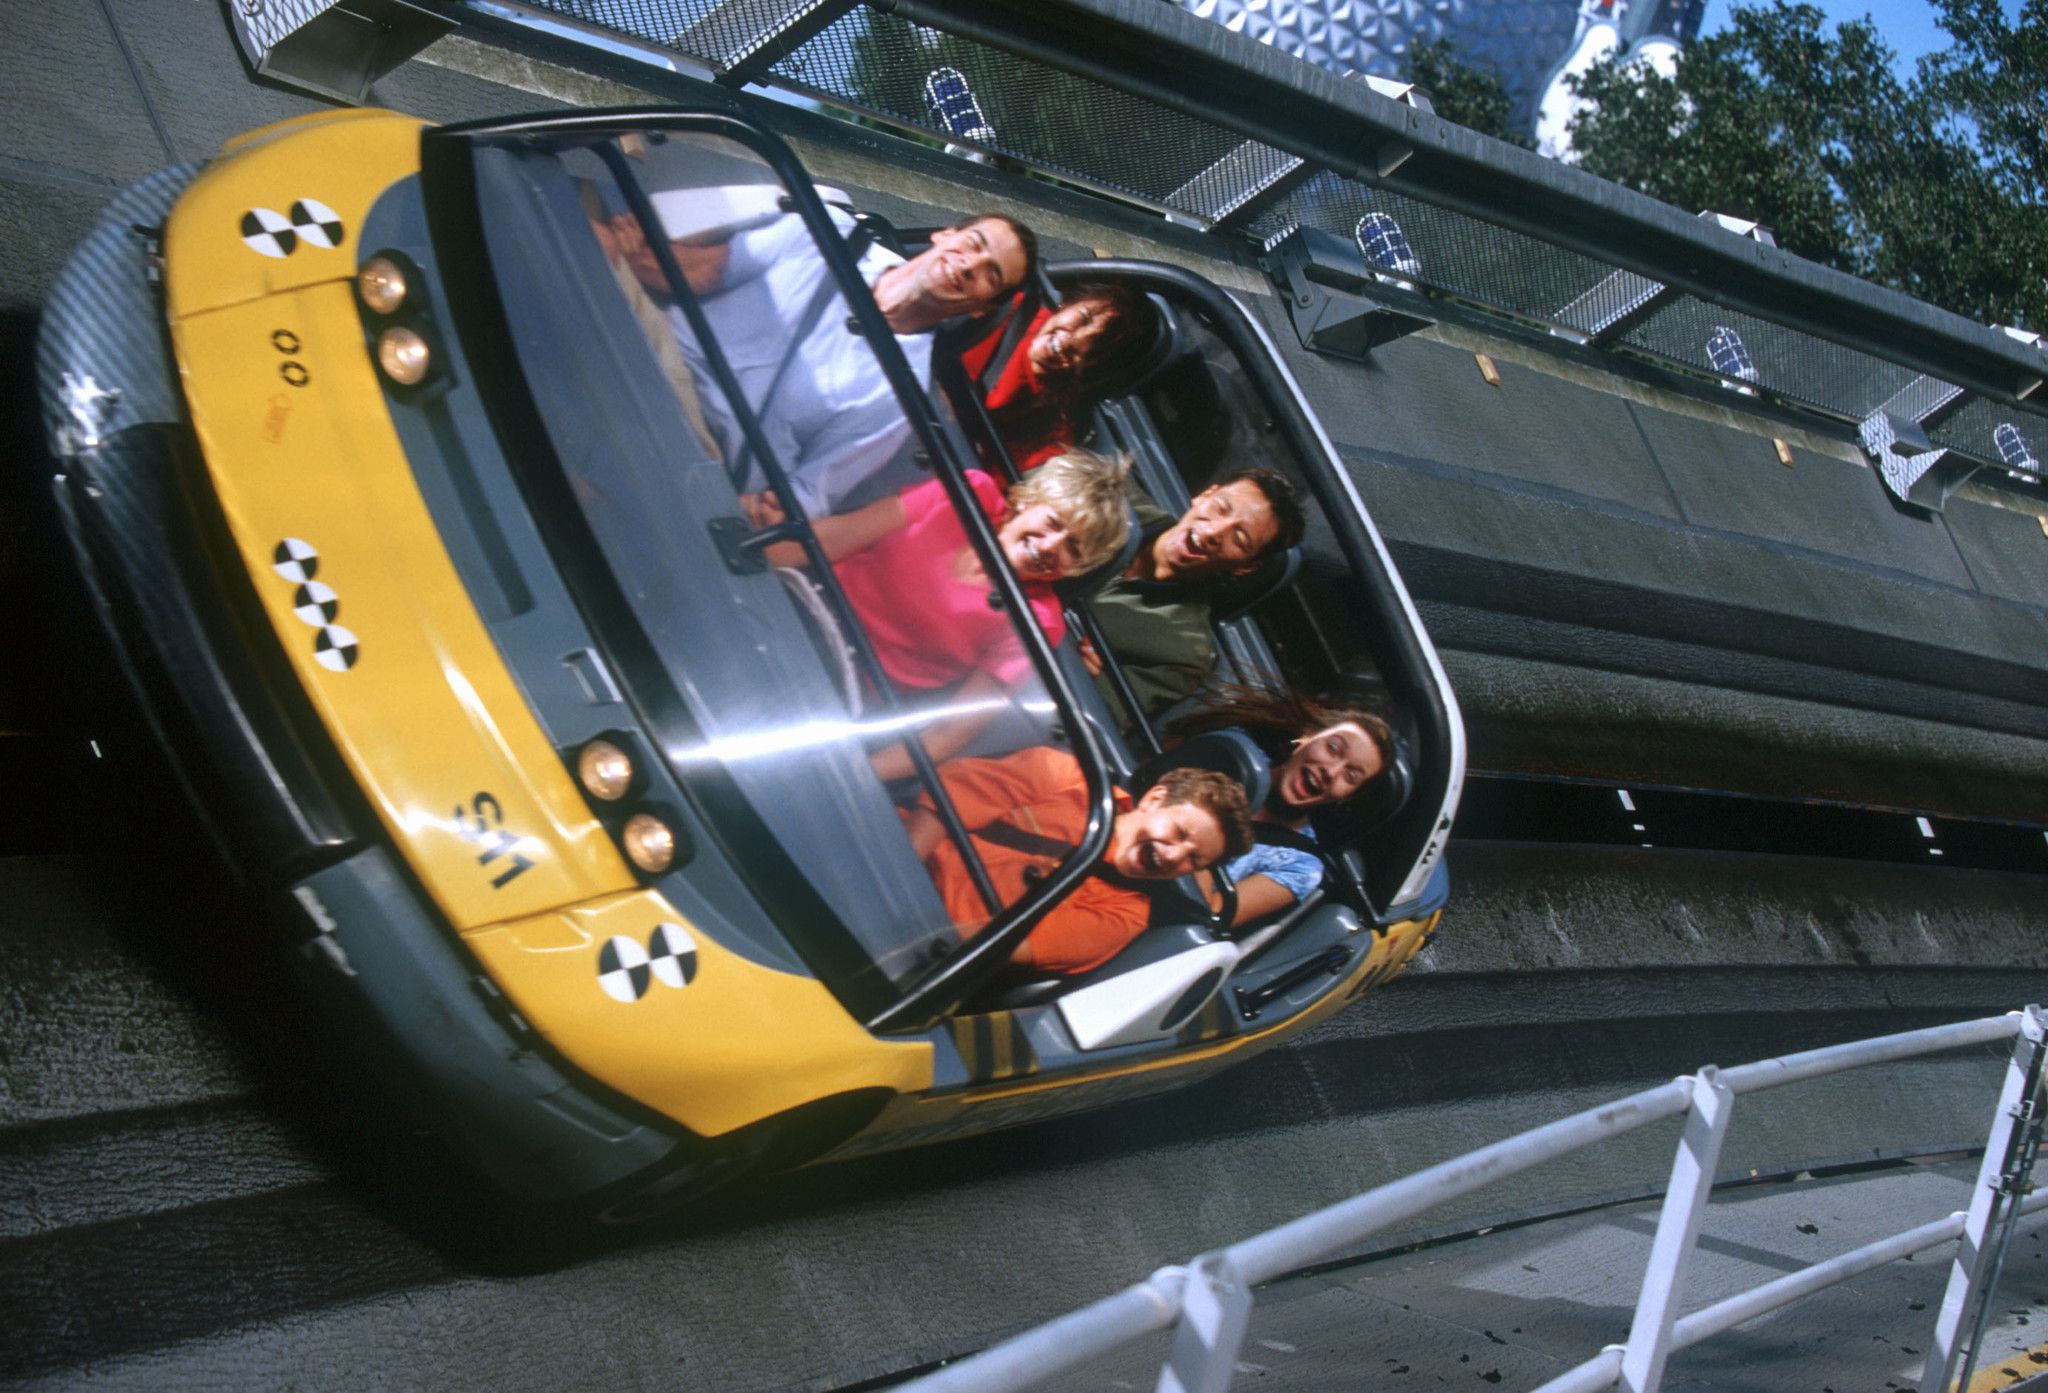
Photo: Disney
Frozen Ever After averaged a wait of 70 minutes, a 10-minute drop from last time.
Meanwhile, Ratatouille fell from 77 minutes to 67 minutes, also 10 minutes less week-over-week.
Credit: Disney
Here are the other EPCOT attractions:
- Soarin’ Around the World – 44 minutes, down 15
- Mission: SPACE – 42 minutes, down 3
- Royal Sommerhus – 22 minutes, down 8
- Turtle Talk with Crush – 22 minutes, no change
- Spaceship Earth – 18 minutes, down 7
- Living with the Land – 15 minutes, down 4
- Journey into Imagination with Figment – 14 minutes, down 6
- Gran Fiesta Tour Starring the Three Caballeros – 13 minutes, down 2
- The Seas with Nemo & Friends – 10 minutes, down 13
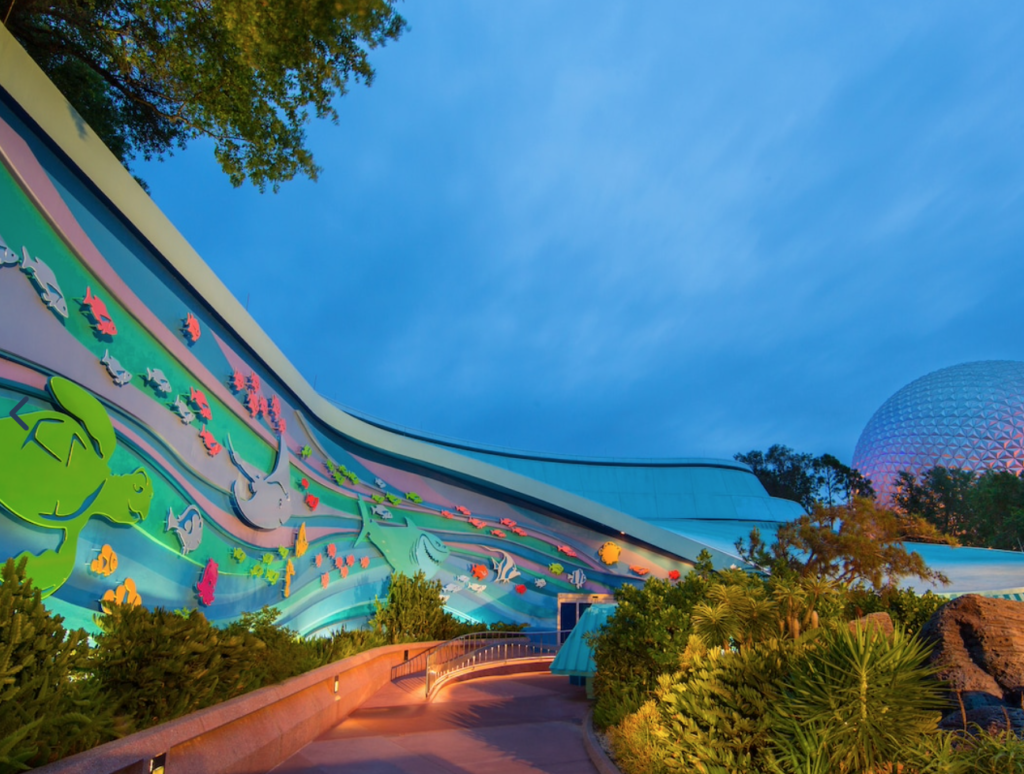
Photo: Disney
Obviously, EPCOT was the place to be during the holiday weekend.
Guests waited for an average of 32 minutes for all the attractions, a drop of seven minutes from last week.
These numbers border on incomprehensible for the July 4th holiday.
Say what you will about Disney’s current policies. They’re definitely doing the trick when it comes to crowd control.
Magic Kingdom
You may recall that Magic Kingdom behaved anomalously last week. While the other three parks slowed down, it sped up.
So, I’m curious about what happened during the holidays. Notably, Seven Dwarfs Mine Train dropped 18 minutes to an average wait of 92 minutes.
Already, we’re trending toward a calm 4th of July holiday weekend at Magic Kingdom. Here are the other park wait times:
- Peter Pan’s Flight — 73 minutes, down 5
- Jungle Cruise – 63 minutes, down 20
- Splash Mountain – 60 minutes, down 15
- Space Mountain – 52 minutes, no change
- Buzz Lightyear’s Space Ranger Spin – 50 minutes, down 2
- Princess Fairytale Hall – 44 minutes, down 3
- Haunted Mansion – 42 minutes, down 18
- Pirates of the Caribbean – 40 minutes, down 15
- Big Thunder Mountain Railroad – 39 minutes, down 12
- The Many Adventures of Winnie the Pooh – 38 minutes, down 7
- Astro Orbiter – 37 minutes, down 12
- Town Square Theater – 36 minutes, down 6
- Tomorrowland Speedway – 32 minutes, up 1
- It’s a Small World – 31 minutes, down 10
- Under the Sea ~ Journey of the Little Mermaid – 26 minutes, down 11
- The Magic Carpets of Aladdin – 22 minutes, down 7
- Monsters, Inc. Laugh Floor – 20 minutes, no change
- The Barnstormer – 18 minutes, down 10
- Dumbo the Flying Elephant – 17 minutes, down 10
- Mickey’s PhilharMagic – 17 minutes, down 8
- Mad Tea Party – 15 minutes, down 3
- Tomorrowland Transit Authority PeopleMover – 15 minutes, down 6
- Prince Charming Regal Carrousel – 12 minutes, down 2
- Walt Disney’s Carousel of Progress – 5 minutes, no change
- Country Bear Jamboree – 5 minutes, no change
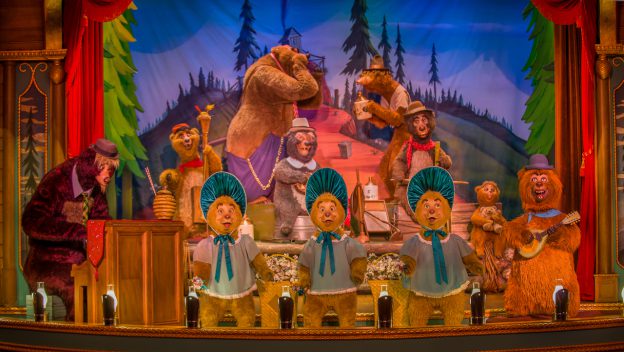
Photo: Disney
Overall, Magic Kingdom attractions averaged a wait of 36 minutes, a substantial drop of nine minutes or 20 percent from last time.
So, there you have it. We’ve got empirical data showing that Park Passes function effectively as crowd control during the holidays.
Thanks for visiting MickeyBlog.com! Want to go to Disney? For a FREE quote on your next Disney vacation, please fill out the form below and one of the agents from MickeyTravels, a Platinum level Authorized Disney Vacation Planner, will be in touch soon!
Feature Photo: Disney