Walt Disney World Wait Times for Third Week of September 2023
Okay, we’ve had plenty of impactful factors with Disney crowds before, but I can honestly say we had something new this time.
On one day last week, one Disney theme park’s lines soared in size due to…a wild bear.
Photo:visitorlando.com
How will this affect Walt Disney World wait times for the third week of September 2023? I honestly have no idea, but it sure is weird.
Disney’s Animal Kingdom
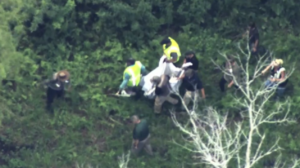
Photo: WESH
I’m mostly joking here because the random bear sighting couldn’t impact the other parks.
After all, Disney doesn’t allow Park Hopping until the afternoons. The bear had already come down from its tree by then.
So, only Magic Kingdom experienced any sort of bear-related crowd increases, and that was just for one park for part of one day.
Still, we do have one other factor to consider this week. We’ll get to that when we discuss EPCOT.
For now, here are Animal Kingdom’s average waits for the past week:
- Avatar Flight of Passage – 95 minutes, up 14
- Na’vi River Journey – 75 minutes, up 4
- Adventurers Outpost – 49 minutes, up 1
- Kilimanjaro Safaris – 37 minutes, up 9
- Expedition Everest – 31 minutes, up 5
- Kali River Rapids – 28 minutes, up 1
- DINOSAUR – 26 minutes, no change
- It’s Tough to Be a Bug! – 10 minutes, no change
- TriceraTop Spin – 10 minutes, up 1
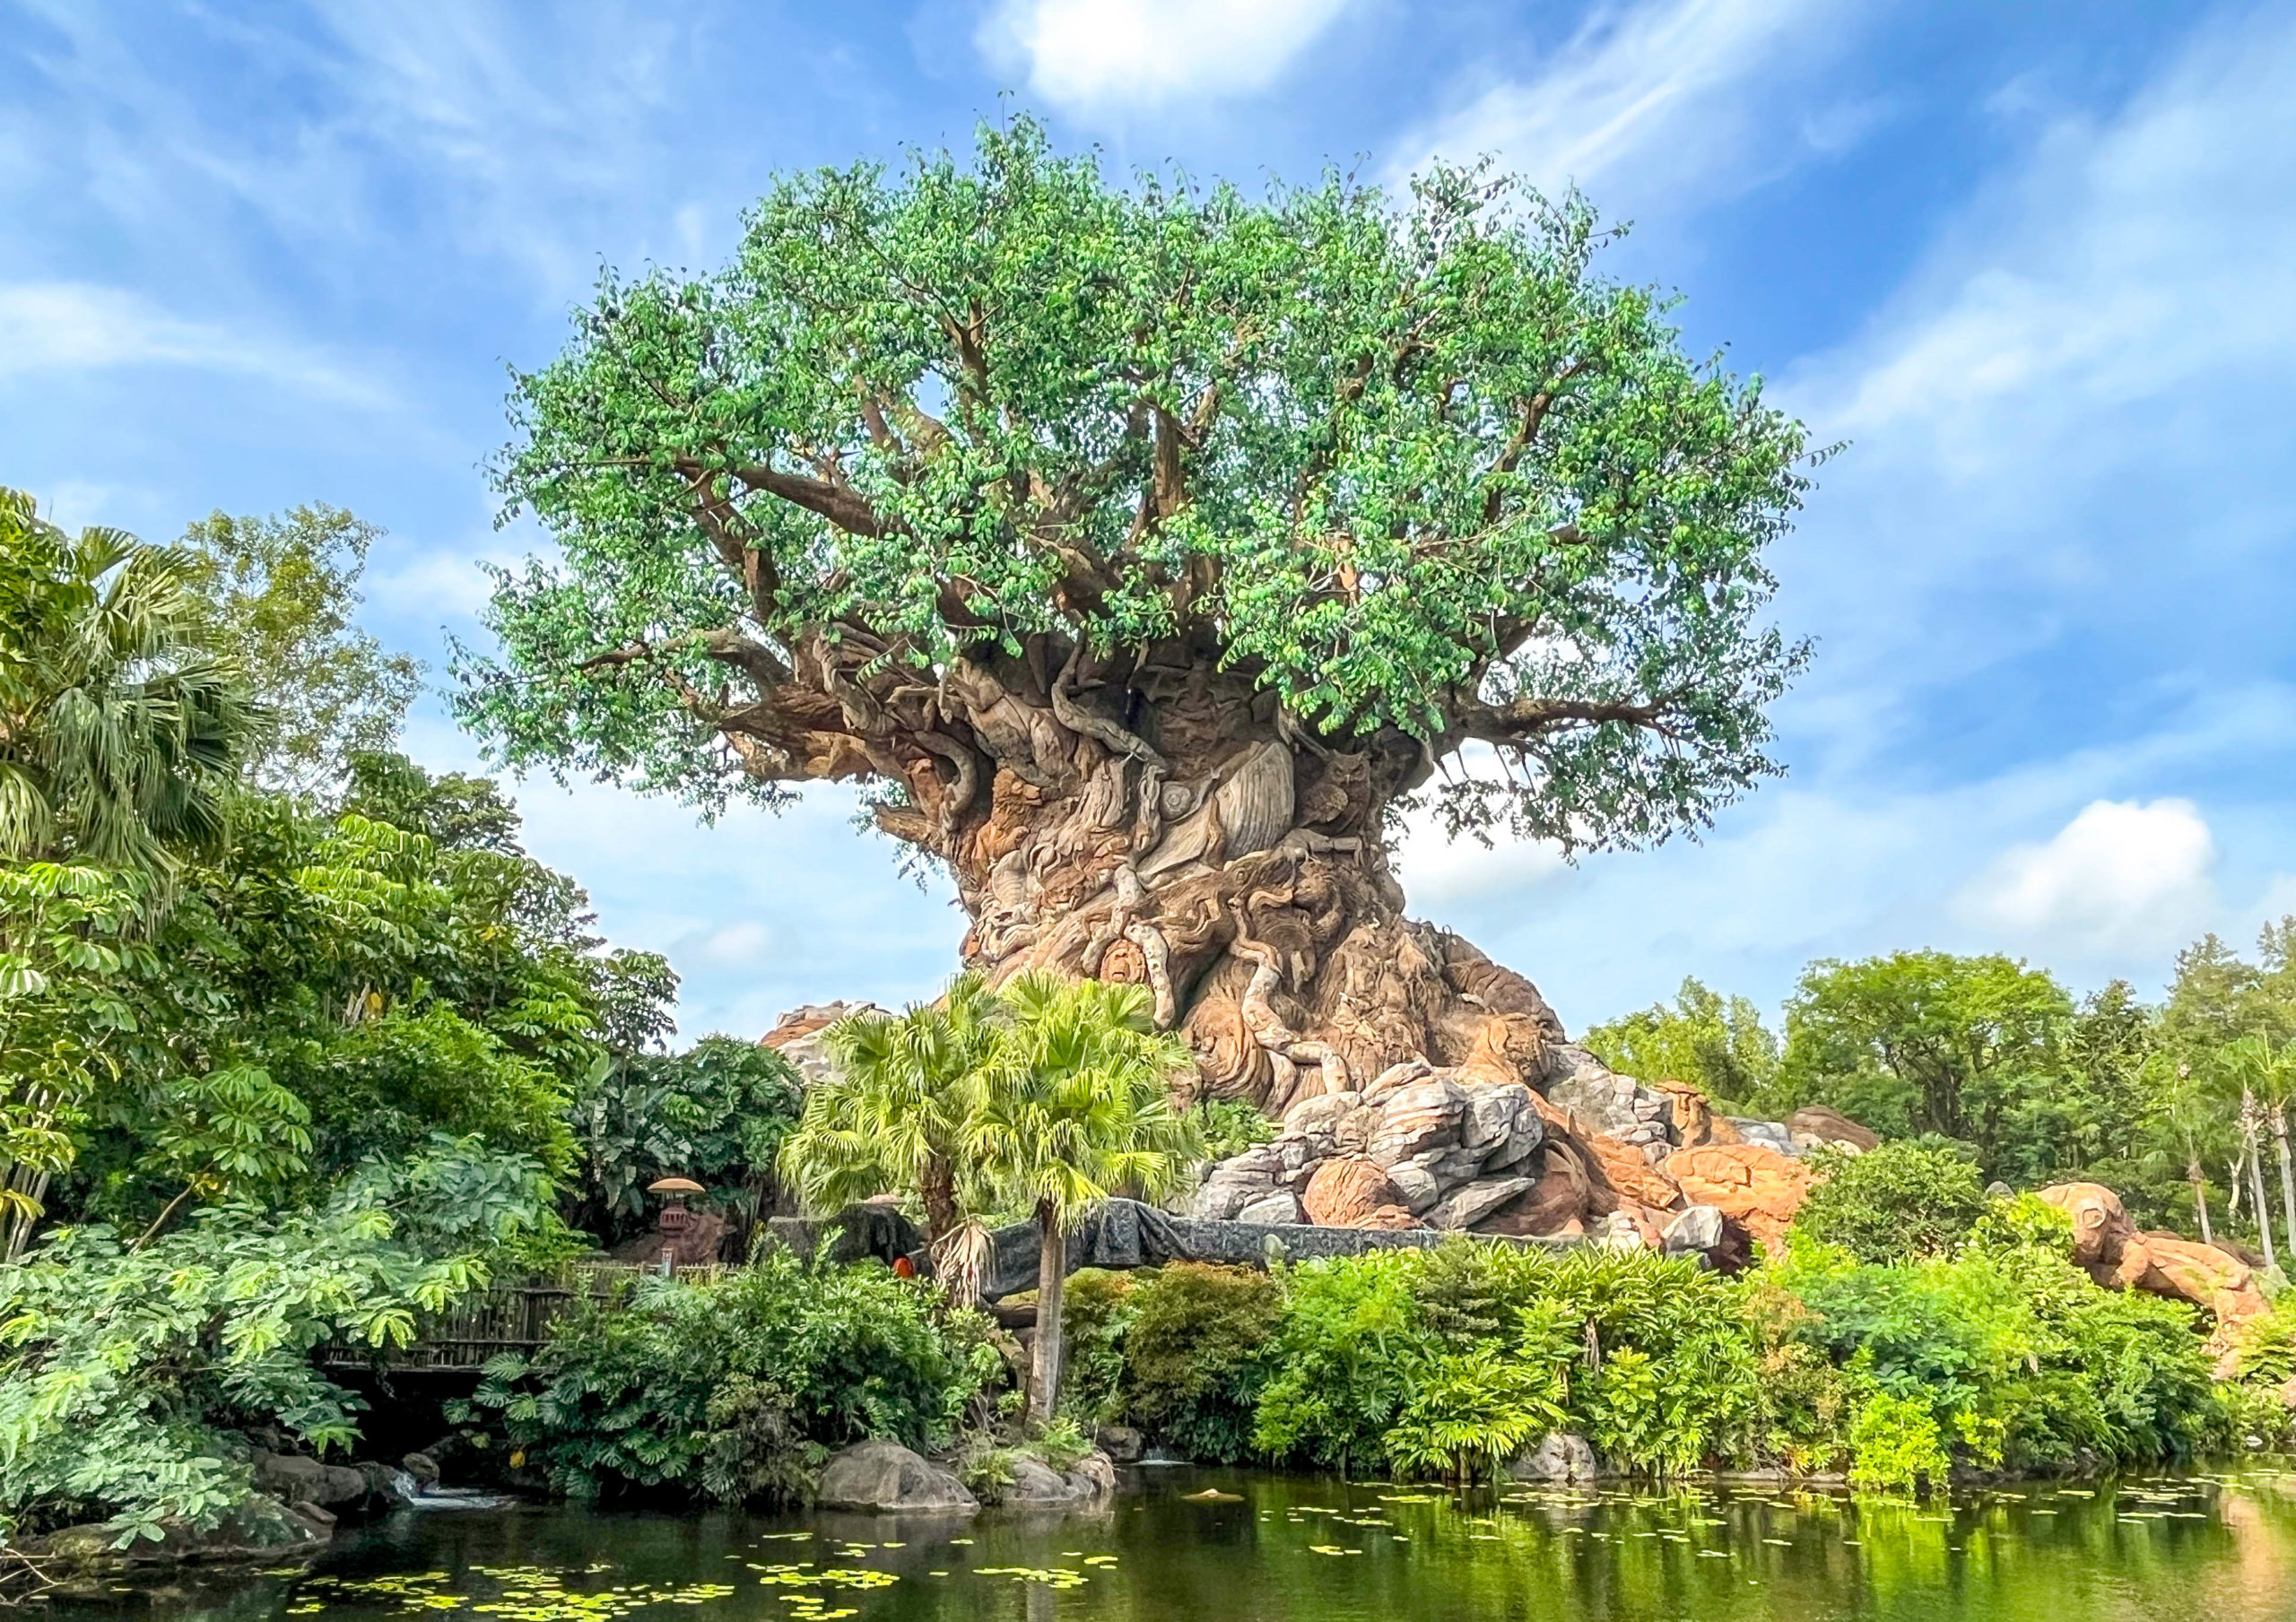
Tree of Life
Yes, every attraction at Animal Kingdom either increased its average wait or stayed the same as last week.
That tells the story, as attractions here averaged a wait of 40 minutes, which is five minutes or 15 percent more than last time.
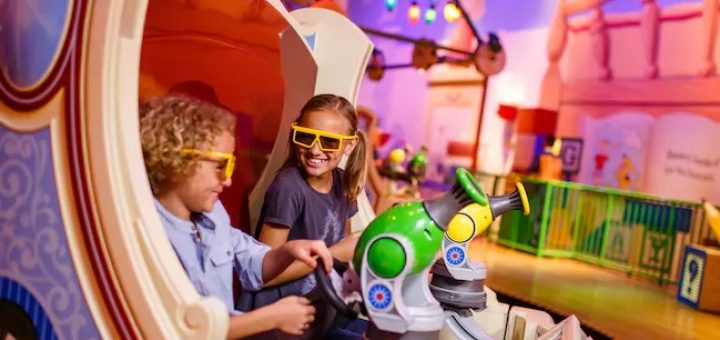
Disney’s Hollywood Studios
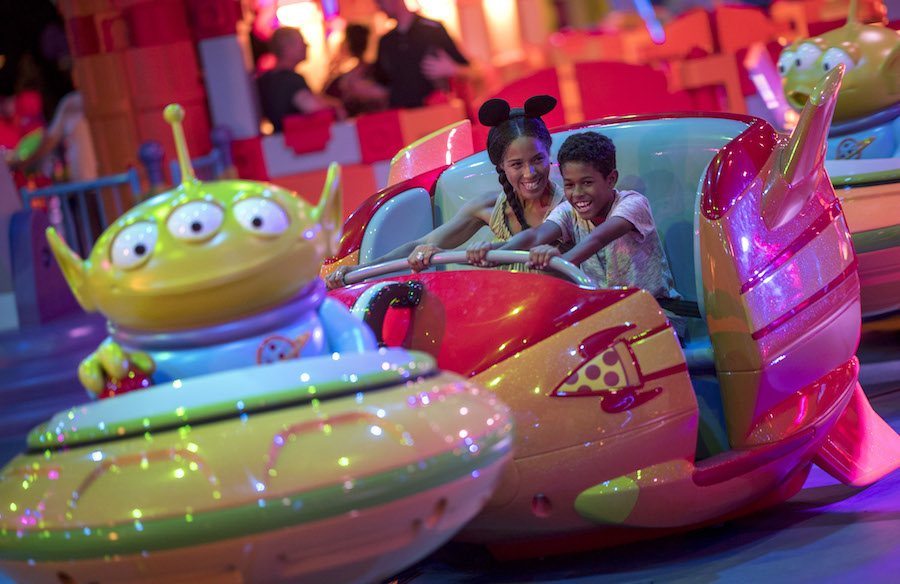
Photo: Disney
Anecdotally, a few people reported smaller crowds at Hollywood Studios last week.
I’d warned them to brace for the worst so that they’d be pleasantly surprised…and my goodness, were they ever!
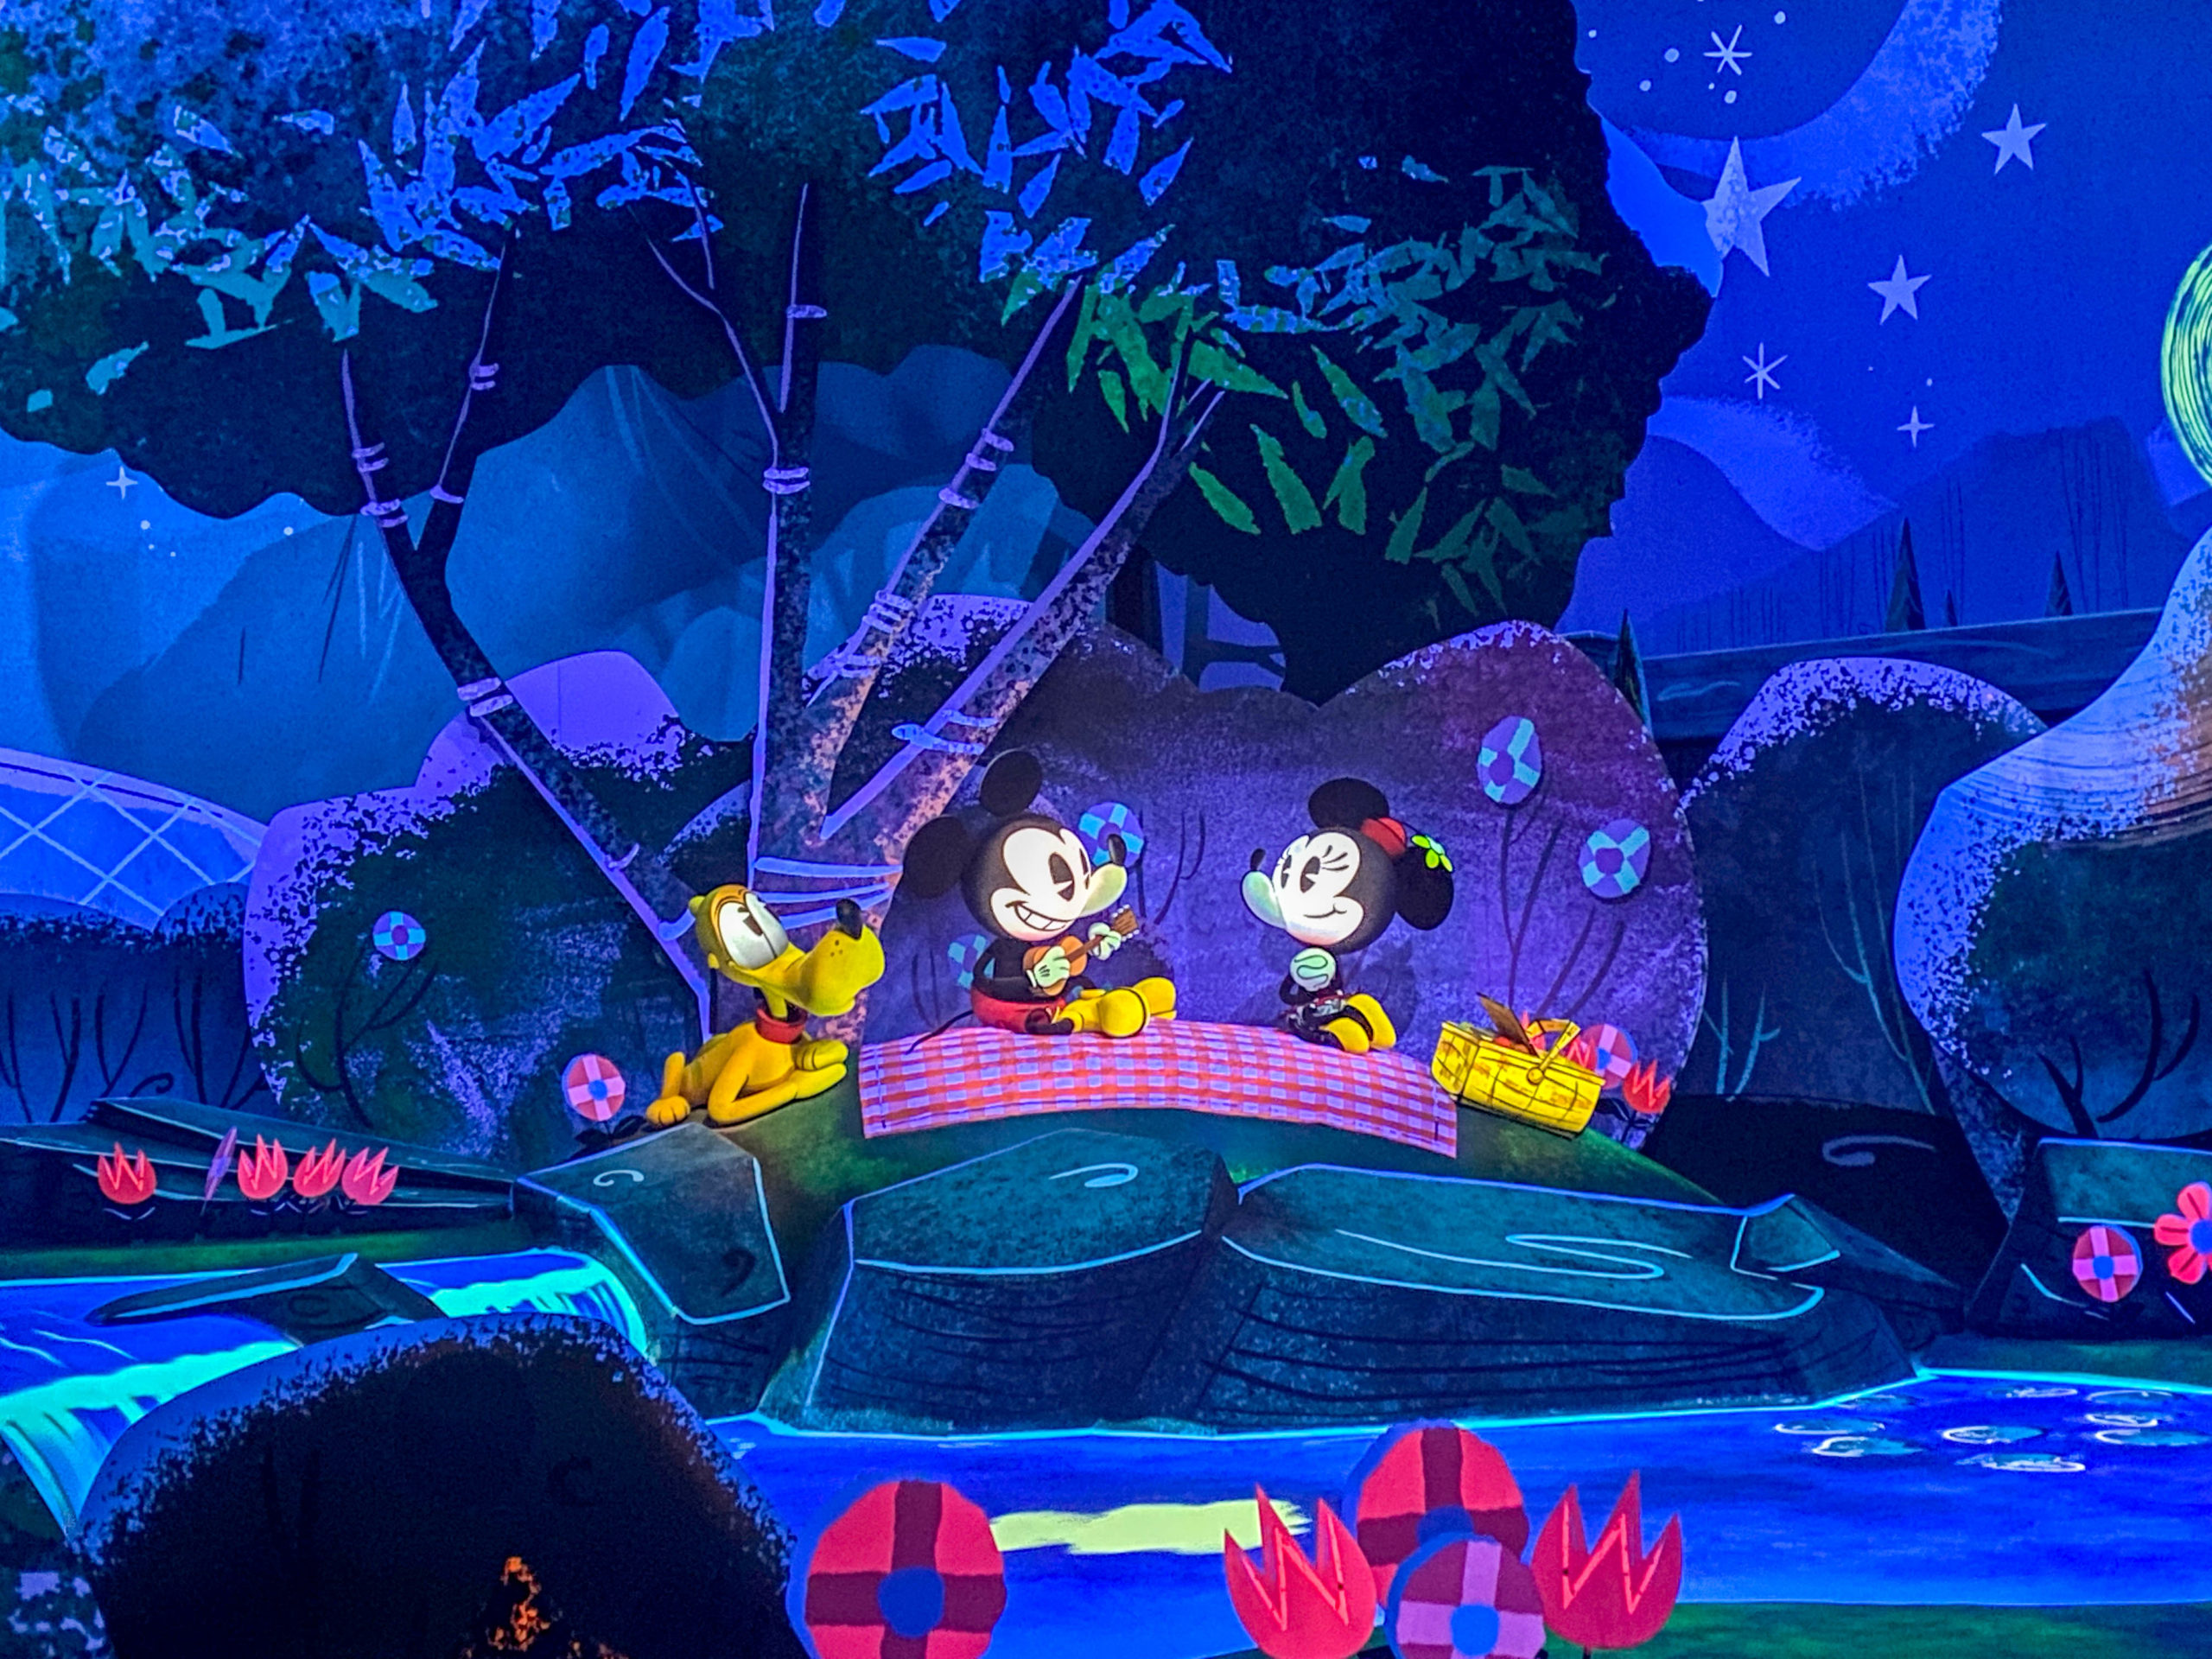
Mickey & Minnie’s Runaway Railway
They seemed to think I’d pranked them because they accomplished so much at this park compared to others.
Was that a fluke? It’s always possible since luck plays a significant factor in any park visit.
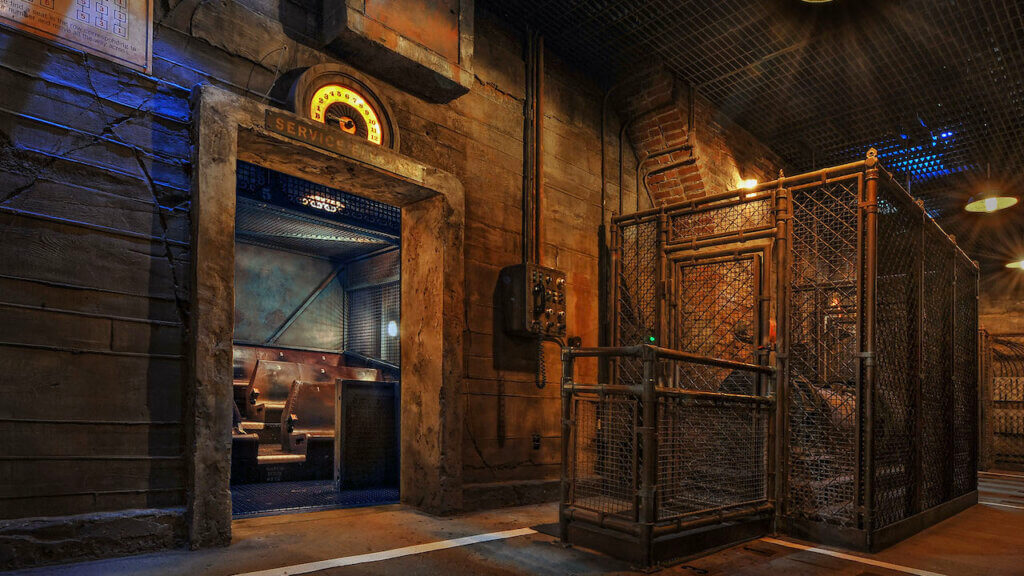
Photo: The Orlando Real
Here are the average wait times at Hollywood Studios last week:
- Slinky Dog Dash – 89 minutes, up 20
- Star Wars: Rise of the Resistance – 82 minutes, up 14
- Mickey & Minnie’s Runaway Railway – 65 minutes, up 10
- Toy Story Mania! – 65 minutes, up 10
- Millennium Falcon: Smugglers Run – 64 minutes, up 14
- Rock ‘n’ Roller Coaster Starring Aerosmith – 64 minutes, up 7
- Twilight Zone Tower of Terror – 51 minutes, down 2
- Red Carpet Dreams – 42 minutes, up 1
- Alien Swirling Saucers – 38 minutes, up 11
- Celebrity Spotlight – 21 minutes, up 3
- Star Tours – The Adventures Continue! – 16 minutes, up 2
- Lightning McQueen’s Racing Academy – 13 minutes, down 3
- Muppet*Vision 3D – 10 minutes, no change
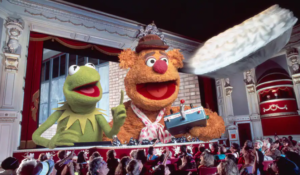
Photo: Disney
So, yes, my friends were extremely lucky. This information could prove essential for your next trip, though.
The disparity underscores how much perception and fortune play roles in wait times.
What you see and hear may not align with what the data suggests after the fact.
Overall, the average attraction at Hollywood Studios required a wait of 46 minutes, which is eight minutes or 21 percent more than last time.
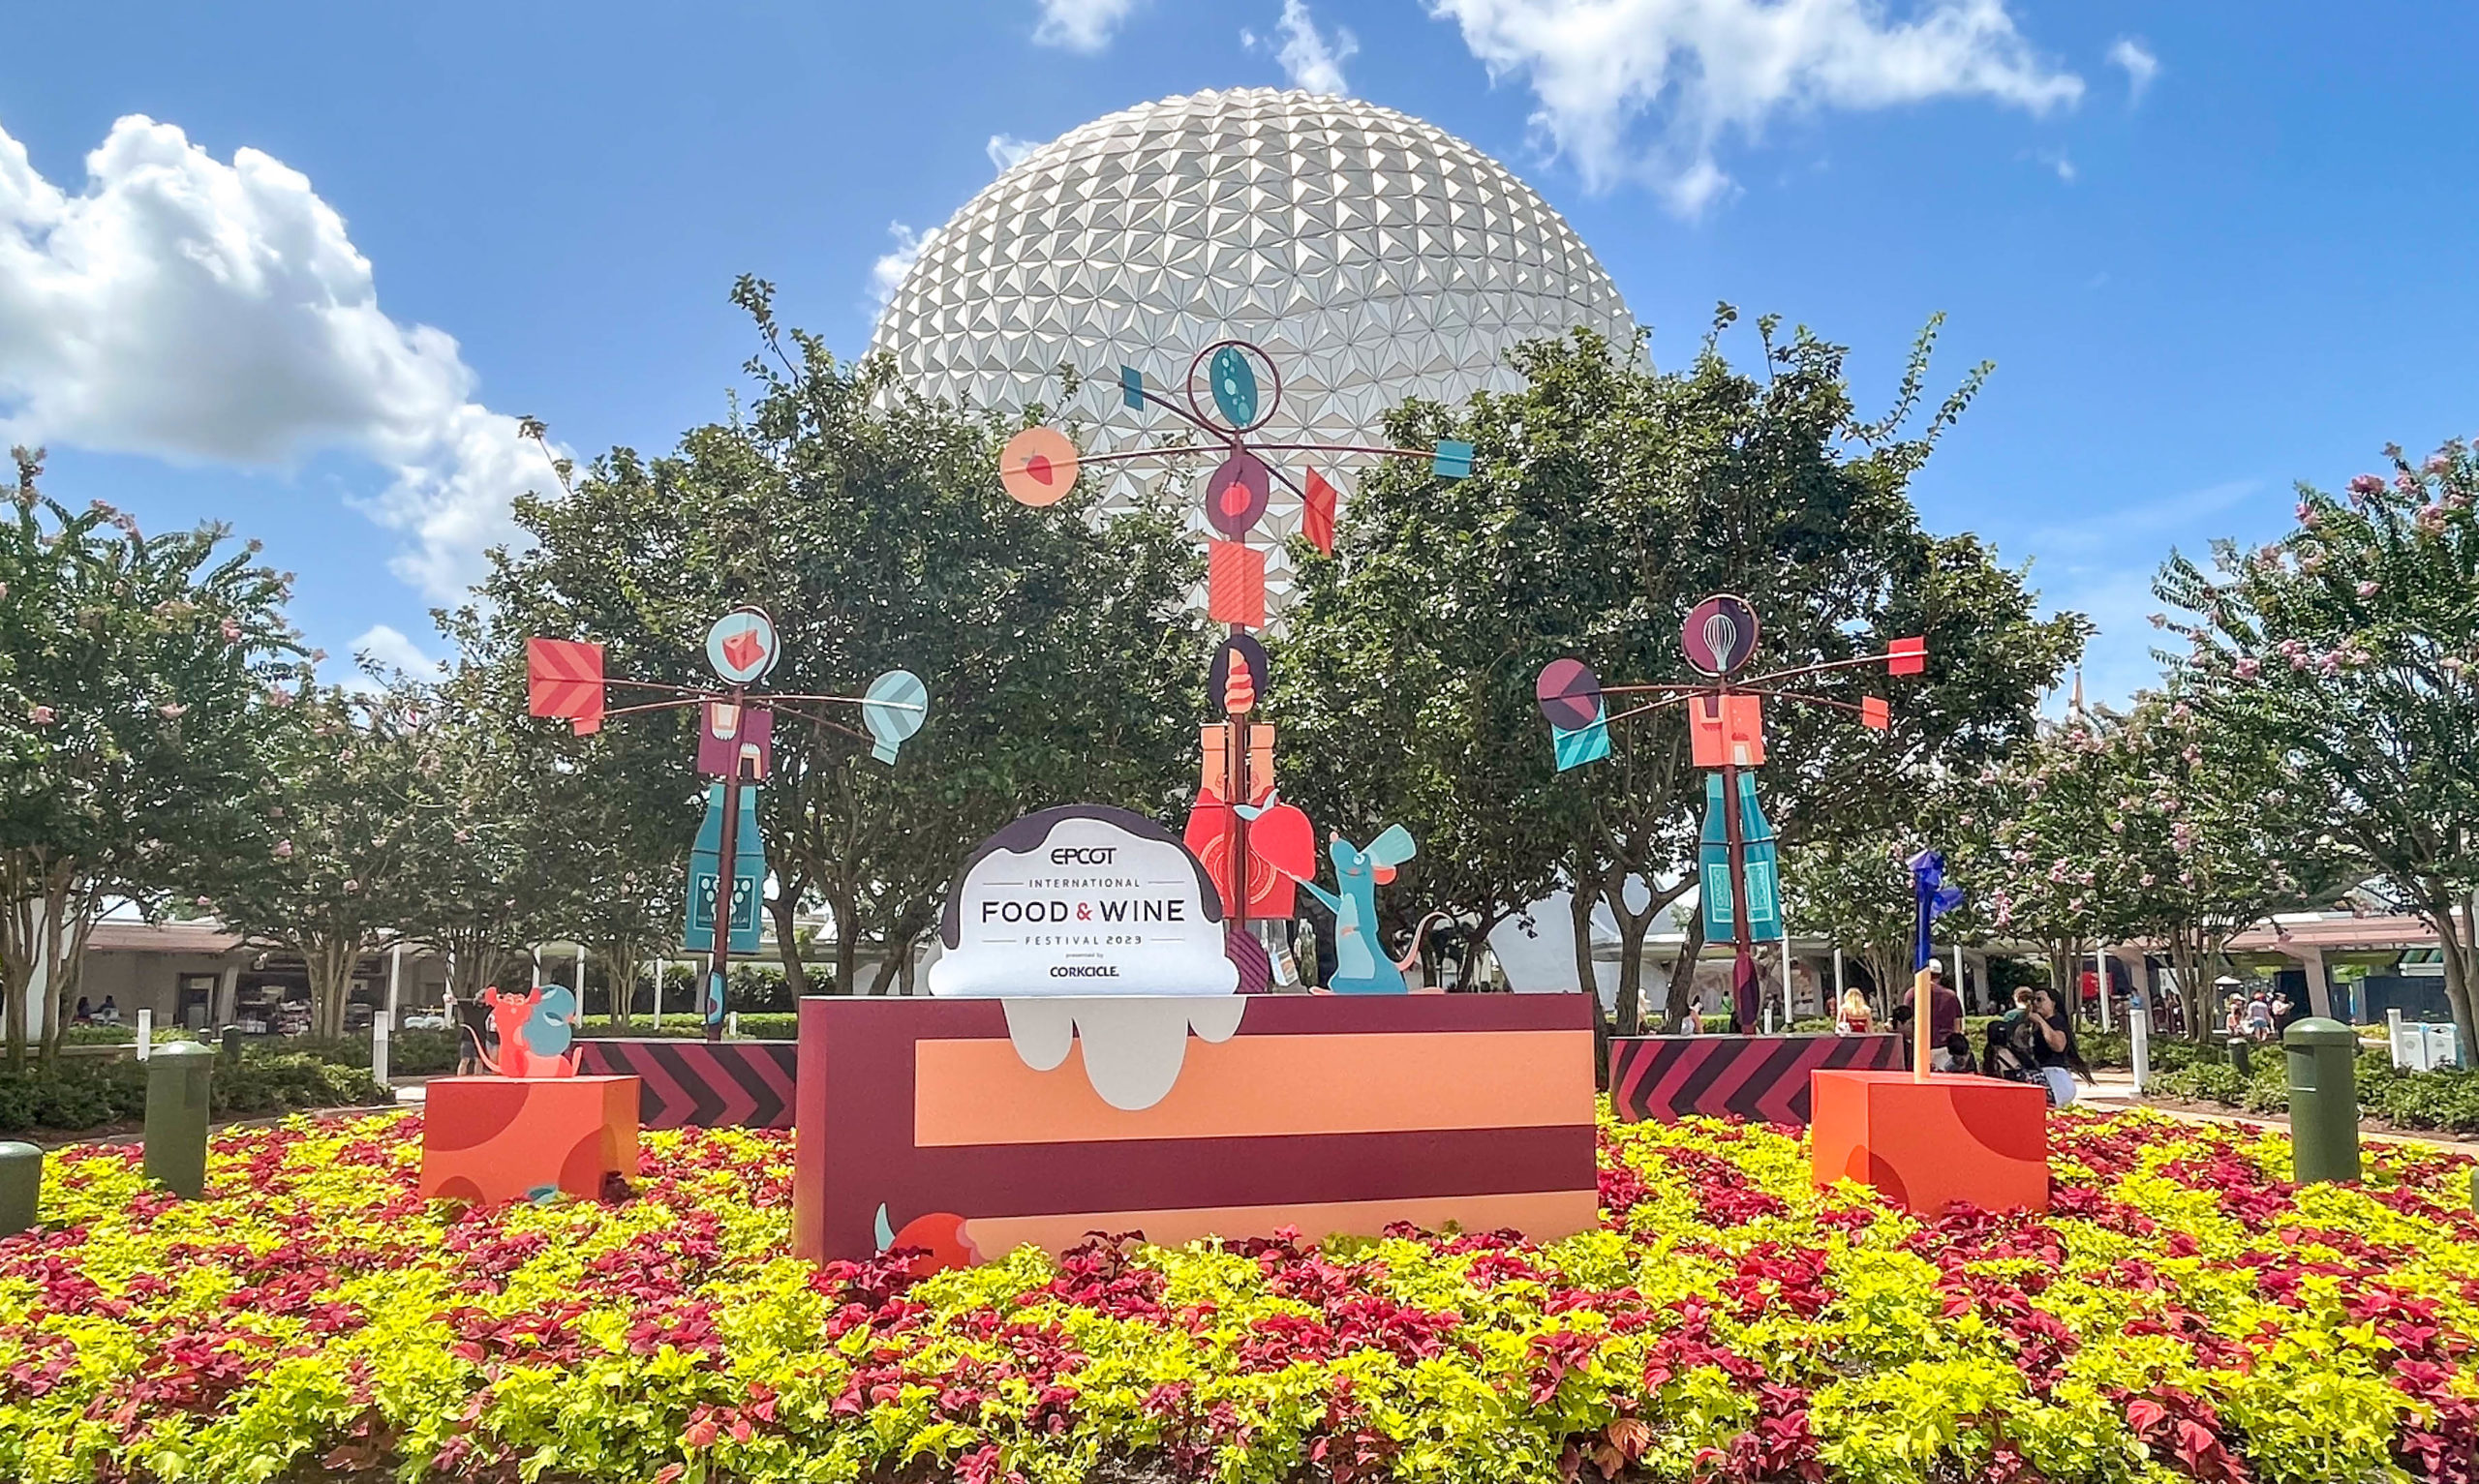
EPCOT
Here’s the only park with a minimal amount of novelty to its crowd behavior this past week.
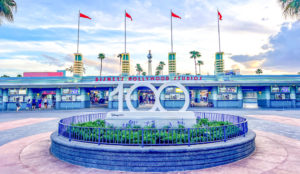
On September 22nd, the Disney100 event started with EPCOT functioning as home base.
![]()
This celebration factored into three of the seven days this past week. Did that increase any wait times? Let’s check!
Here are EPCOT’s average waits for the last seven days.
- Frozen Ever After – 82 minutes, up 5
- Soarin’ Over California (!) – 79 minutes, up 27
- Remy’s Ratatouille Adventure – 76 minutes, up 15
- Test Track – 63 minutes, up 8
- Royal Sommerhus – 37 minutes, up 4
- Mission: SPACE – 25 minutes, up 6
- Spaceship Earth – 23 minutes, up 6
- Journey into Imagination with Figment – 21 minutes, no change
- The Seas with Nemo & Friends – 20 minutes, up 4
- Living with the Land – 19 minutes, up 6
- Turtle Talk with Crush – 18 minutes, down 1
- Gran Fiesta Tour Starring the Three Caballeros – 17 minutes, up 3
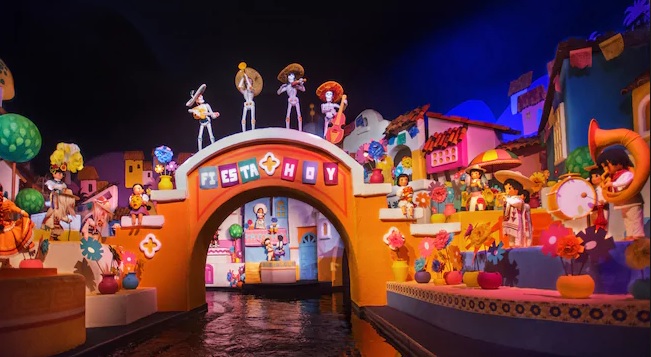
Image: Disney
Overall, guests stood in line for an average of 37 minutes per attraction, which is five minutes or 16 percent more than last time.
So, Disney100 did factor into part of this, but I should mention another impactful change as well.

Soarin’ Over California
That’s not a typo listed above. During Disney100, EPCOT is showing Soarin’ Over California again rather than Soarin’ Around the World.
MickeyBlog posted pictures and video of the attraction’s return. You can tell from the wait times in this area that the Classic Soarin’ proved a draw.
That’s unsurprising in that it happens each year at Disney California Adventure as well.
You should expect Soarin’ to remain more crowded than usual during Disney100.
By the way, we’re not tracking Moana since it’s a walkthrough attraction. You should know that it started as a virtual queue before switching to standby, though.
Magic Kingdom
Whenever I think about Magic Kingdom’s last week, this episode of The Simpsons springs to mind:
It’s literally all I can think about. Did the bear increase attractions’ average wait times last week? Here’s the data:
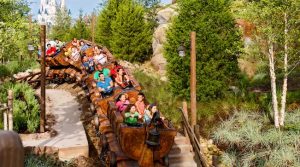
Photo: Disney
- Seven Dwarfs Mine Train – 79 minutes, up 13
- Peter Pan’s Flight – 69 minutes, up 5
- Jungle Cruise – 55 minutes, up 11
- Space Mountain – 50 minutes, up 6
- Haunted Mansion – 48 minutes, up 6
- Buzz Lightyear’s Space Ranger Spin – 41 minutes, up 7
- Pirates of the Caribbean – 40 minutes, up 8
- Ariel’s Grotto – 39 minutes, up 4
- Princess Fairytale Hall – 38 minutes, up 1
- Big Thunder Mountain Railroad – 37 minutes, up 10
- The Many Adventures of Winnie the Pooh – 36 minutes, up 3
- Pete’s Silly Sideshow – 36 minutes, up 4
- Town Square Theater – 36 minutes, no change
- Enchanted Tales with Belle – 30 minutes, up 3
- Astro Orbiter – 29 minutes, up 7
- Tomorrowland Speedway – 26 minutes, up 7
- Under the Sea ~ Journey of the Little Mermaid – 25 minutes, up 3
- It’s a Small World – 24 minutes, up 3
- The Barnstormer – 22 minutes, up 8
- Dumbo the Flying Elephant – 21 minutes, up 9
- Mickey’s PhilharMagic – 18 minutes, up 1
- Tomorrowland Transit Authority PeopleMover – 18 minutes, up 4
- The Magic Carpets of Aladdin – 16 minutes, up 4
- Monsters, Inc. Laugh Floor – 16 minutes, up 2
- Mad Tea Party – 15 minutes, up 5
- Walt Disney World Railroad – 14 minutes, down 1
- Prince Charming Regal Carrousel – 13 minutes, up 5
- Walt Disney’s Carousel of Progress – 5 minutes, no change
- Country Bear Jamboree – 5 minutes, no change
Final Thoughts

Photo: D23
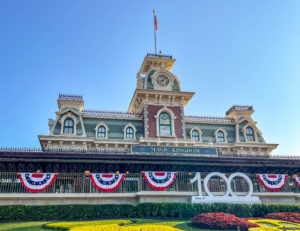
There. Was. A. Bear!!!
I’m not getting over this anytime soon. As for Magic Kingdom, guests waited for an average of 30 minutes, which is four minutes or 15 percent more than last time.
That’s really the story at the parks during mid-September. For the second straight week, average wait times almost universally increased.
Overall, the attractions increased their crowds by 15-21 percent. We can’t blame all that on the bear.
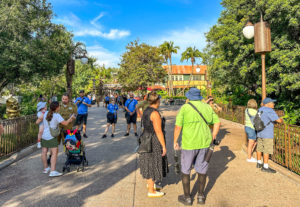
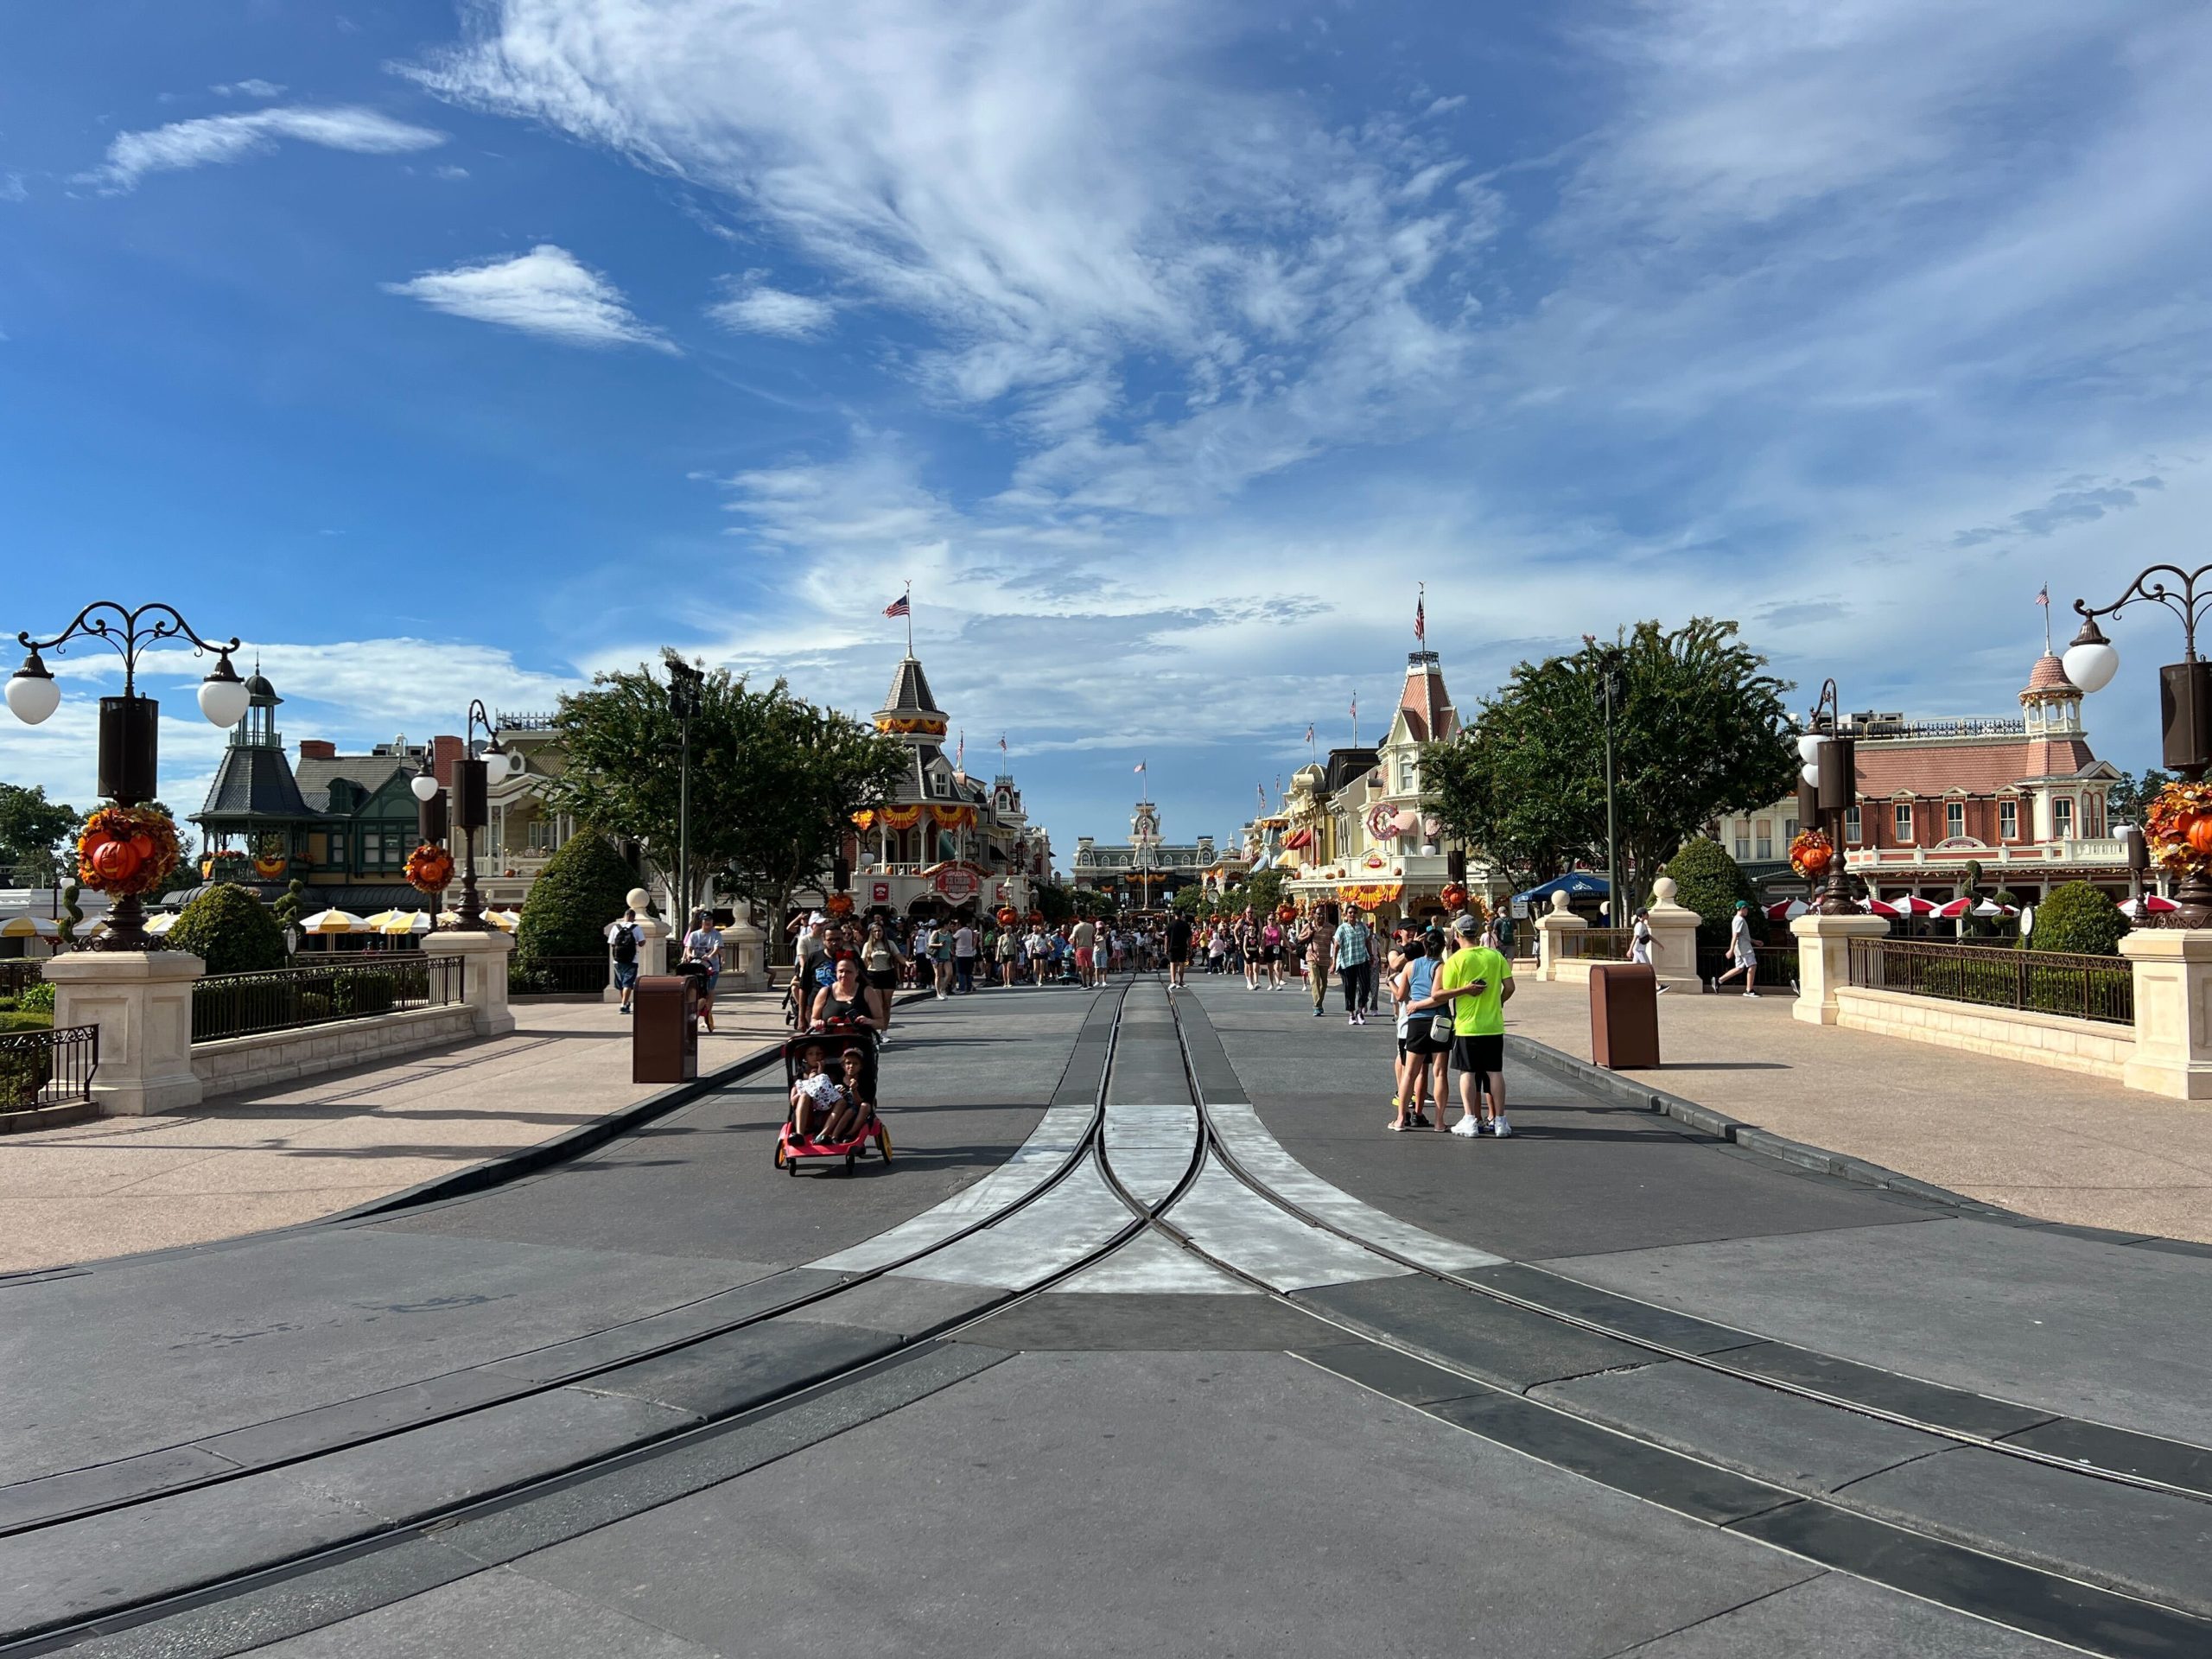
Low crowds near Cinderella Castle
Really, even though I’m having fun with the ridiculousness, it’s a non-factor other than one odd morning.
So, everything we’re seeing here reflects a more crowded Disney in September.
You can expect more of the same as Disney 100 continues and Halloween season increases park excitement even more.
Photo: MickeyBlog
Thanks for visiting MickeyBlog.com! Want to go to Disney? For a FREE quote on your next Disney vacation, please fill out the form below, and one of the agents from MickeyTravels, a Diamond Level Authorized Disney Vacation Planner, will be in touch soon!
Feature Photo: Disney