Walt Disney World Wait Times for Early April 2024
On the last day of March, many people celebrated the Easter holiday, followed by a de facto day off for many.
As typically happens in those instances, people spent as much time as possible at Disney theme parks.
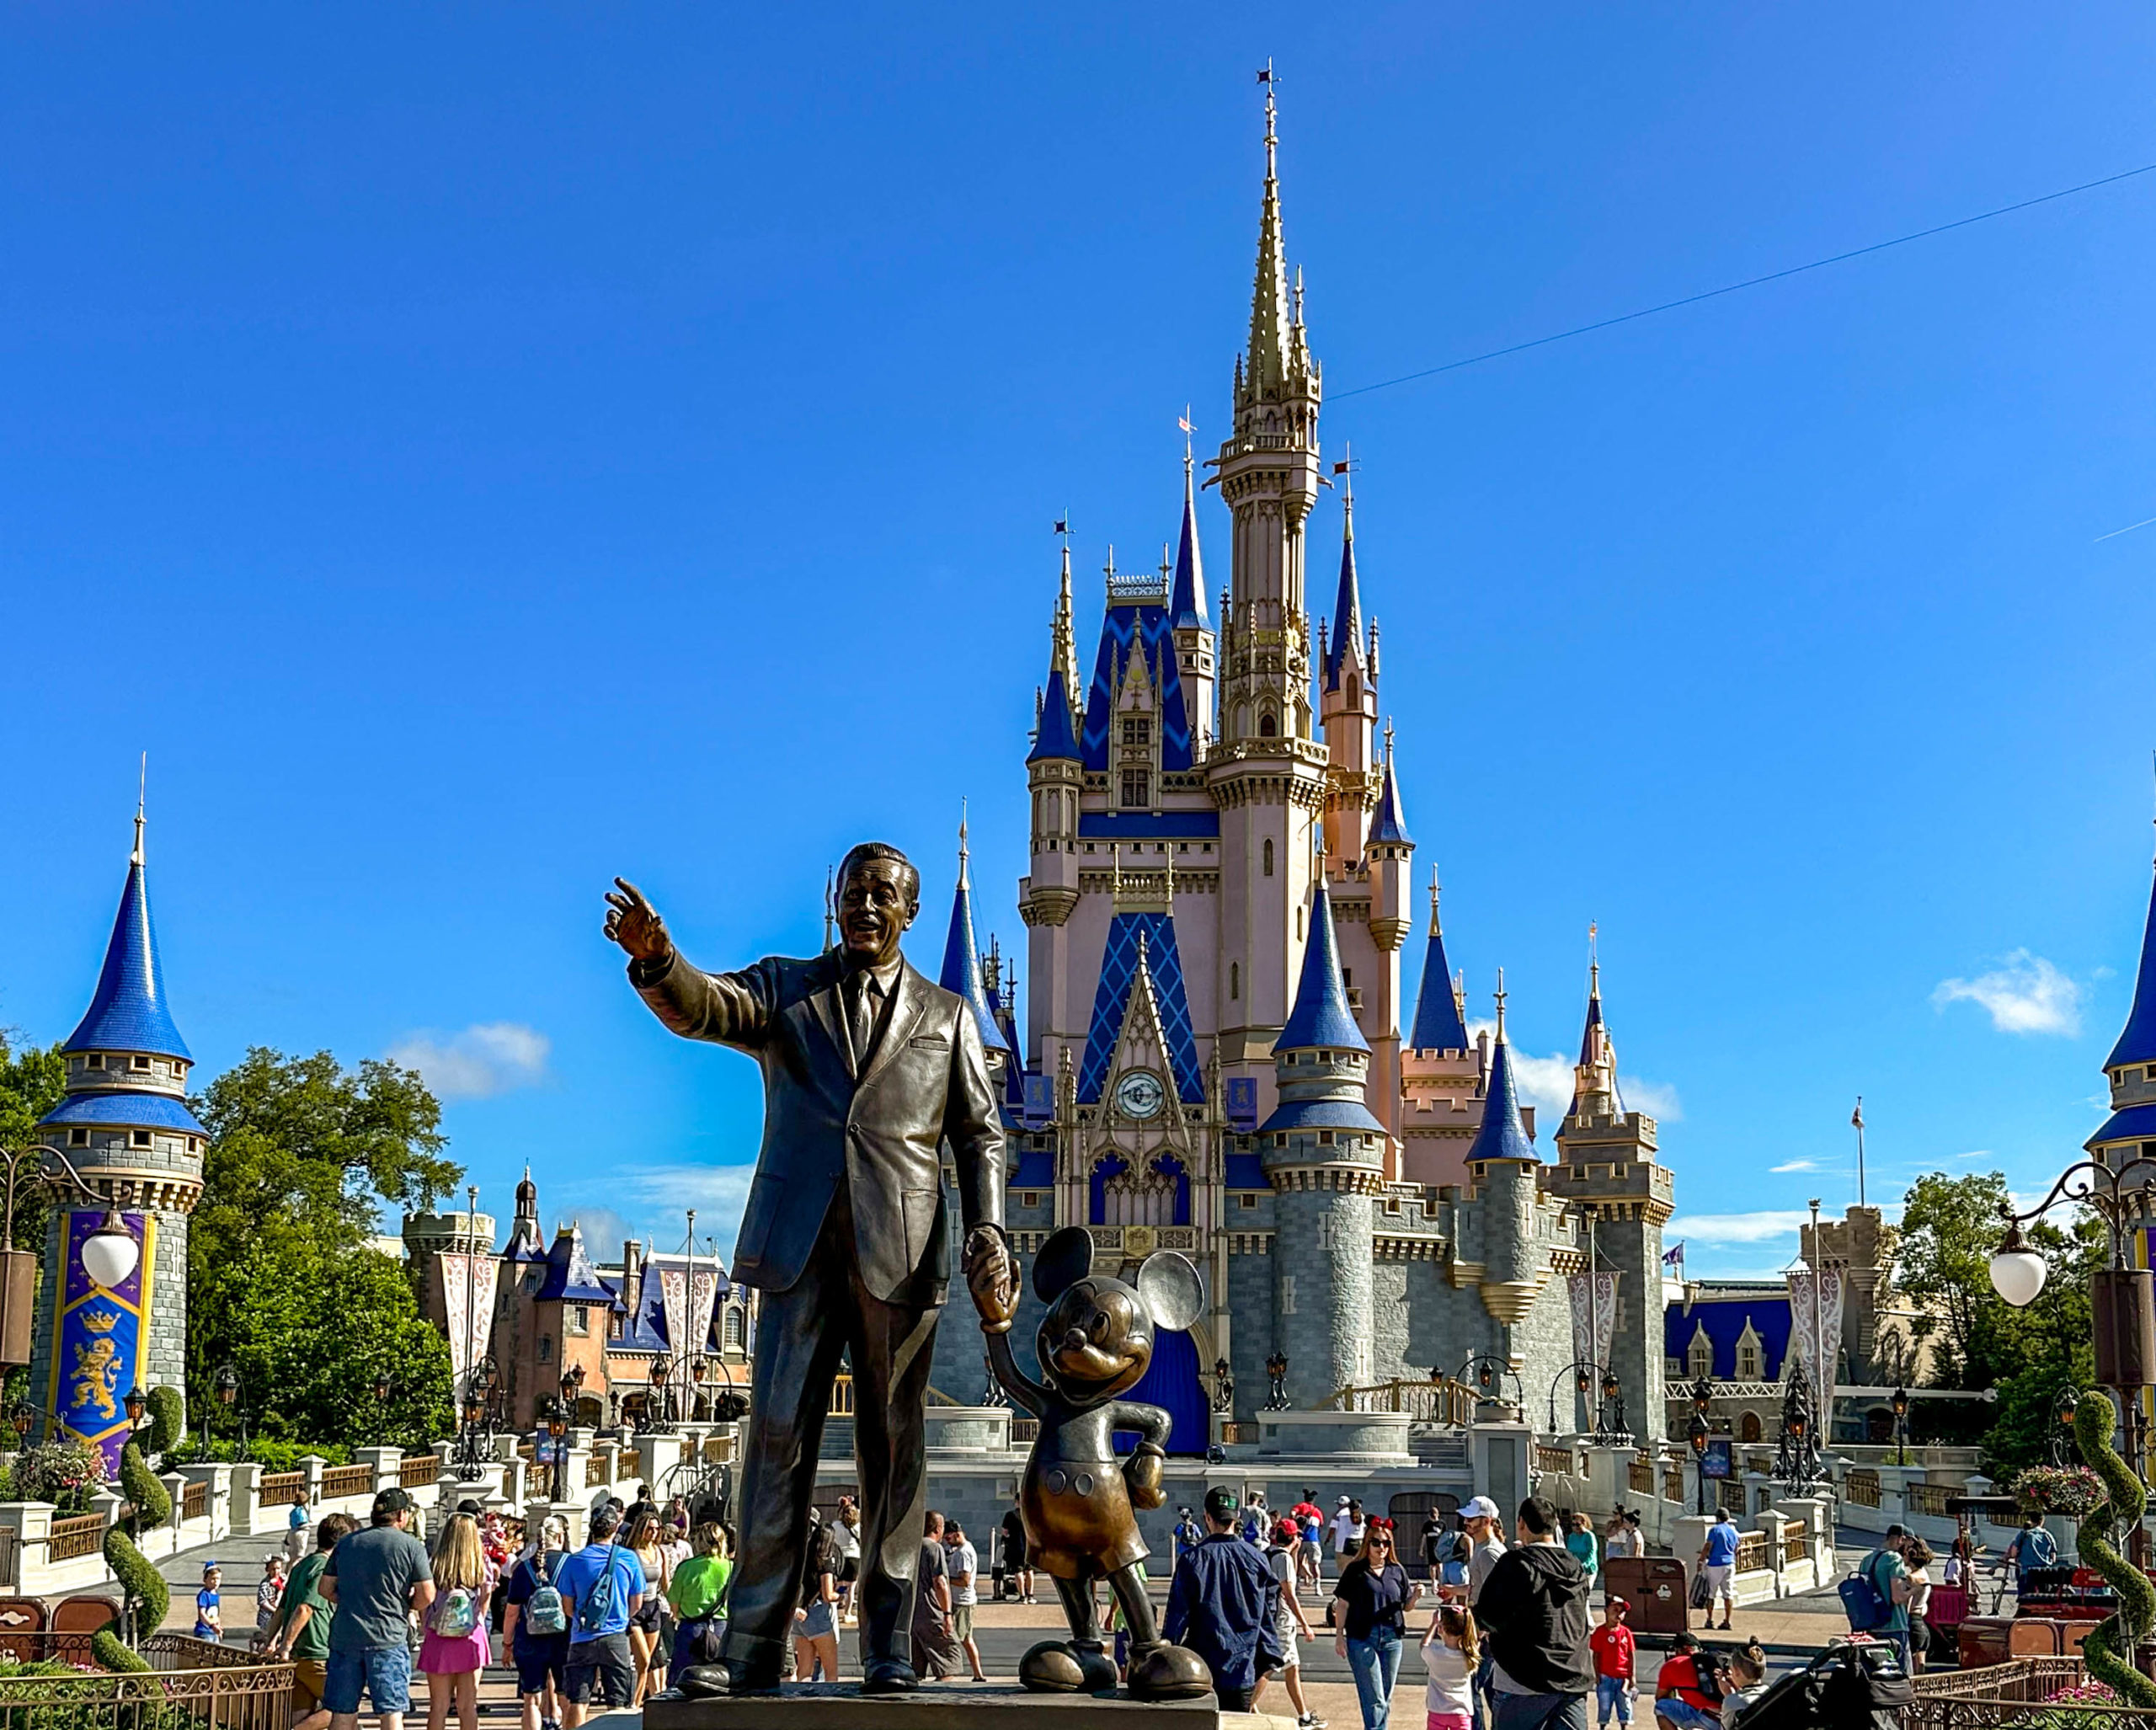

Disney World
However, I must add a mea culpa here as well. When I researched 2024 Spring Breaks, I apparently got it wrong.
My understanding was that most schools in North America would offer Spring Break in March.
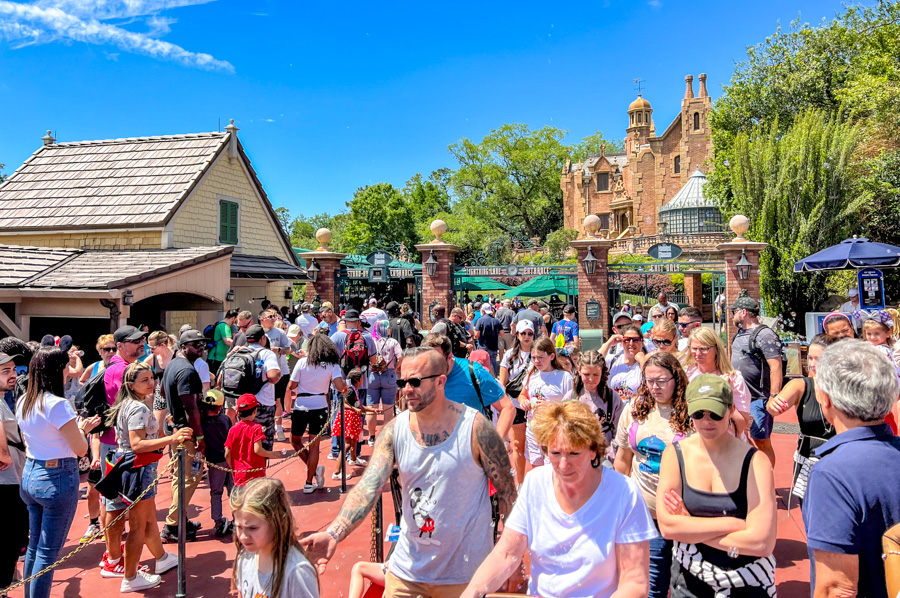

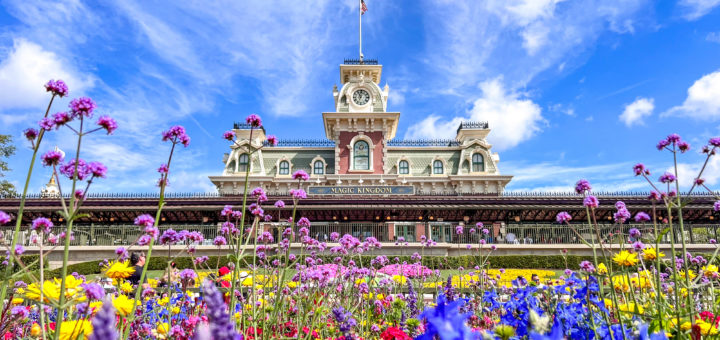
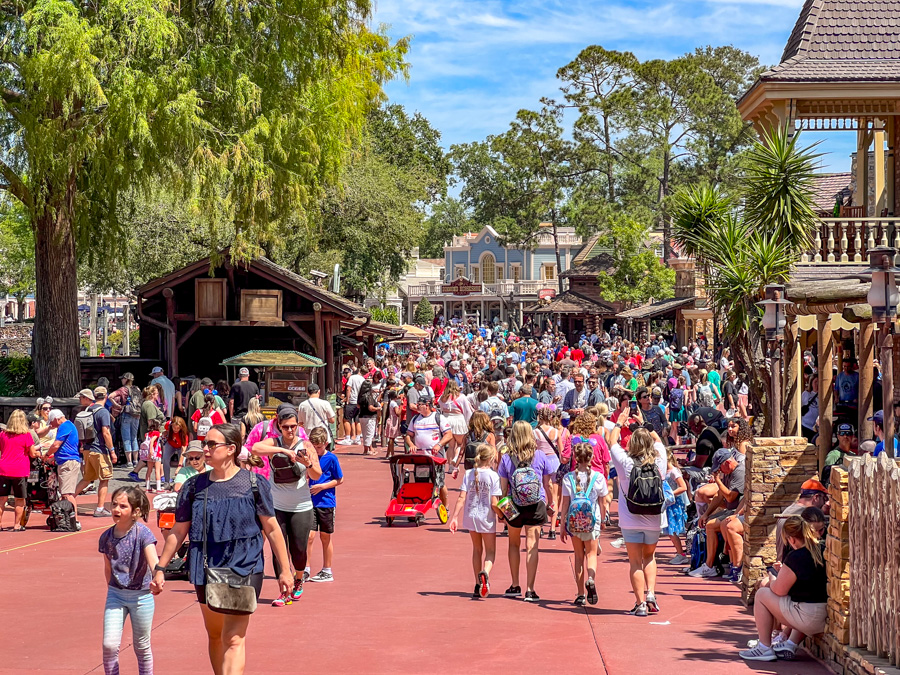
Magic Kingdom Spring Break crowds
Several MickeyTravels agents passed along their expertise, indicating that the post-Easter Week was Spring Break for many.
Not coincidentally, Walt Disney World wait times in early April were…well, you’ll see. And your eyes will pop.
Disney’s Animal Kingdom


Tree of Life
Let’s just get straight to the data so that you can understand the situation.
Here are Animal Kingdom’s average wait times last week:
- Avatar Flight of Passage – 122 minutes, down 3
- Na’vi River Journey – 79 minutes, down 3
- Adventurers Outpost – 58 minutes, up 2
- Expedition Everest – 56 minutes, down 5
- Kali River Rapids – 55 minutes, down 4
- Kilimanjaro Safaris – 54 minutes, down 7
- DINOSAUR – 36 minutes, down 3
- TriceraTop Spin – 19 minutes, up 2
- It’s Tough to Be a Bug! – 15 minutes, no change
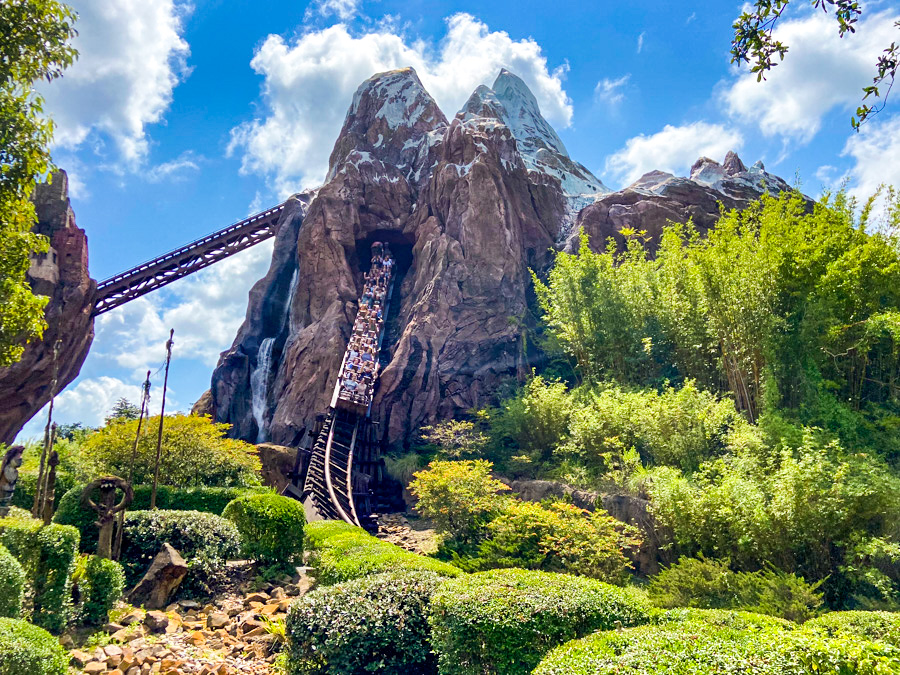

Expedition Everest
Overall, guests stood in line for 55 minutes per attraction.
On the one hand, that’s two minutes less than last time.
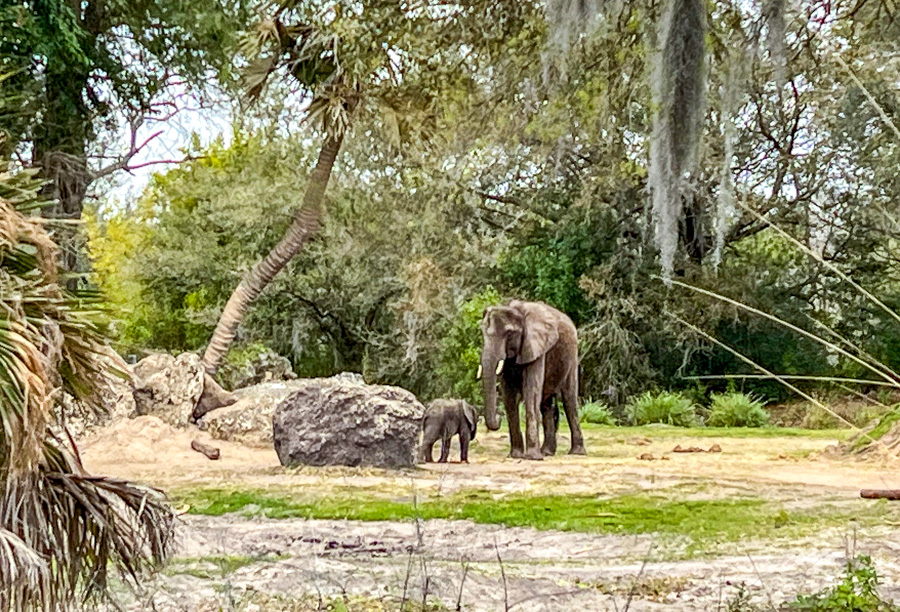

Kilimanjaro Safaris
From the meta-perspective, it’s super-rare to wait for 55 minutes per attraction at Animal Kingdom.
Off my head, I’m doubtful that happened ten times over the past calendar year.
End of Line sign
What I would have expected is for crowds to diminish soon after Easter ended.
That’s true to an extent. Here’s Kristin Sabol discussing the crowds on Sunday, April 7th.
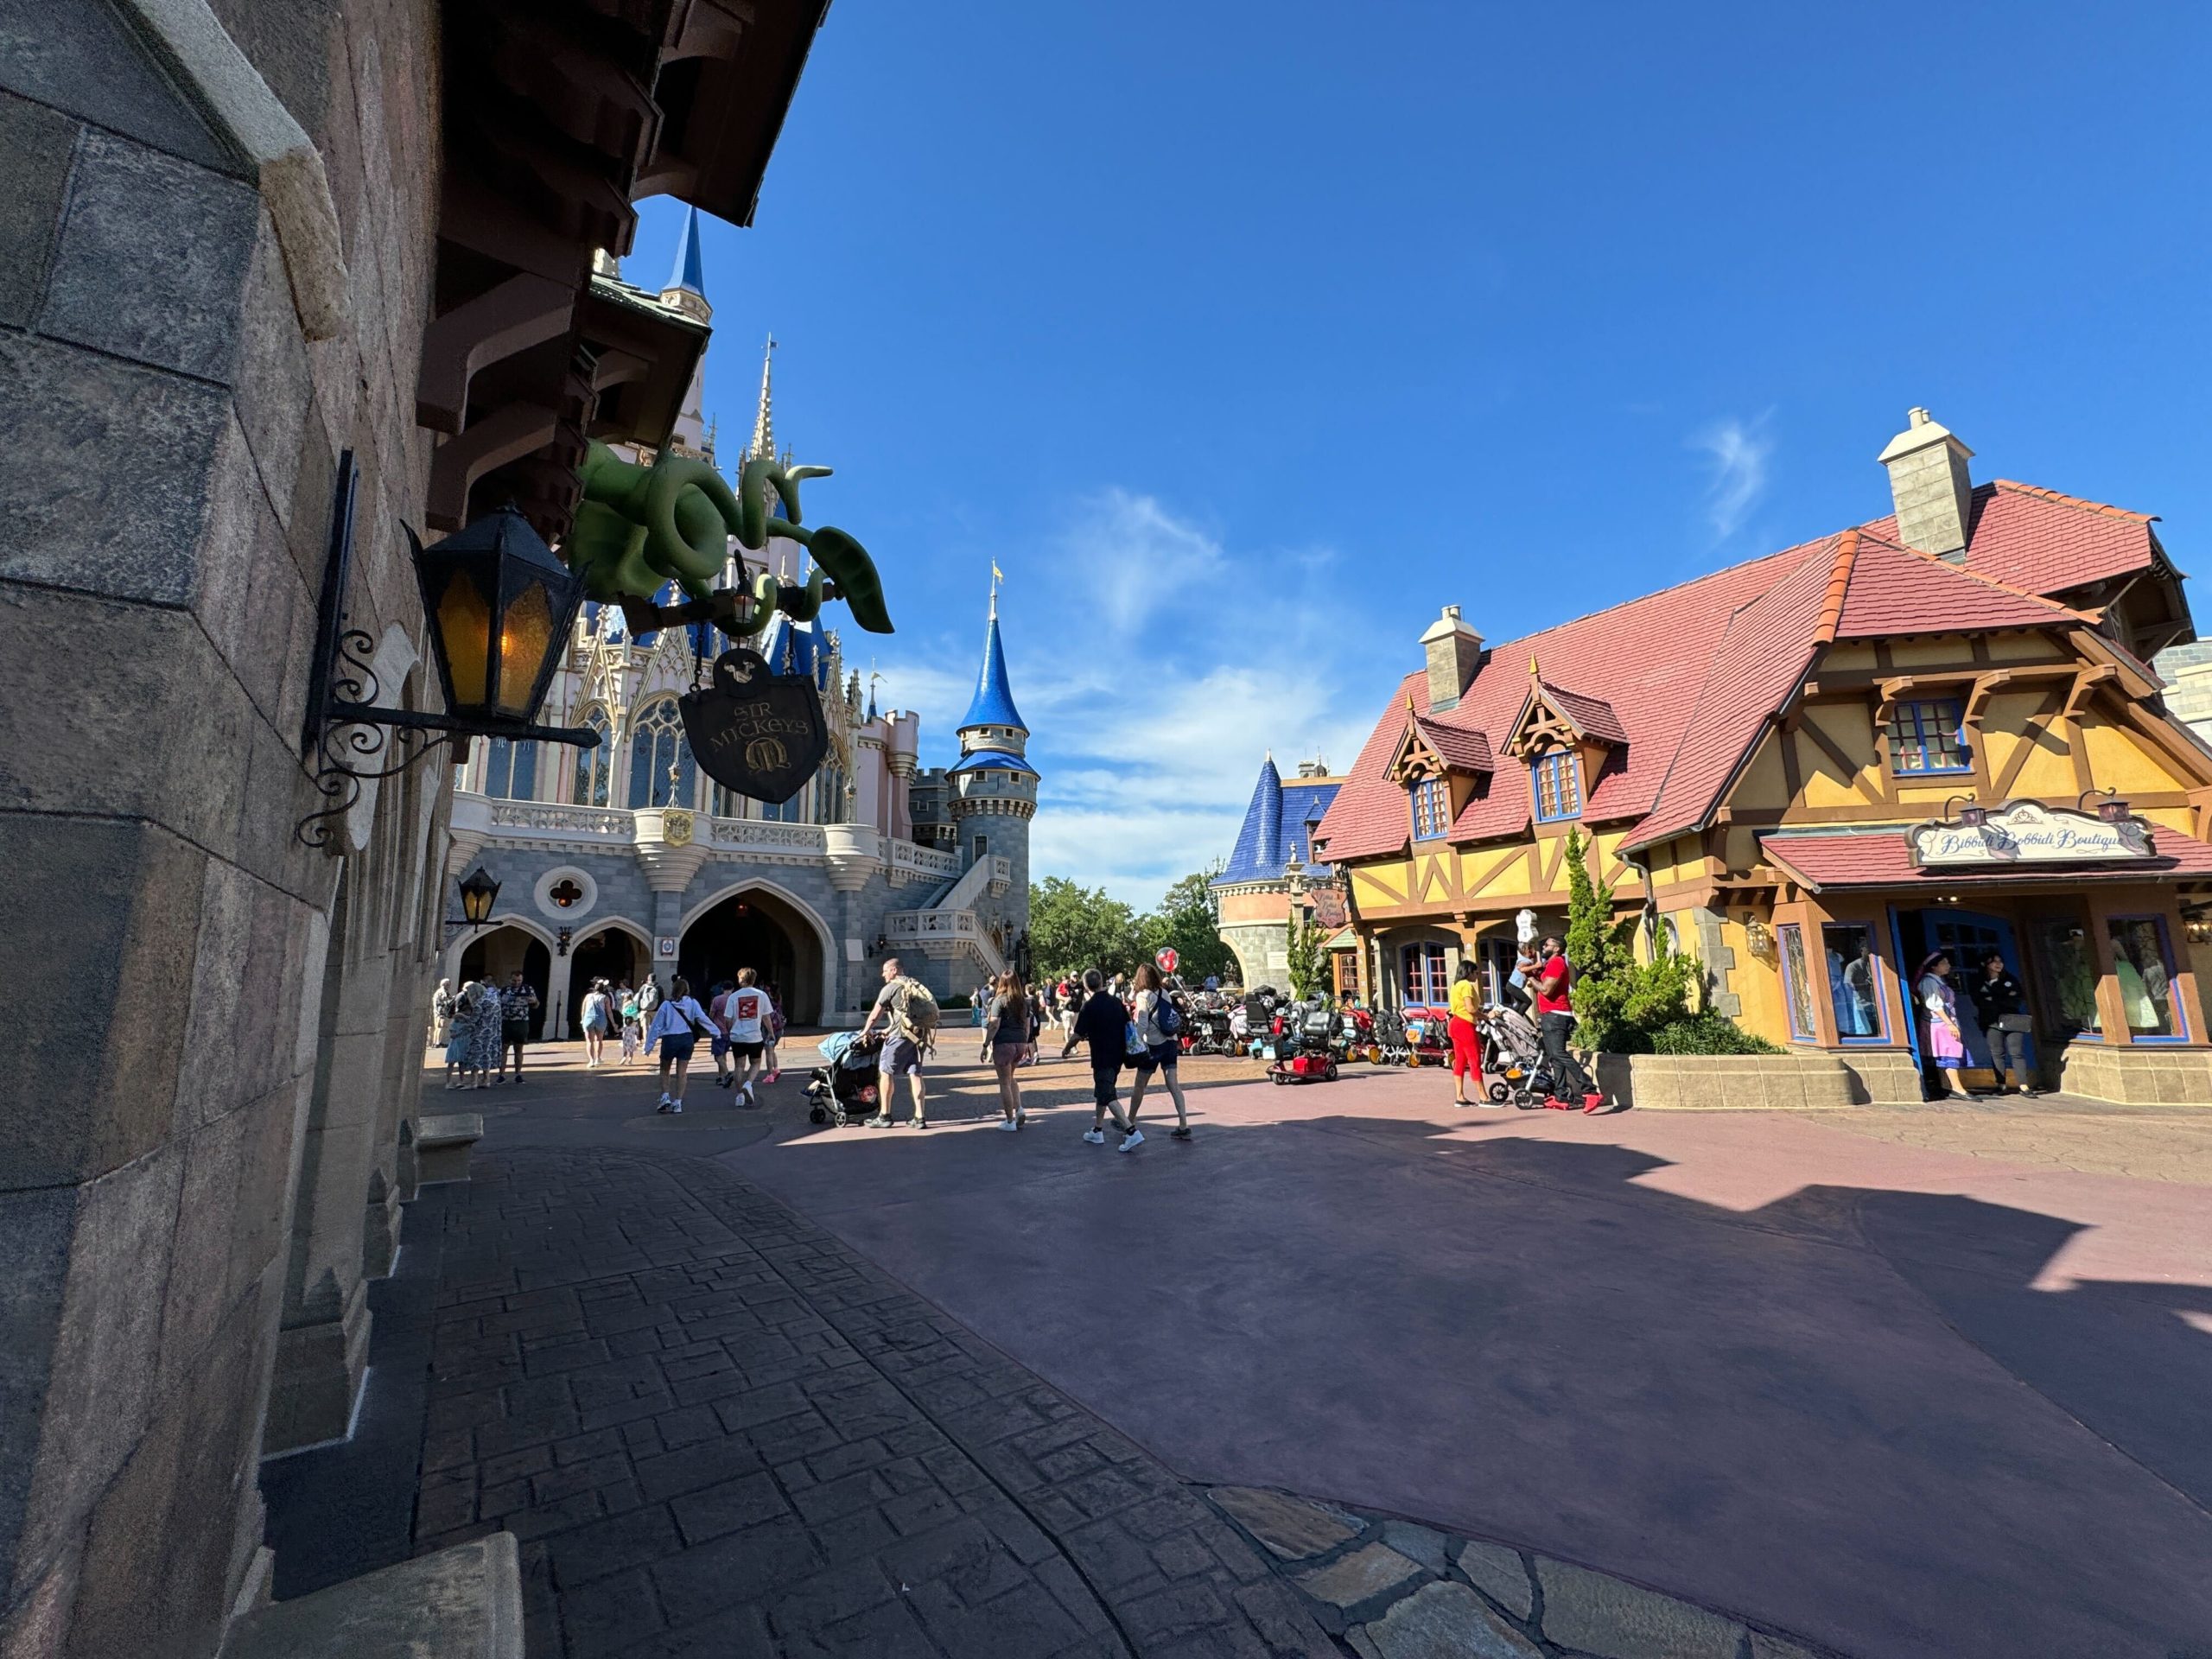

Low crowds on April 7th
You can tell from those pictures that a change occurred.
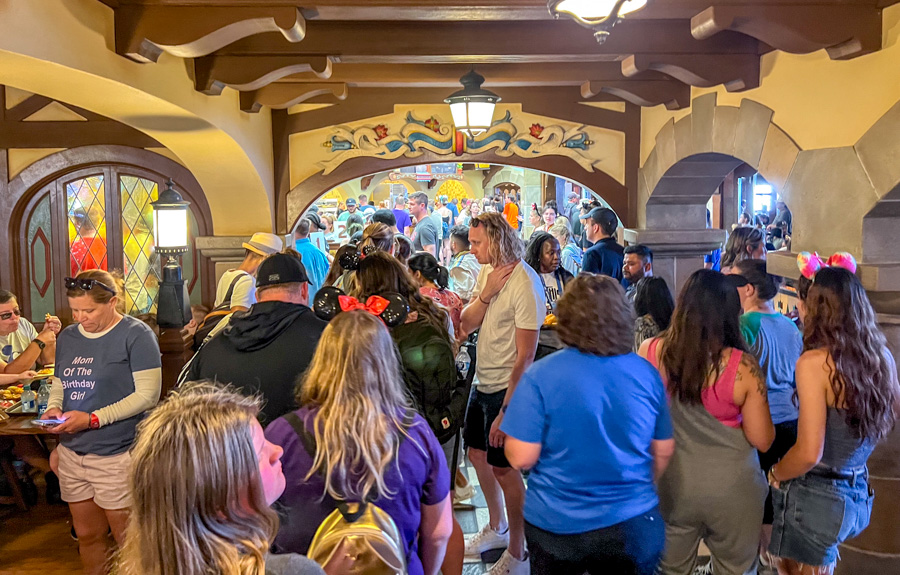
Now, contrast that to these pictures Madison Owens described last Thursday.
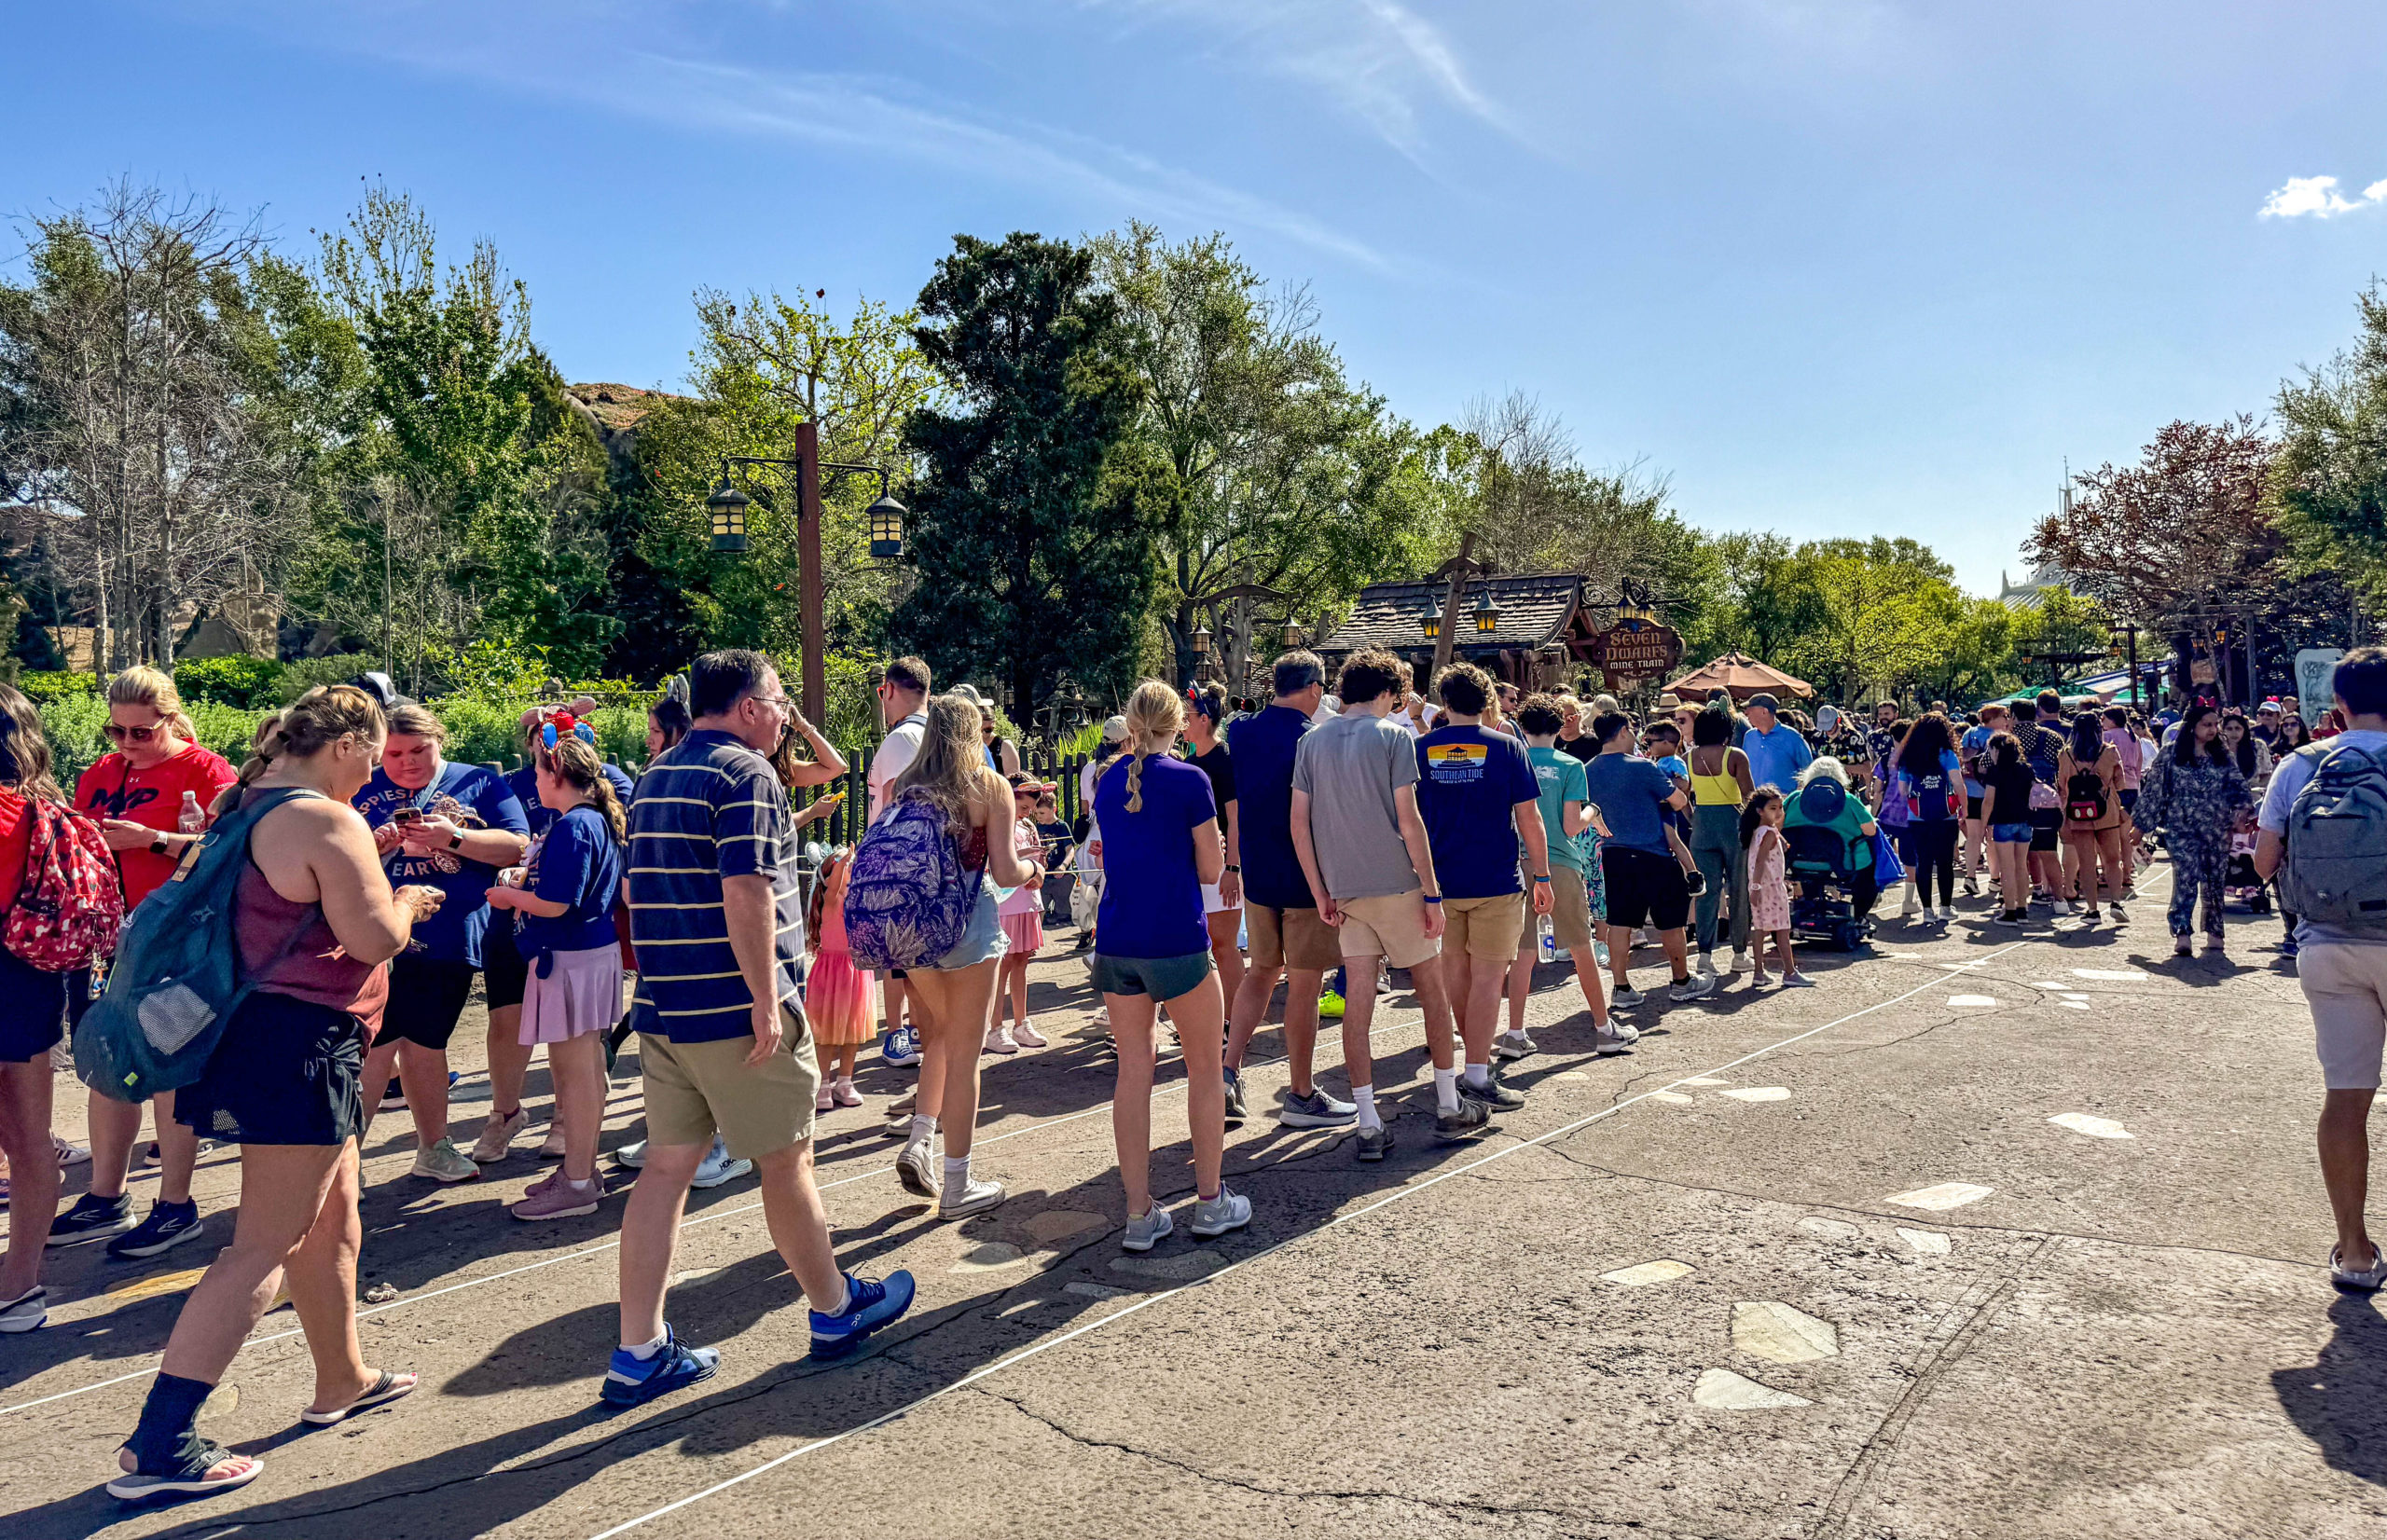

Lines
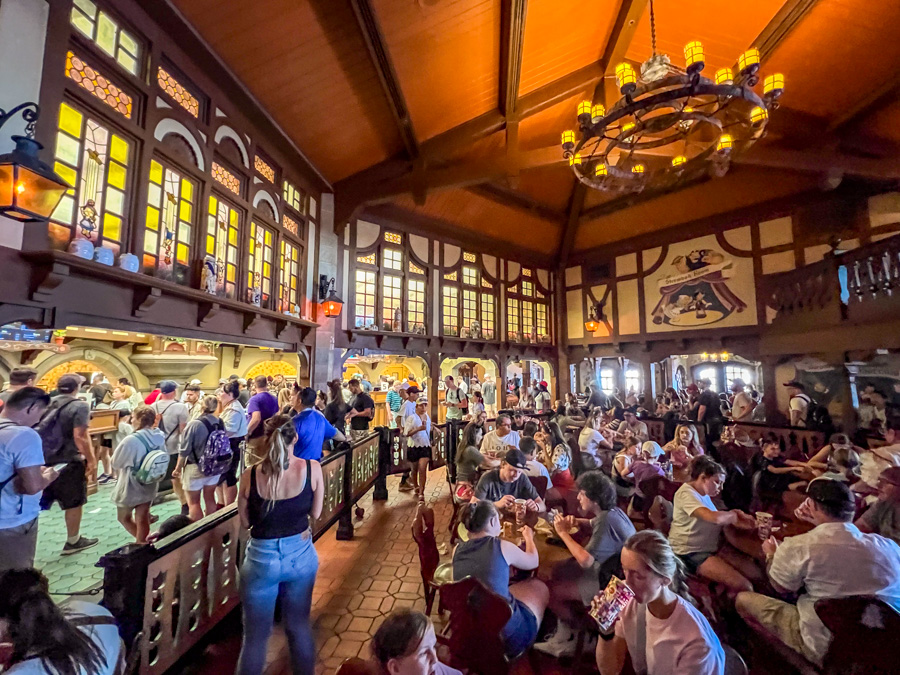
People were eating on the floor of Cosmic Ray’s Starlight Café because there were no chairs available!
Our data covers the timeframe from Monday the 1st through Sunday the 7th.
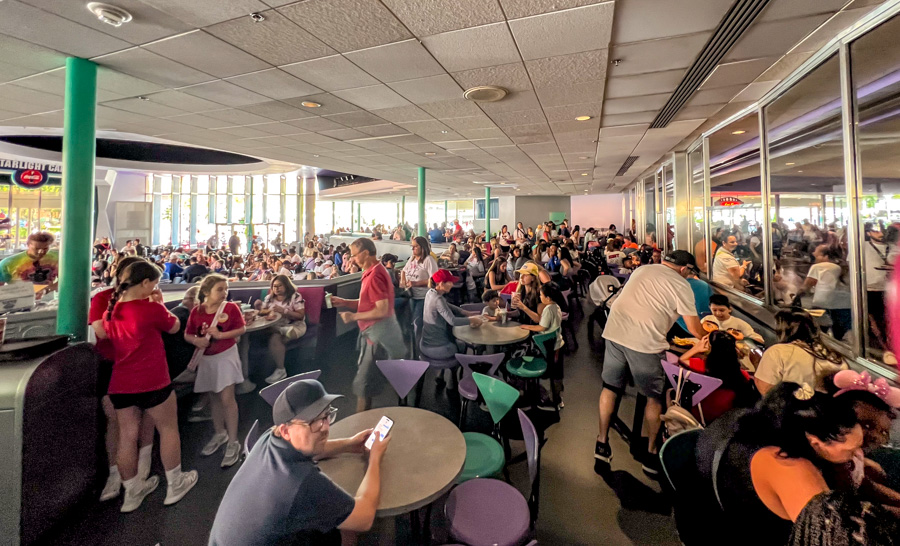

Cosmic Ray’s Spring Break crowds
On the 6th and 7th, the wait times fell substantially, which is highly unusual for a weekend.
If not for those two dates, the average wait times would be waaaaay up!
Disney’s Hollywood Studios


Disney’s Hollywood Studios
So, keeping these trends in mind, here are the average waits at Hollywood Studios last week:
- Slinky Dog Dash – 138 minutes, up 1
- Star Wars: Rise of the Resistance – 127 minutes, down 7
- Millennium Falcon: Smugglers Run – 115 minutes, down 1
- Twilight Zone Tower of Terror – 85 minutes, down 2
- Mickey & Minnie’s Runaway Railway – 81 minutes, up 3
- Toy Story Mania! – 68 minutes, down 5
- Alien Swirling Saucers – 51 minutes, down 2
- Red Carpet Dreams – 48 minutes, up 3
- Star Tours – The Adventures Continue! – 44 minutes, up 6
- Celebrity Spotlight – 29 minutes, up 2
- Lightning McQueen’s Racing Academy – 15 minutes, down 4
- Muppet*Vision 3D – 10 minutes, down 5
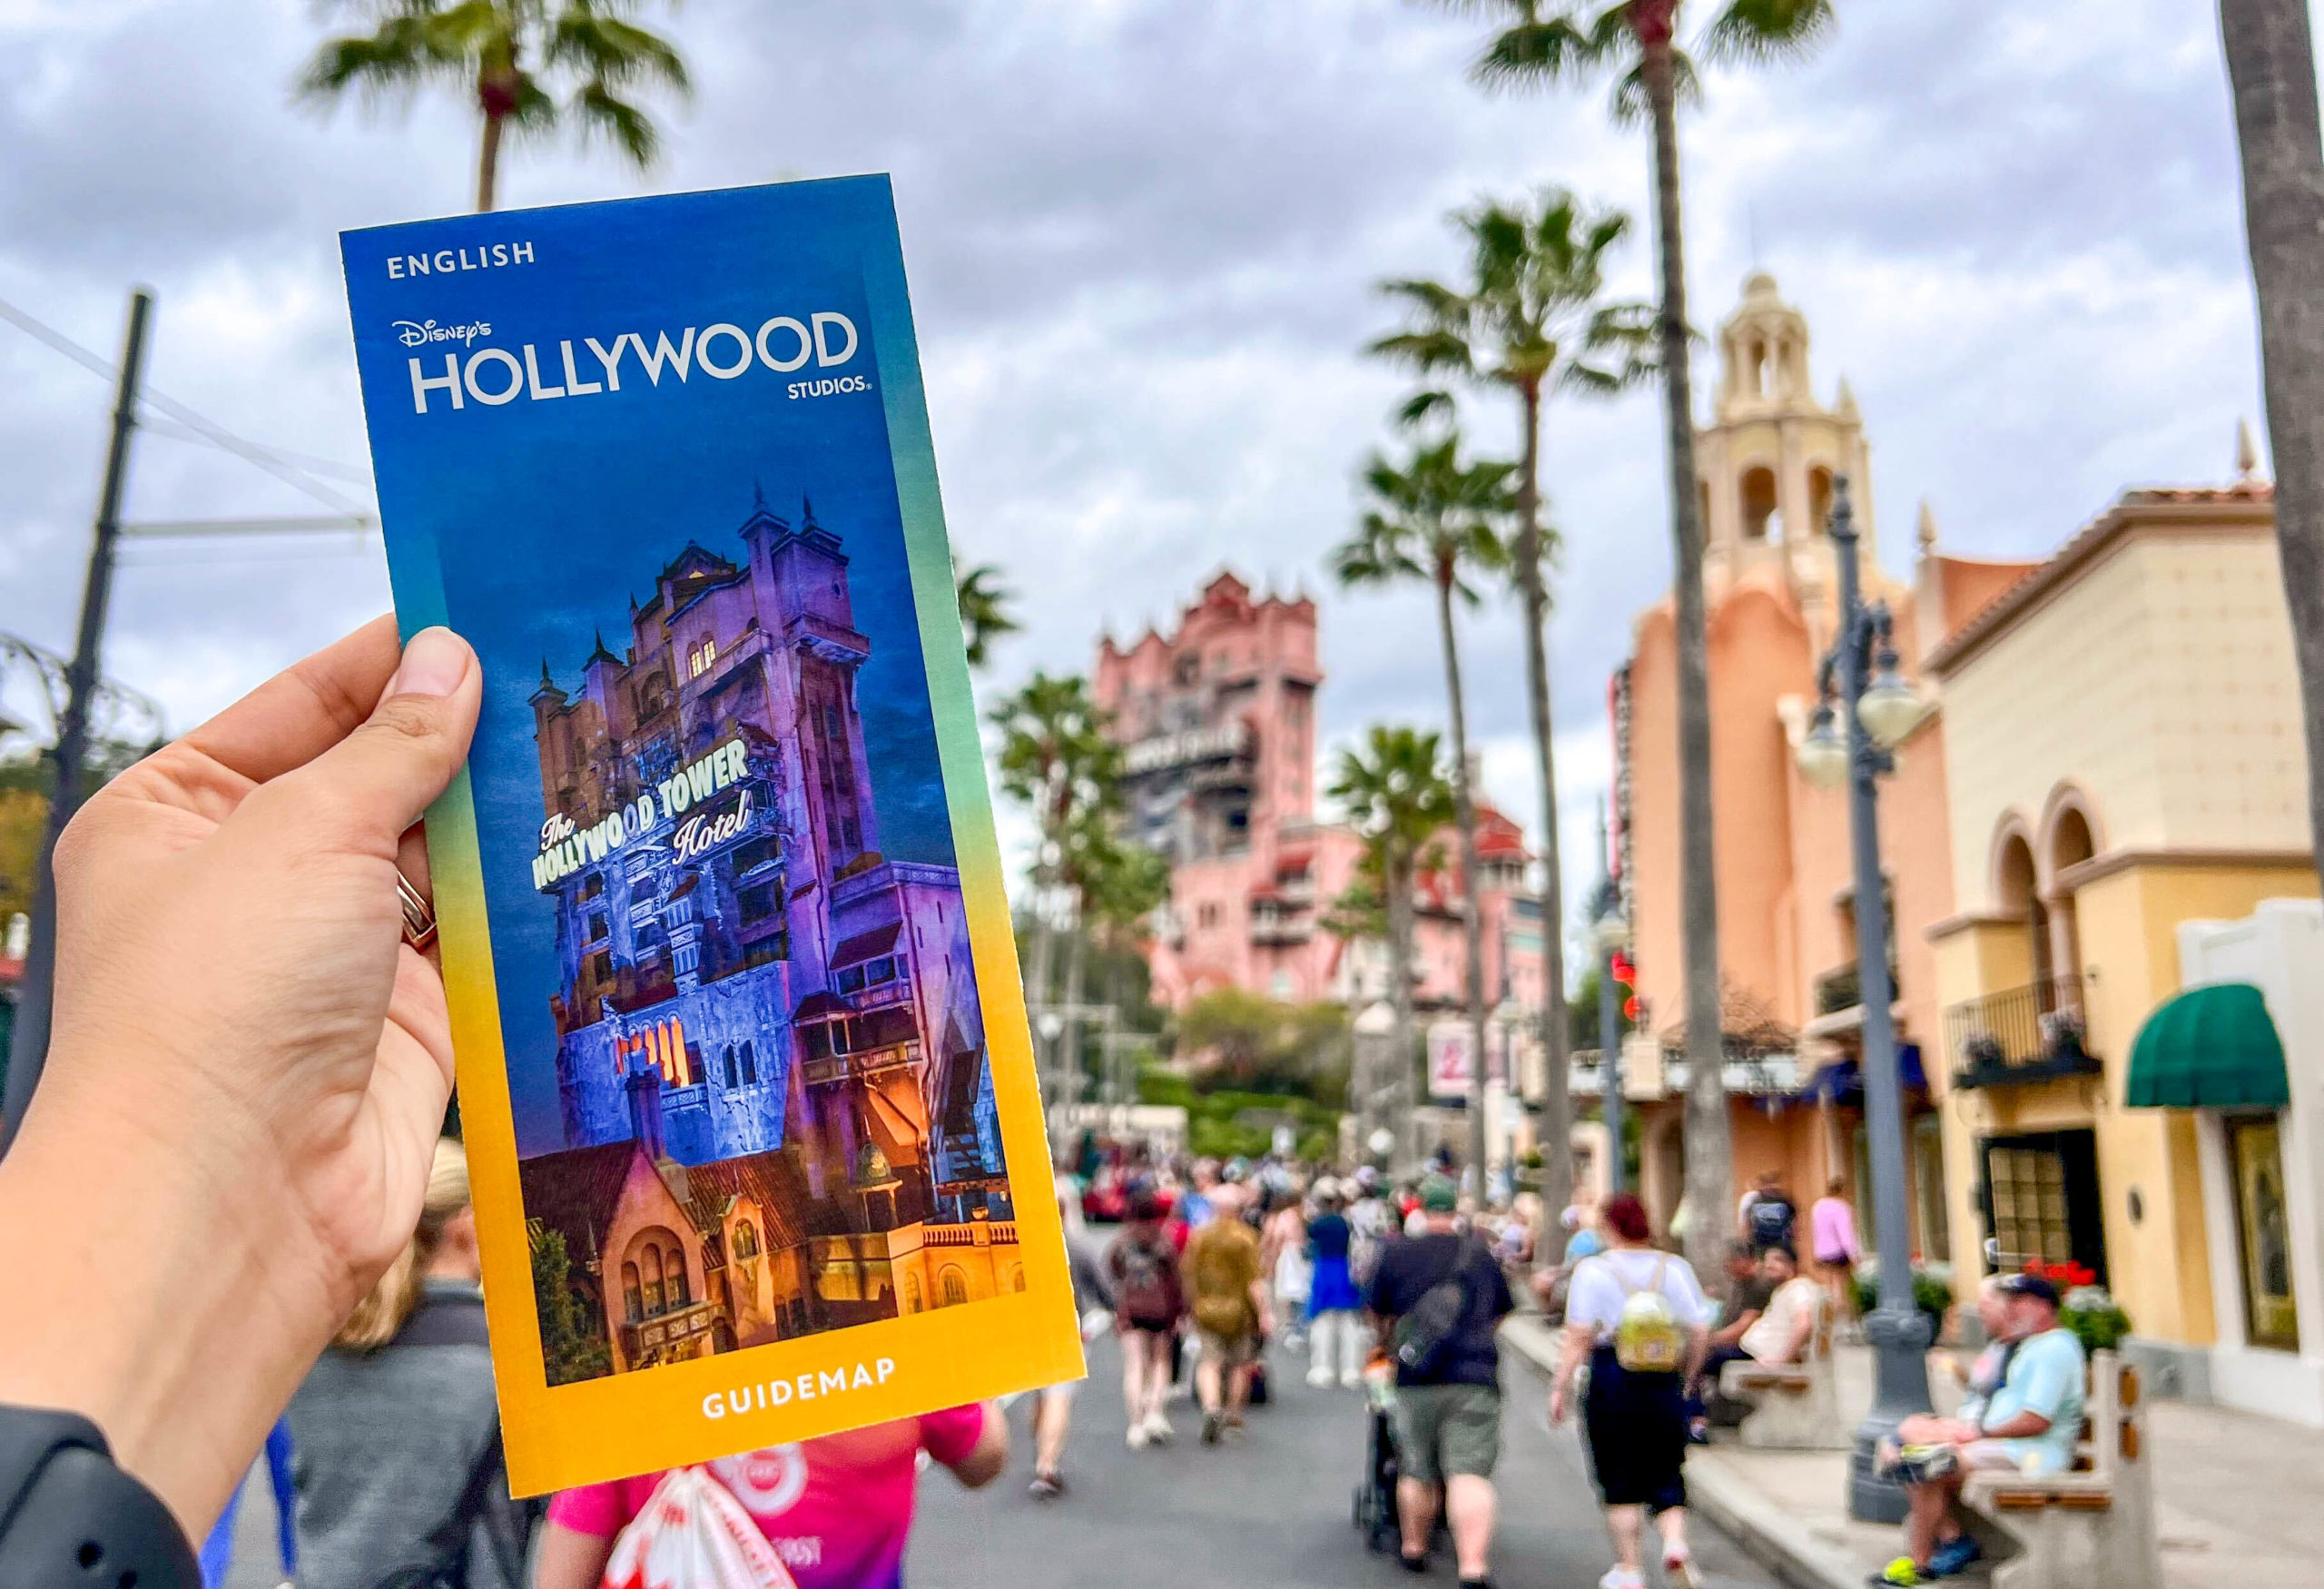

Hollywood Studios
Overall, park guests waited an average of 57 minutes, two minutes less than last time.
The 57-minute wait isn’t as dramatic as Animal Kingdom since Hollywood Studios is the more popular park.
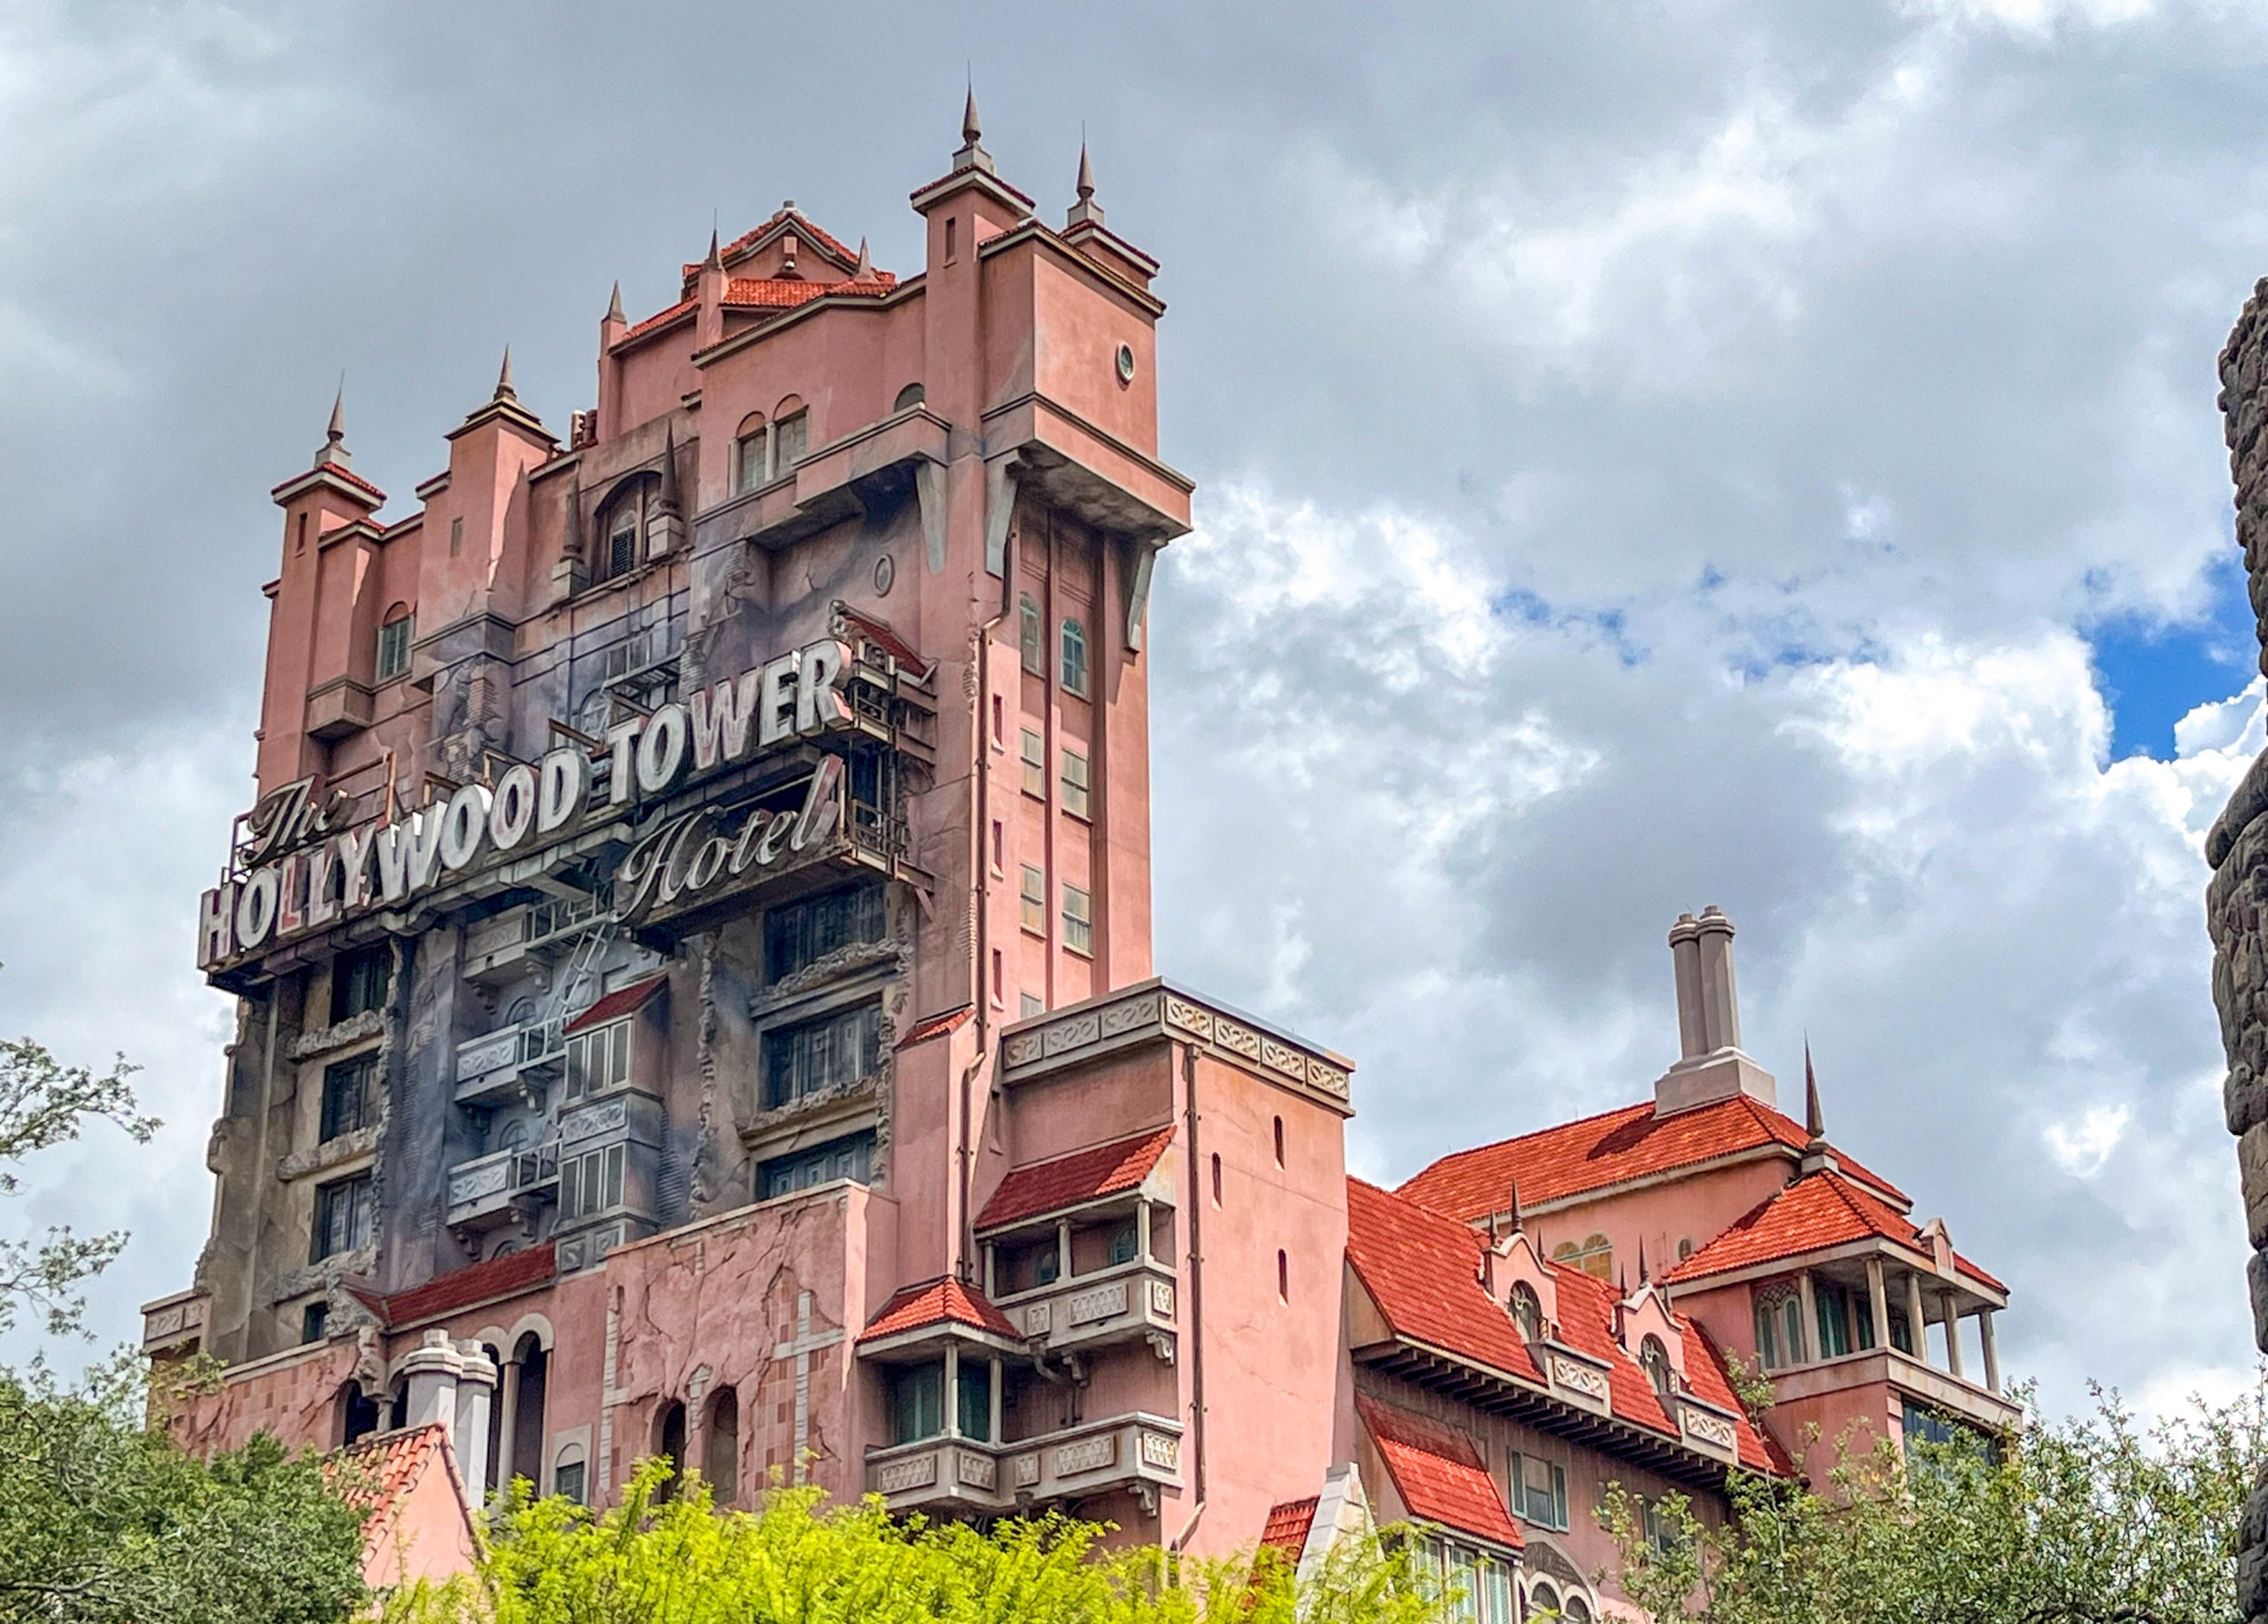

Tower of Terror
Still, that total is on the higher end of park behavior.
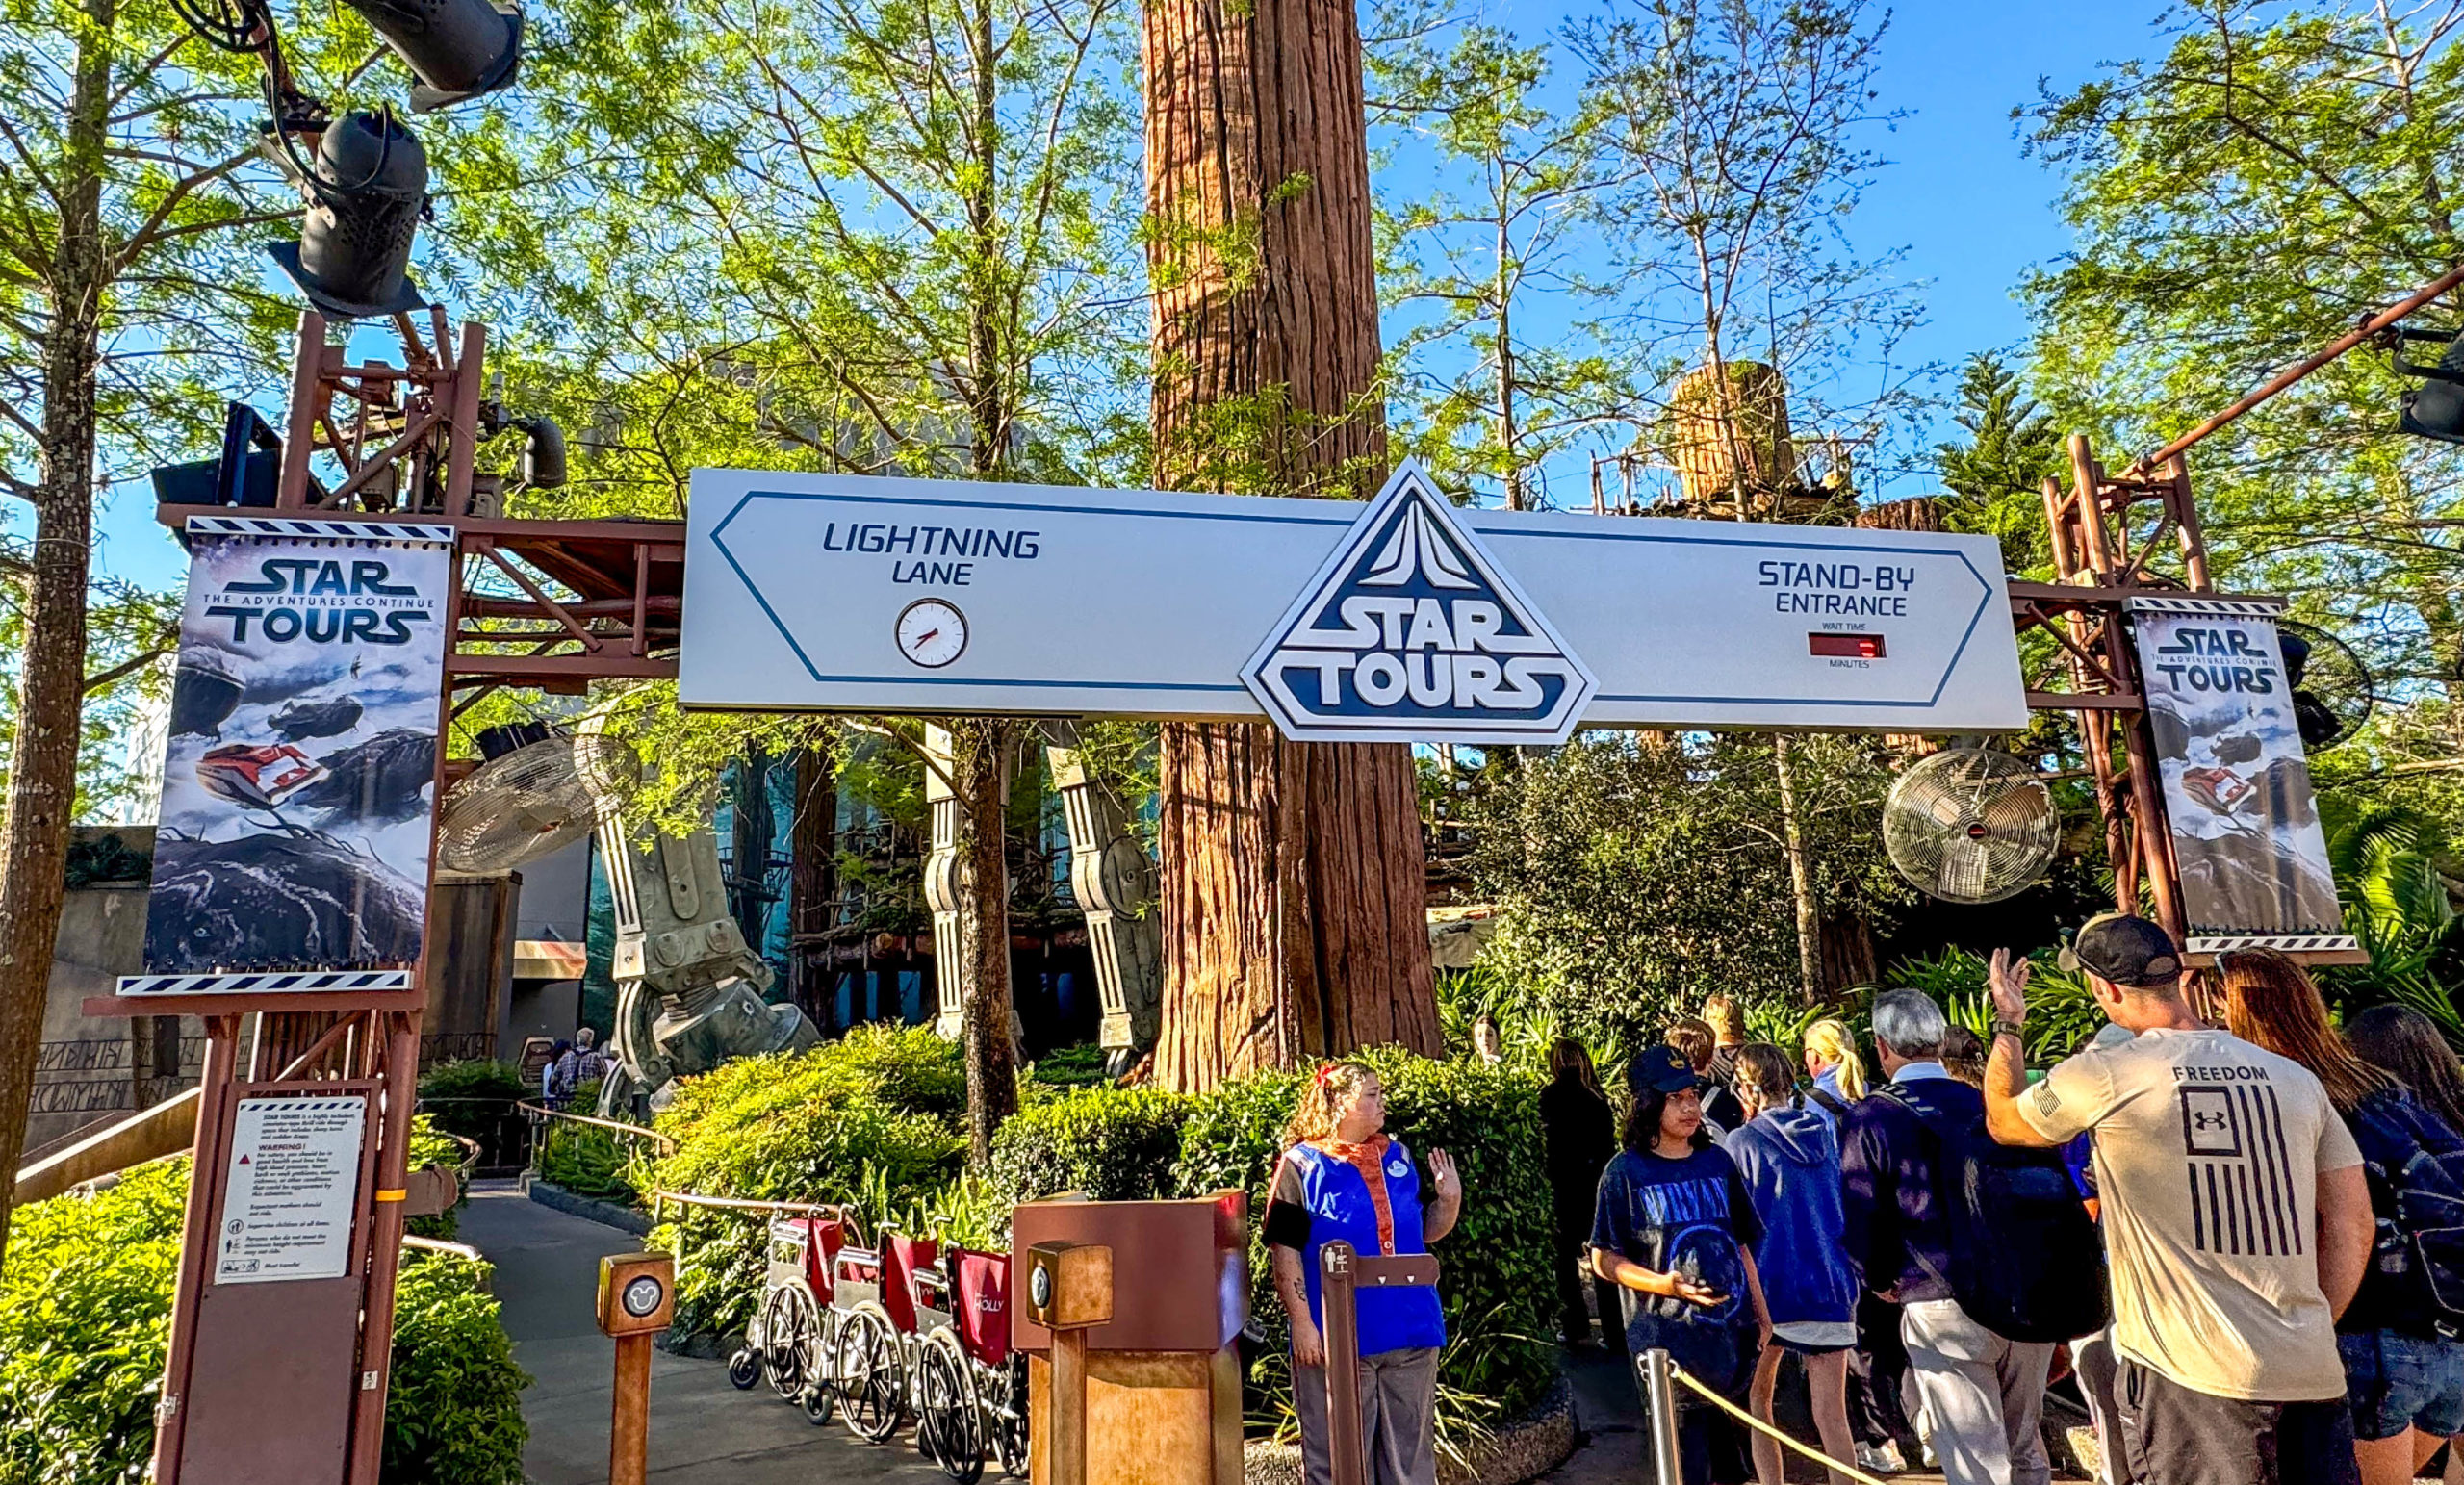
There was one impactful aspect I should mention, which is the new scenes at Star Tours.

Star Tours
While the updates affected less than half the data for this week, they’ll matter for a while.
You should expect to wait a few minutes longer at Star Tours throughout the summer as fans cycle through the new scenes.
EPCOT

Long Lines at Spaceship Earth in EPCOT
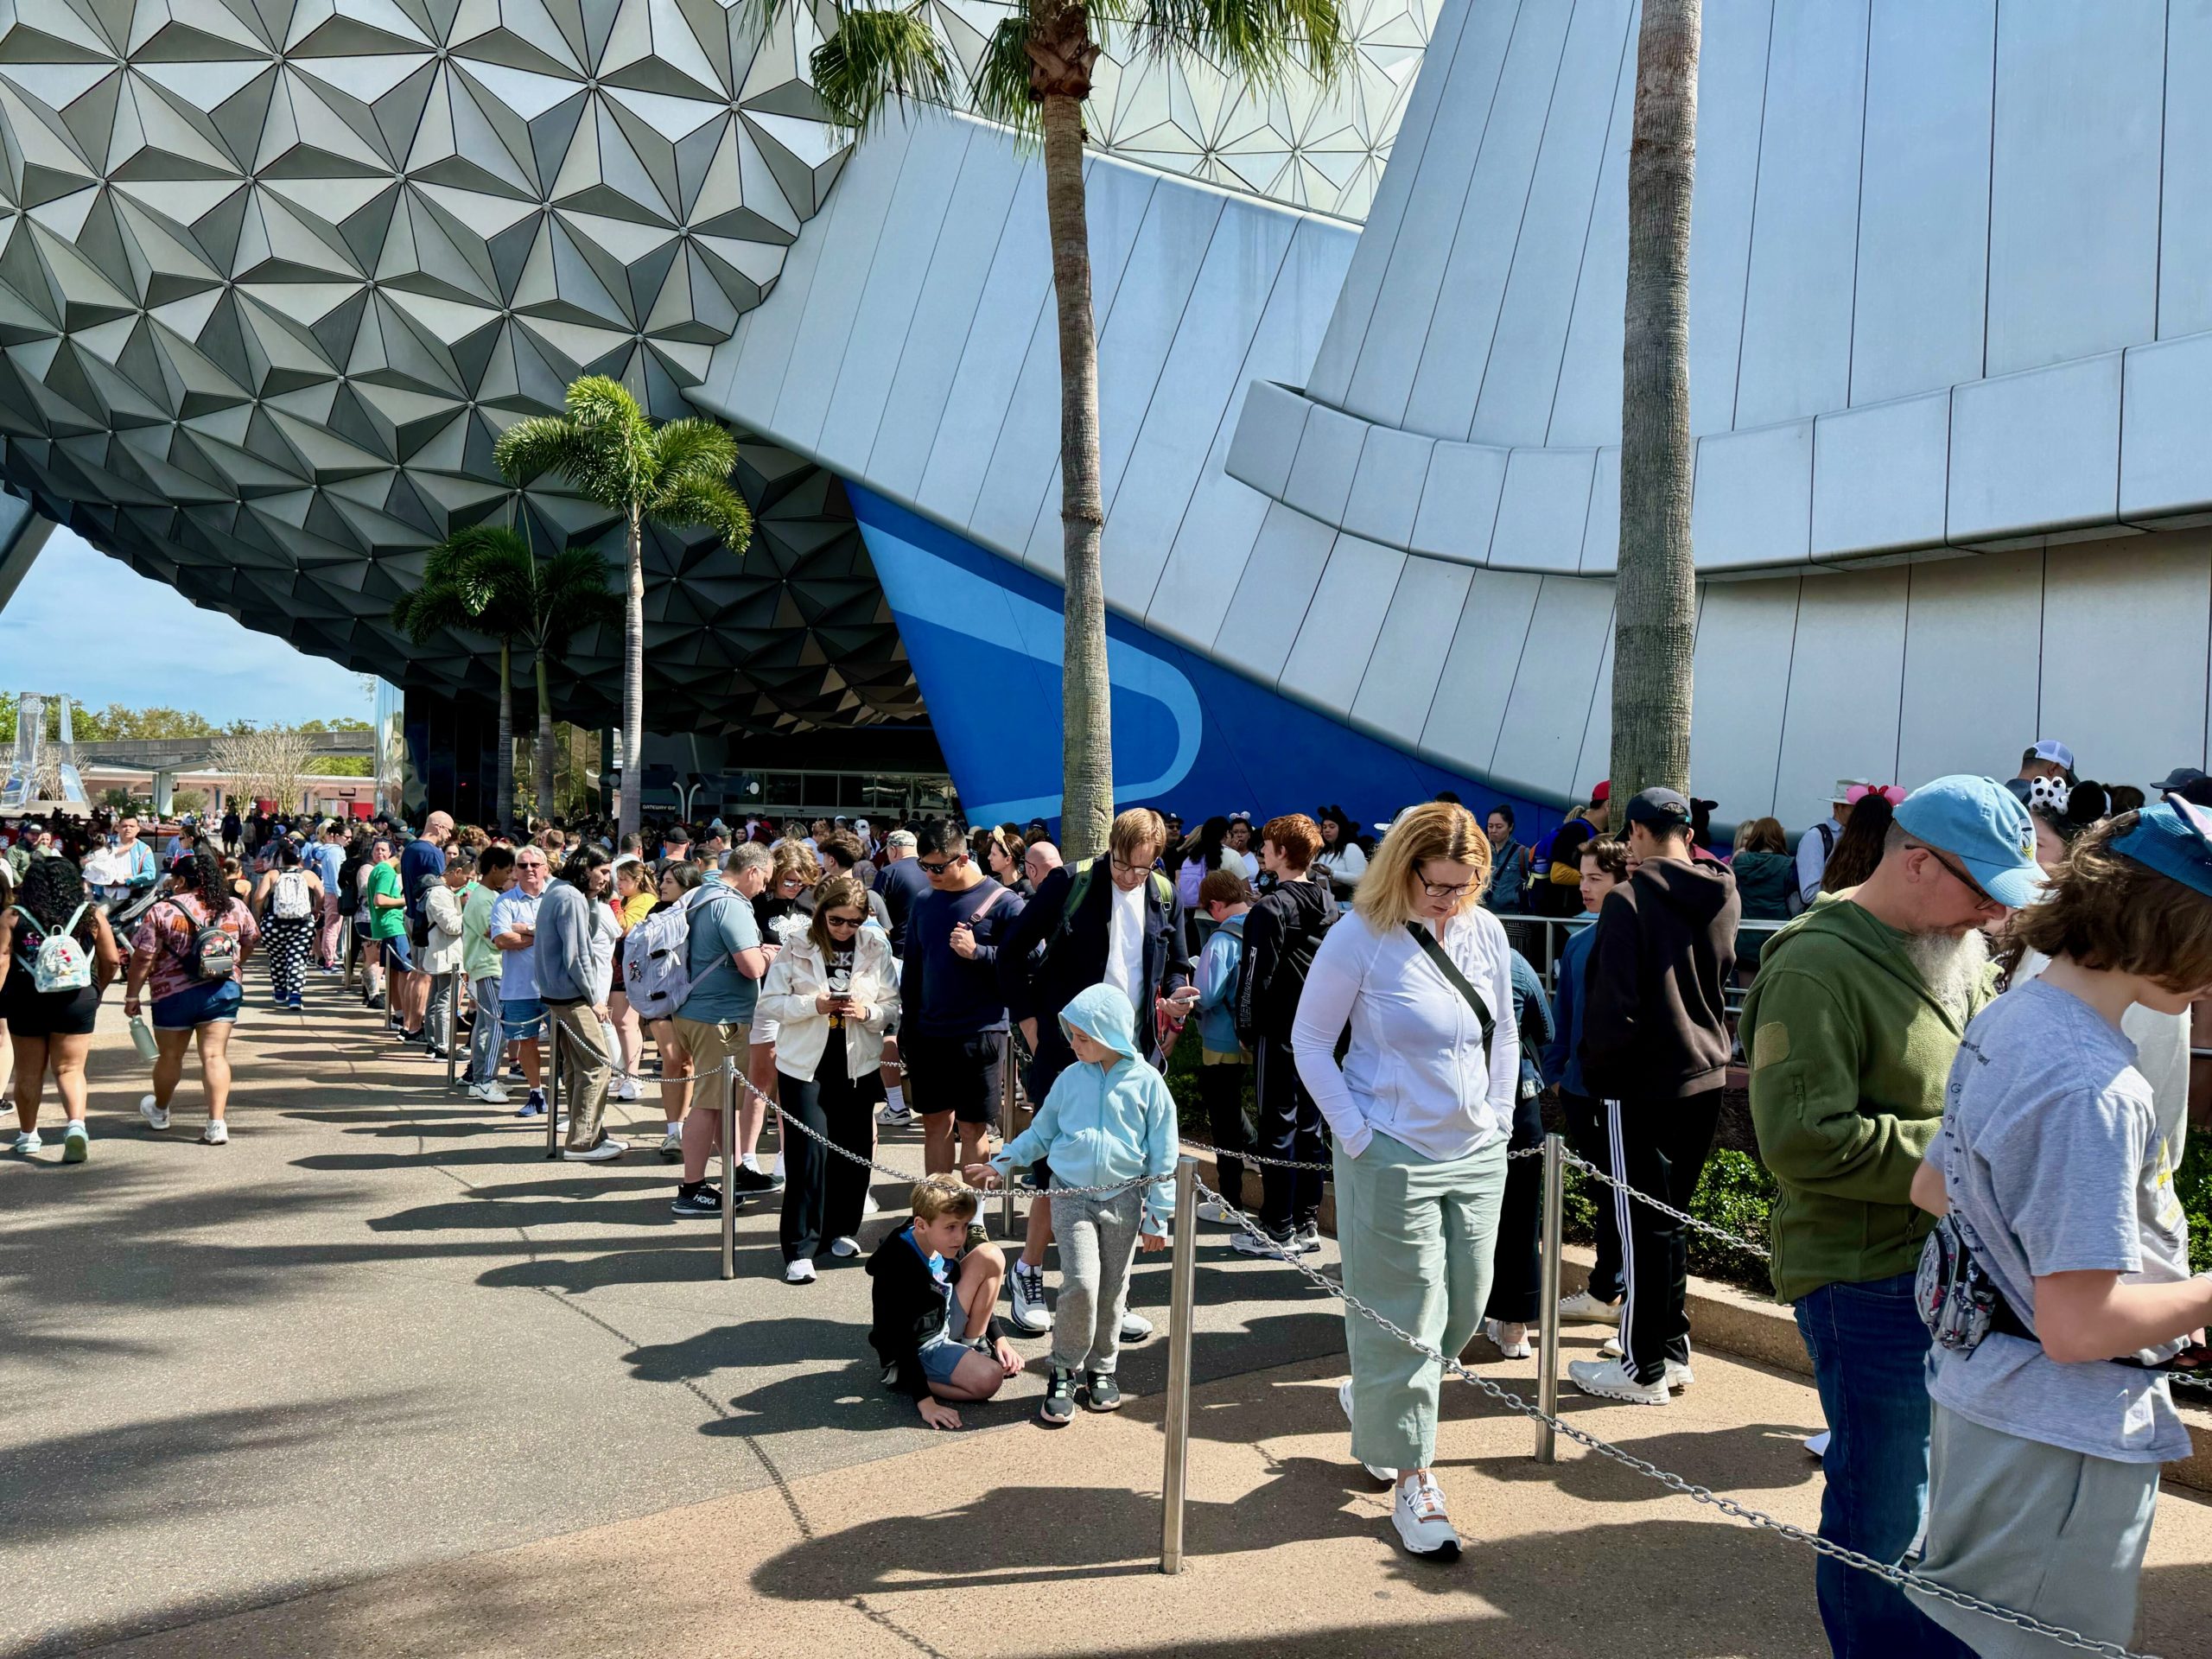
Given the oddities of this past week, the data remains a bit curious.
Here are EPCOT’s average wait times for comparison:
- Remy’s Ratatouille Adventure – 110 minutes, up 5
- Frozen Ever After – 101 minutes, down 1
- Test Track – 90 minutes, down 5
- Mission: SPACE – 78 minutes, down 1
- Soarin’ Around the World – 68 minutes, up 4
- Royal Sommerhus – 44 minutes, up 3
- Spaceship Earth – 33 minutes, up 1
- The Seas with Nemo & Friends – 26 minutes, up 3
- Journey into Imagination with Figment – 24 minutes, up 3
- Turtle Talk with Crush – 22 minutes, up 2
- Gran Fiesta Tour Starring the Three Caballeros – 18 minutes, up 2
- Living with the Land – 16 minutes, up 1
Overall, guests stood in line for an average of 52 minutes per attraction, two minutes more than last time.
I want to bring your attention to something in case you missed it.


The Land
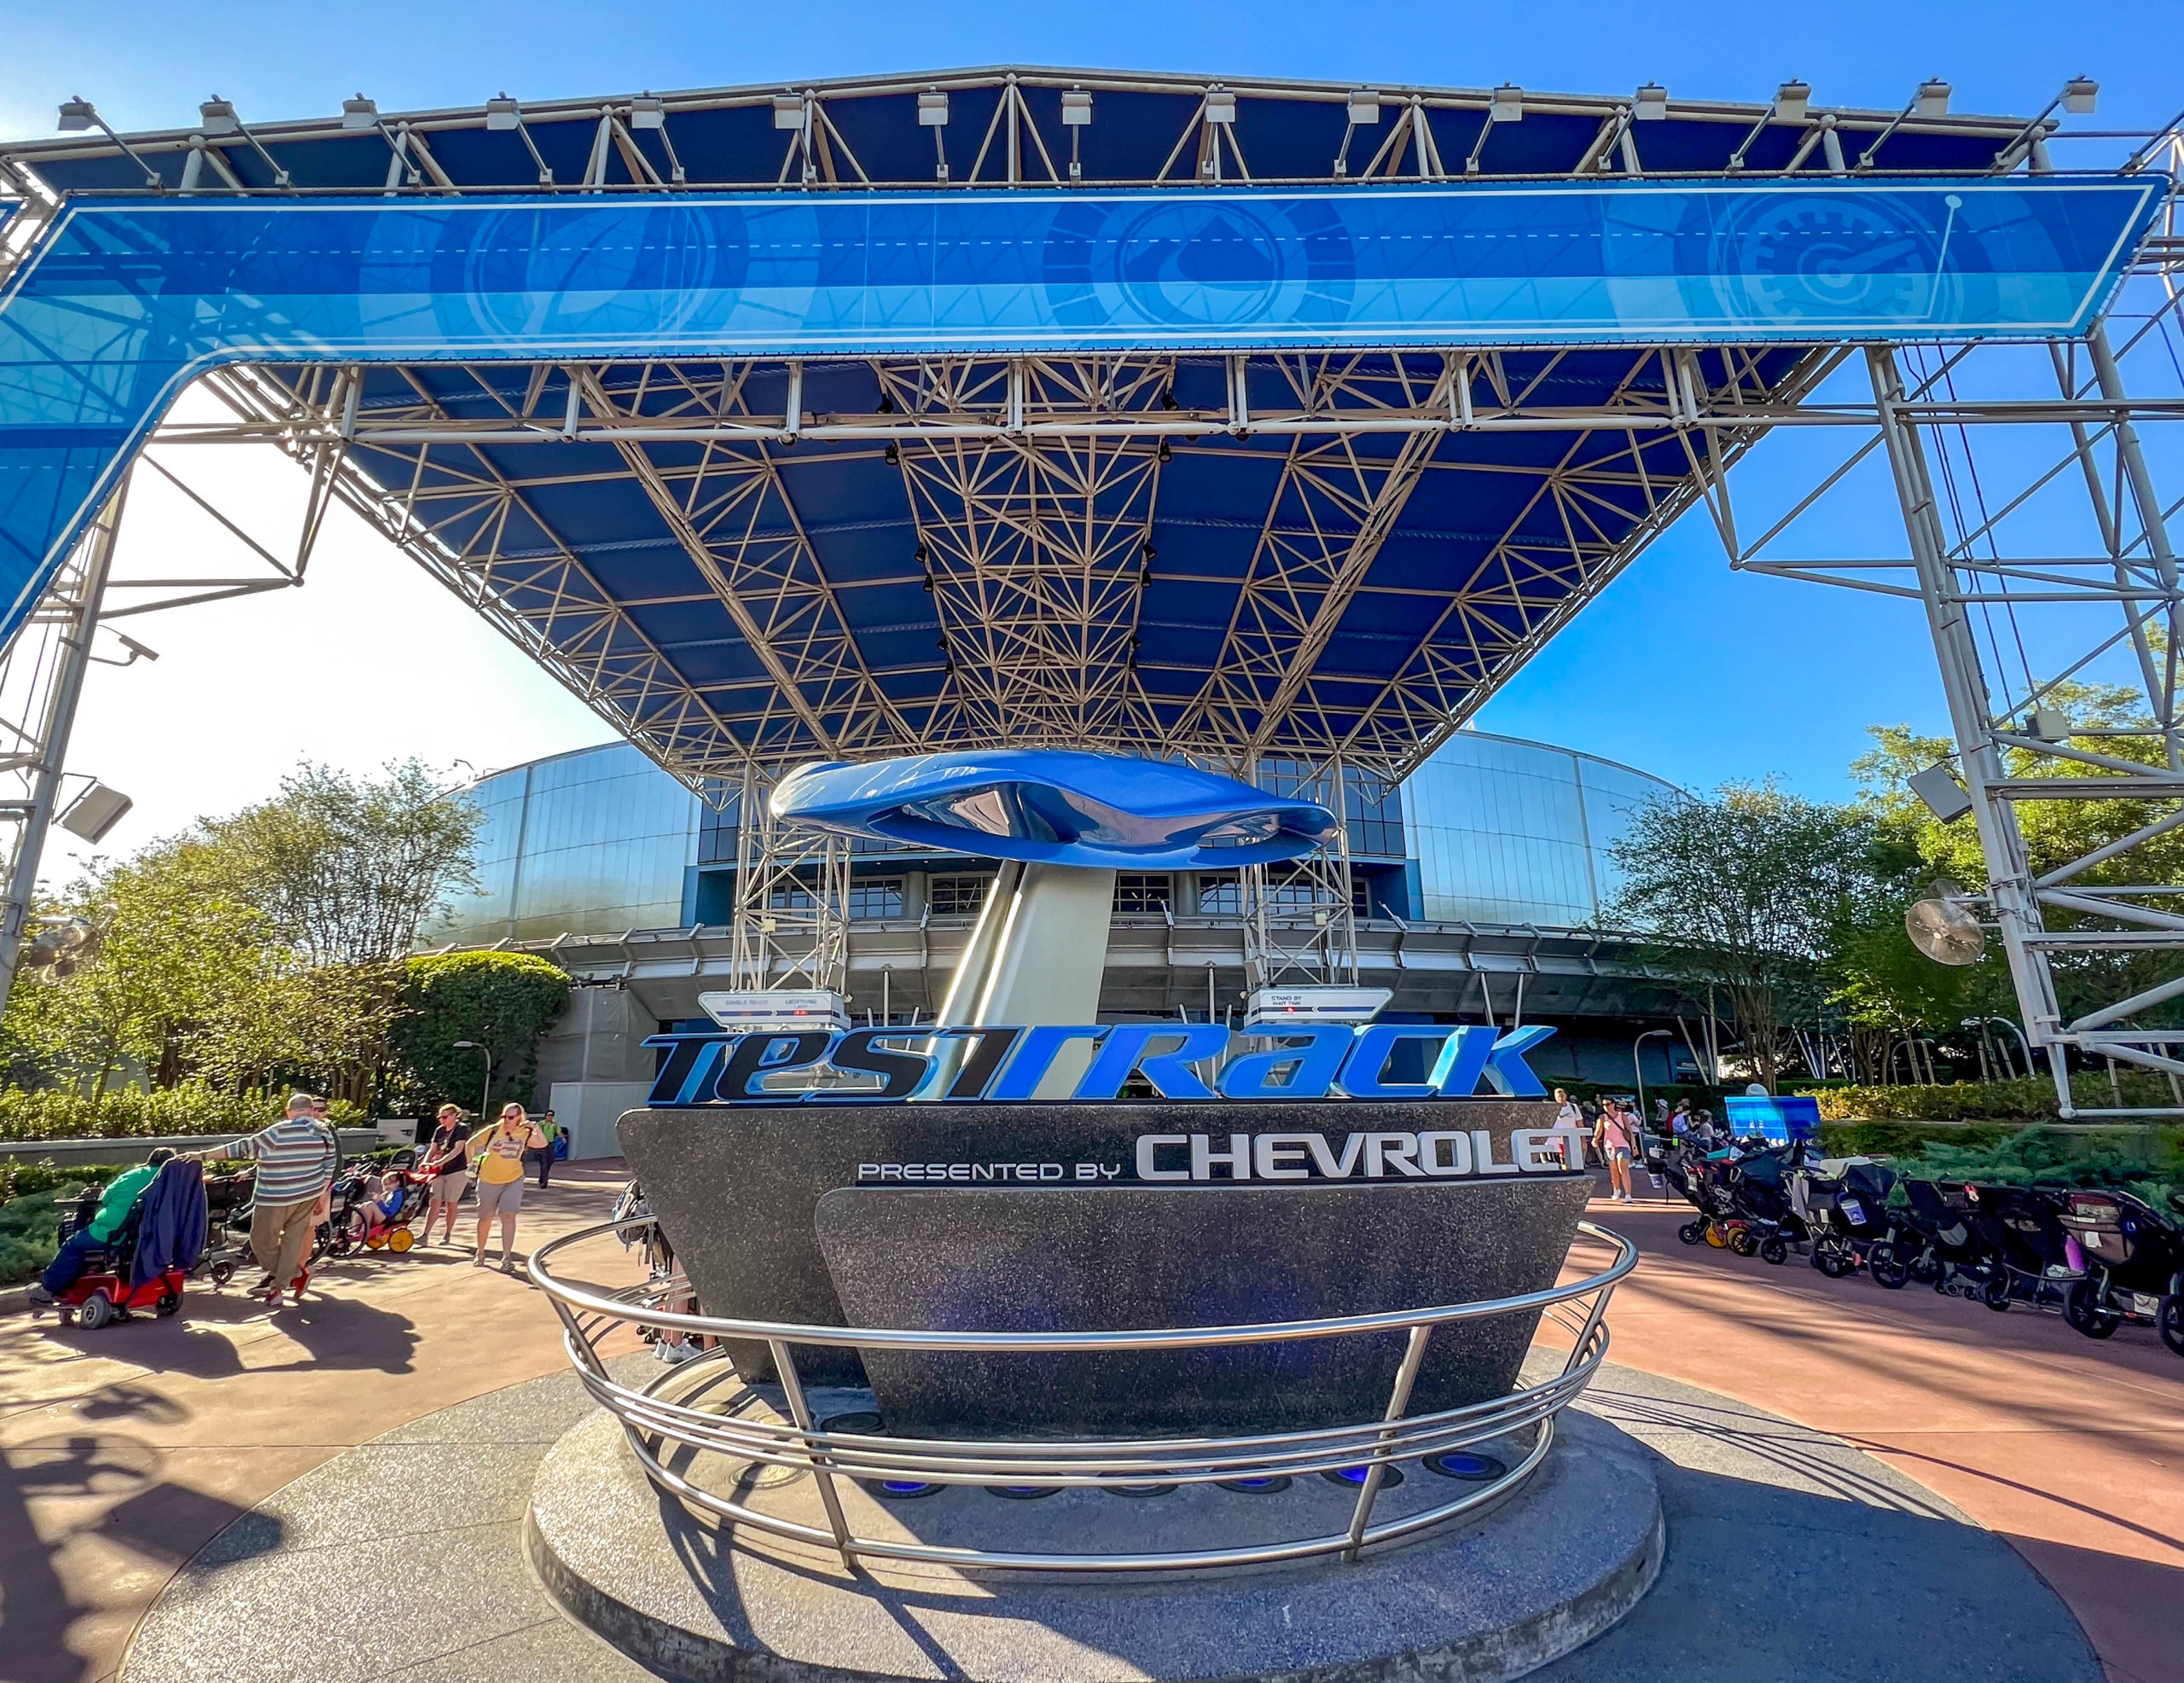
Test Track will close in its current form in June. While its wait time decreased this week, it’s still extraordinarily high at 90 minutes.
You should expect this sort of elevated wait time from now until the closing date for the popular EPCOT thrill ride.

Test Track
Also, if you love Test Track, you should consider one final trip to Walt Disney World over the next two months.
I’m confident that the next version of Test Track will be incredible, but significant changes are in store for this ride.
Magic Kingdom

Magic Kingdom Spring Break crowds
Finally, here are Magic Kingdom’s average wait times for last week:
- Seven Dwarfs Mine Train – 102 minutes, down 11
- Peter Pan’s Flight – 81 minutes, down 3
- Jungle Cruise – 77 minutes, down 5
- Space Mountain – 76 minutes, down 13
- Big Thunder Mountain Railroad – 58 minutes, down 11
- Haunted Mansion – 56 minutes, down 4
- Princess Fairytale Hall – 51 minutes, down 1
- Ariel’s Grotto – 50 minutes, down 1
- Buzz Lightyear’s Space Ranger Spin – 48 minutes, down 9
- Astro Orbiter – 45 minutes, down 4
- The Many Adventures of Winnie the Pooh – 45 minutes, down 2
- Town Square Theater – 45 minutes, down 1
- Pete’s Silly Sideshow – 44 minutes, up 2
- The Barnstormer – 41 minutes, down 7
- Dumbo the Flying Elephant – 41 minutes, down 4
- Pirates of the Caribbean – 41 minutes, down 6
- It’s a Small World – 40 minutes, down 3
- Enchanted Tales with Belle – 39 minutes, down 4
- Under the Sea ~ Journey of the Little Mermaid – 39 minutes, down 6
- Magic Carpets of Aladdin – 33 minutes, down 6
- Tomorrowland Speedway – 31 minutes, down 5
- Mad Tea Party – 27 minutes, down 4
- Walt Disney World Railroad – 25 minutes, no change
- Mickey’s PhilharMagic – 21 minutes, up 3
- Tomorrowland Transit Authority PeopleMover – 21 minutes, no change
- Monsters, Inc. Laugh Floor – 20 minutes, down 1
- Prince Charming Regal Carrousel – 20 minutes, no change
- Walt Disney’s Carousel of Progress – 5 minutes, no change
Final Thoughts

Magic Kingdom Spring Break crowds
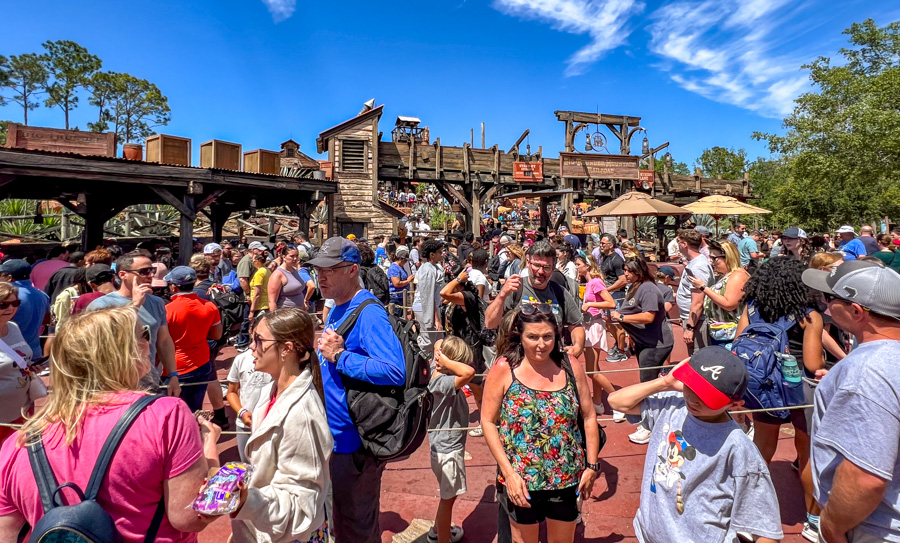
Overall, Magic Kingdom guests spent an average of 39 minutes per attraction, three minutes less than last time.
In looking at the daily splits, you can tell when people started leaving. And again, Disney hints at this fact with its pricing.

Magic Kingdom Spring Break crowds
When the price of Disney Genie+ goes up, you should expect more crowds. If it drops, you’re in business.
We also have a couple of upcoming factors that should help at Magic Kingdom.

Magic Kingdom Spring Break crowds
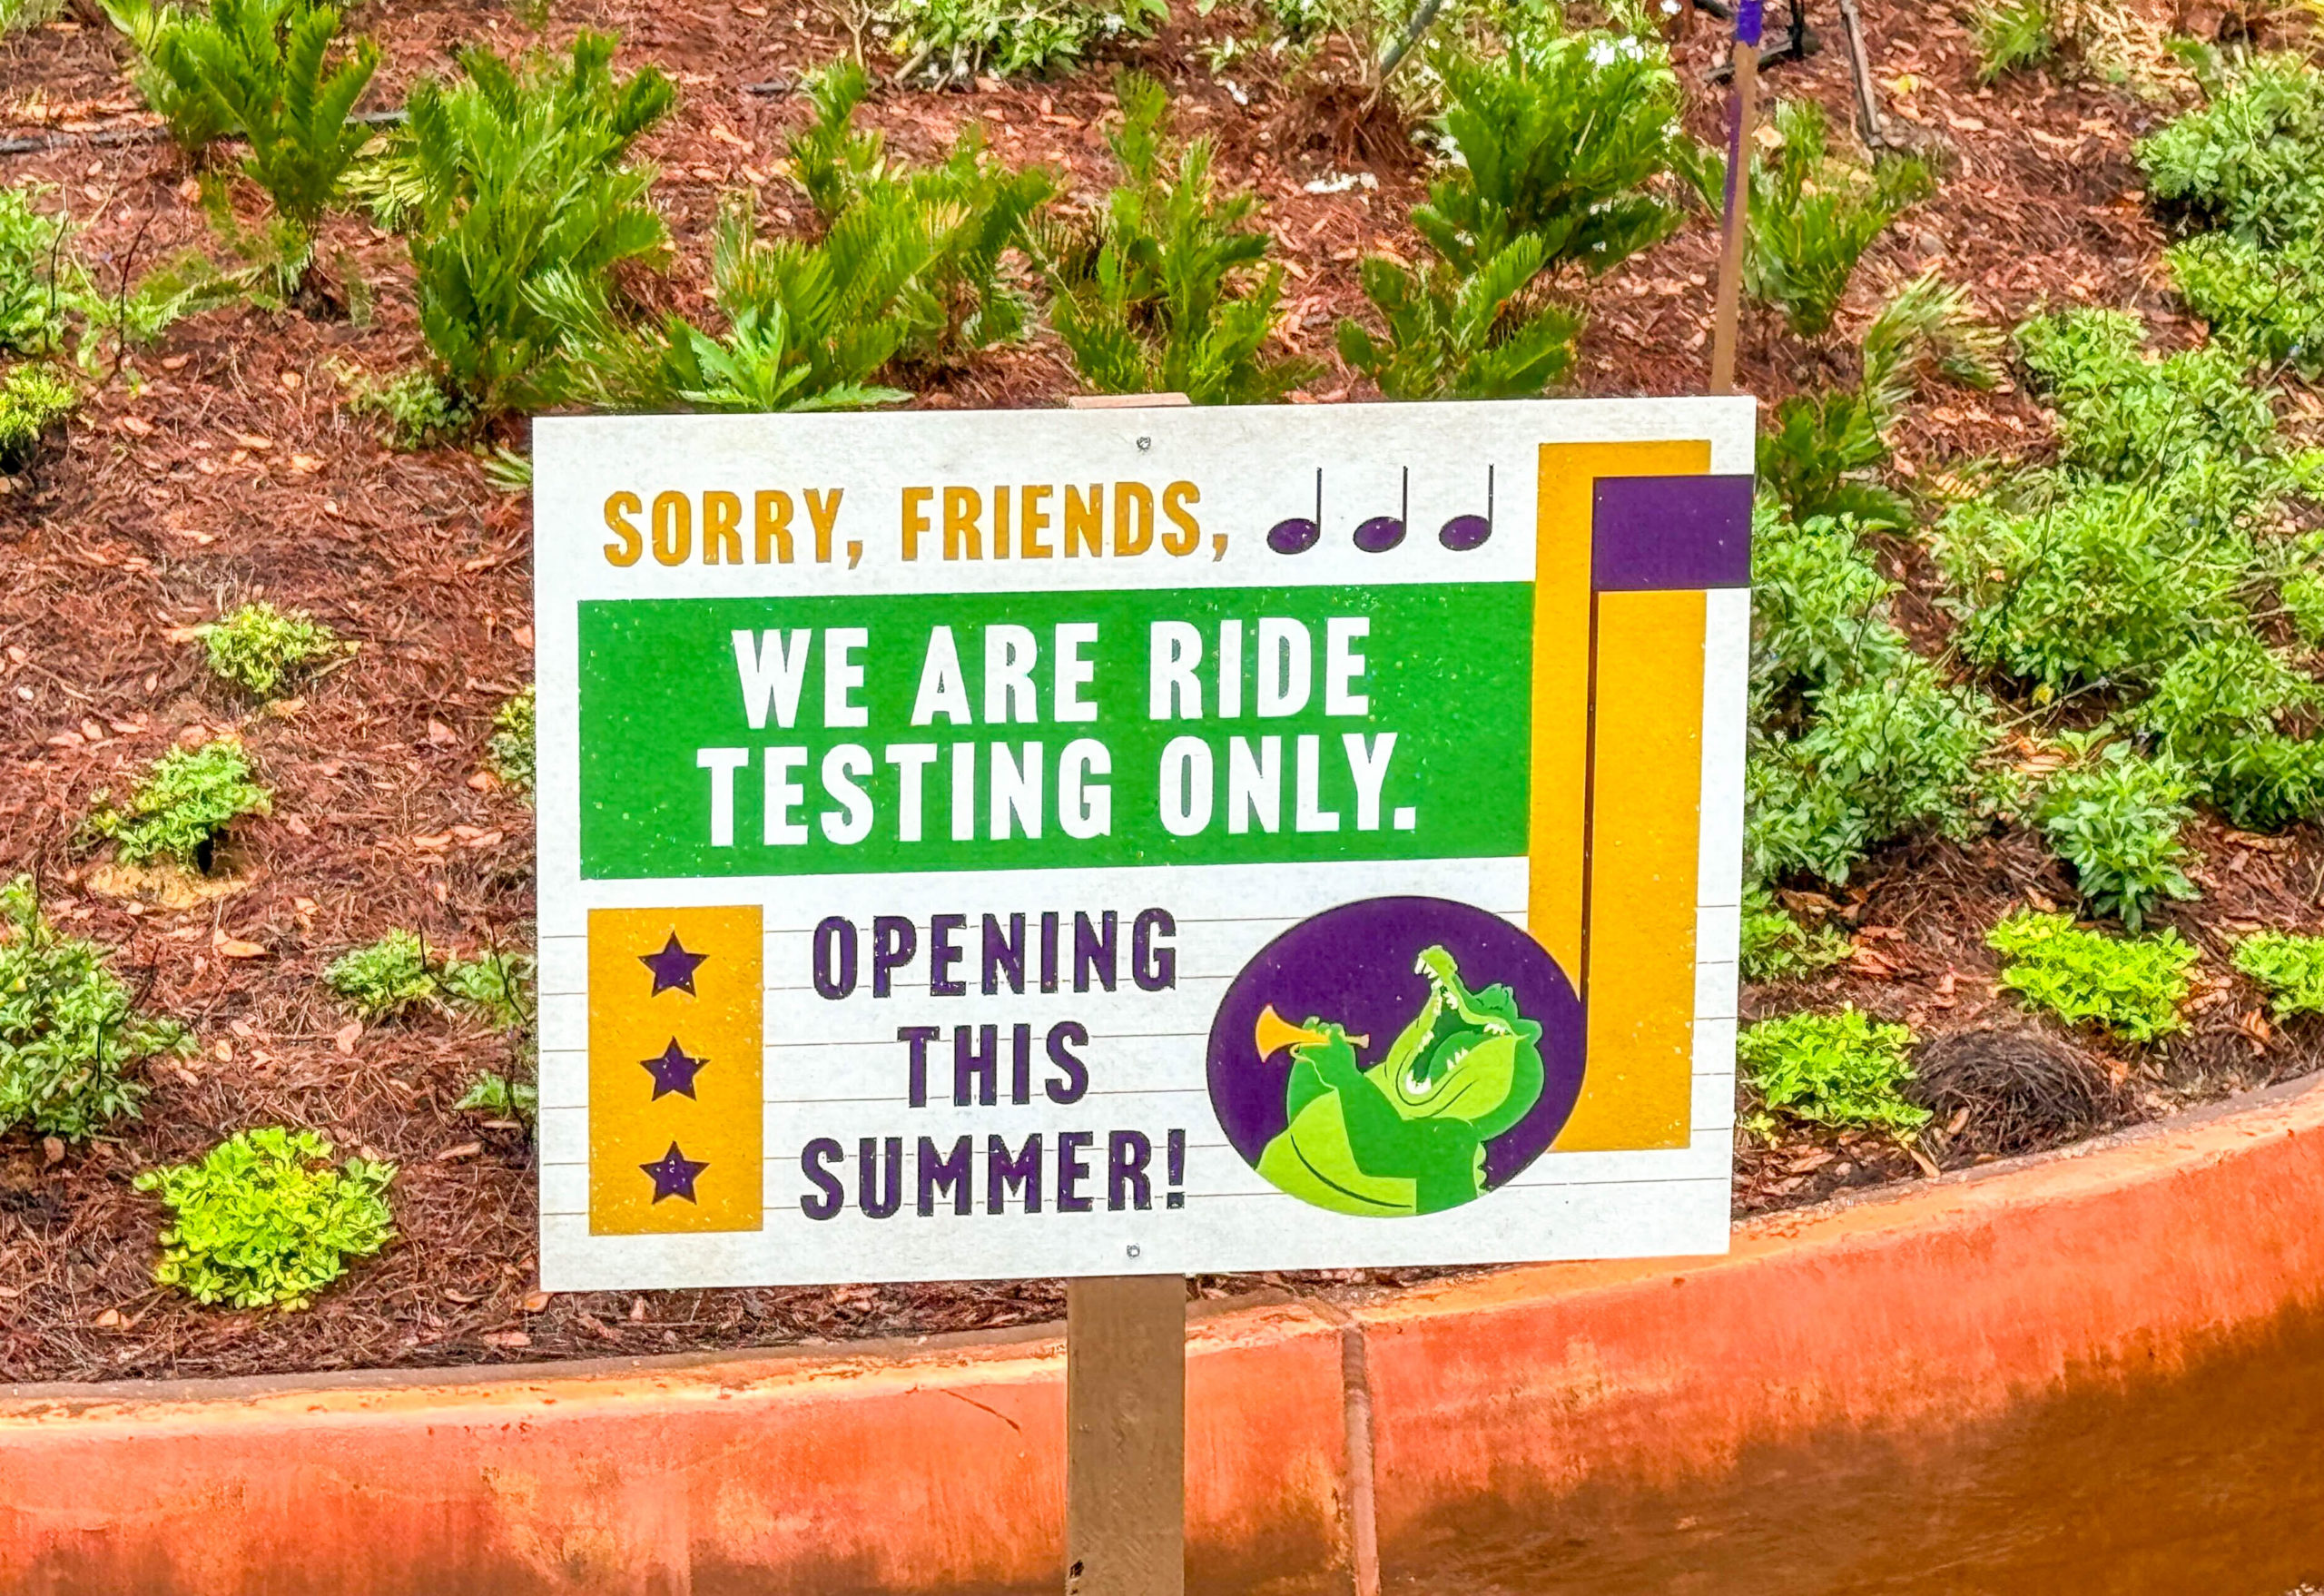
The new version of Country Bear Jamboree and Tiana’s Bayou Adventure should open over the next few months.
Those are crowd-eater rides with massive throughput, so wait times will even out a bit when they reopen.

Tiana’s Bayou Adventure signage
As you can tell, Walt Disney World is in flux at the moment, and it’ll probably stay that way for a while.
Still, Disney is doing a terrific job in managing crowd distribution, something we take for granted…when we aren’t eating on the floor at Cosmic Ray’s.

MickeyBlog Logo
Thanks for visiting MickeyBlog.com! Want to go to Disney? For a FREE quote on your next Disney vacation, please fill out the form below, and one of the agents from MickeyTravels, a Diamond Level Authorized Disney Vacation Planner, will be in touch soon!


