Walt Disney World Wait Times for Fourth Week of February 2024

Last week, we discussed the President’s Day wait times. Then, something remarkable happened.
For the third straight holiday, guests lingered into the following week.
MickeyBlog reported multiple sellouts of Disney Genie+ and large crowds throughout the parks.
Don’t be surprised if the Walt Disney World wait times for the fourth week of February 2024 are fairly sizable.
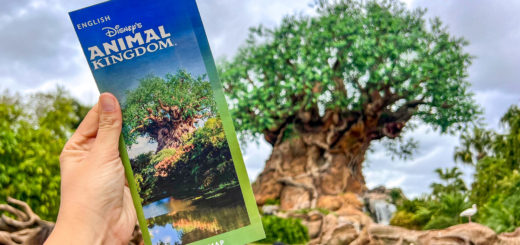
Disney’s Animal Kingdom
One of the fascinating parts of tracking wait time data is that anecdotal reports are often inaccurate.
Sure, the parks were unmistakably more crowded than any of us would expect during the final days of February.
That doesn’t necessarily guarantee longer wait times, though.
Photo: TouringPlans.com
Here are the average waits for Animal Kingdom this week:
- Avatar Flight of Passage – 125 minutes, up 3
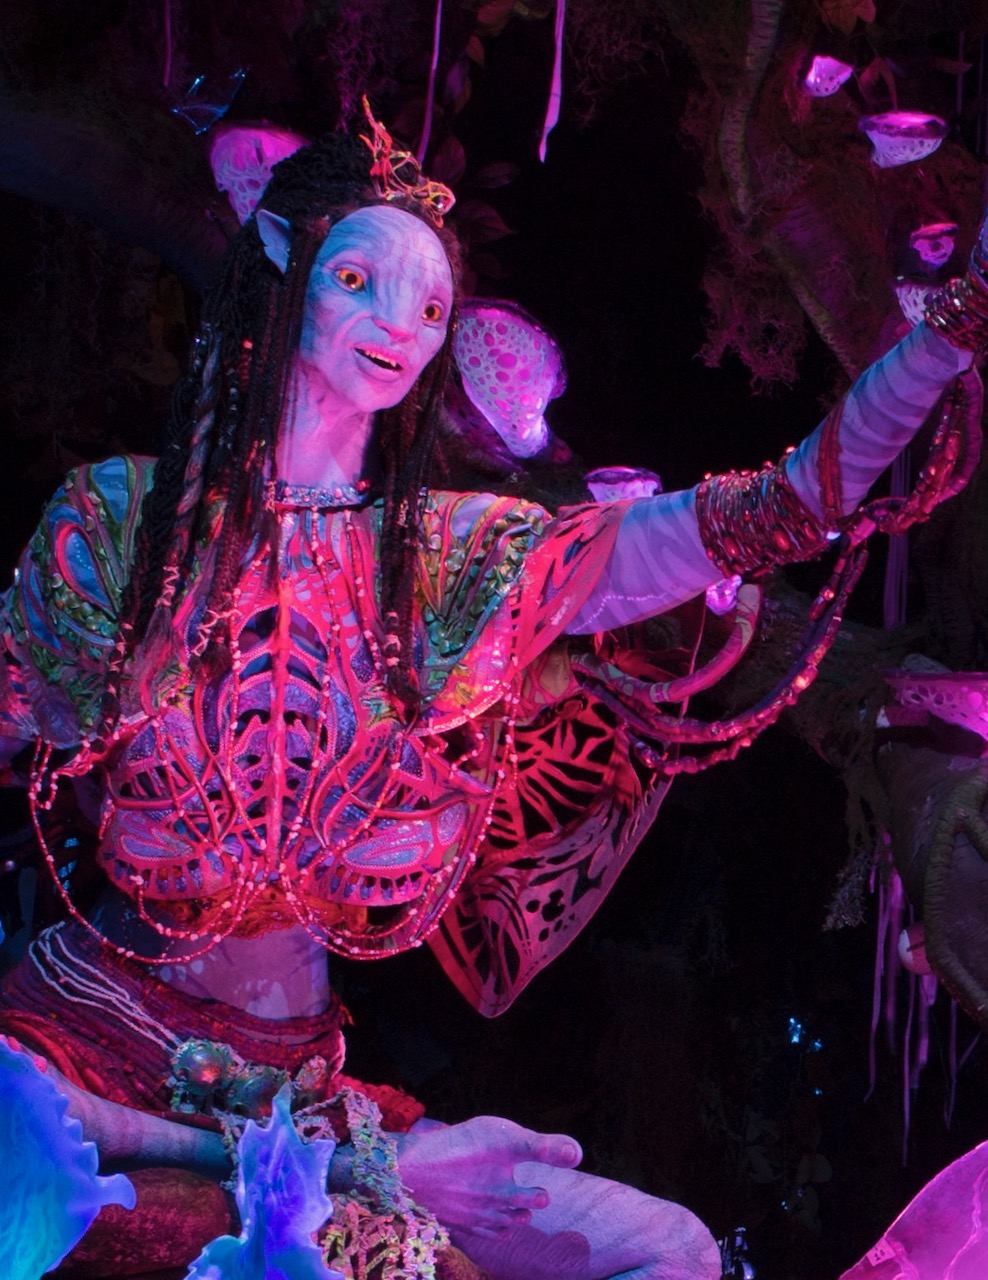
- Na’vi River Journey – 85 minutes, up 2
- Kilimanjaro Safaris – 77 minutes, up 29
- Expedition Everest – 62 minutes, up 7
- Adventurers Outpost – 60 minutes, up 3
- DINOSAUR – 38 minutes, up 4
- TriceraTop Spin – 19 minutes, up 6
- It’s a Tough to Be a Bug! – 15 minutes, no change
Overall, guests stood in line for an average of 60 minutes, which is six minutes or 11 percent more than last time.
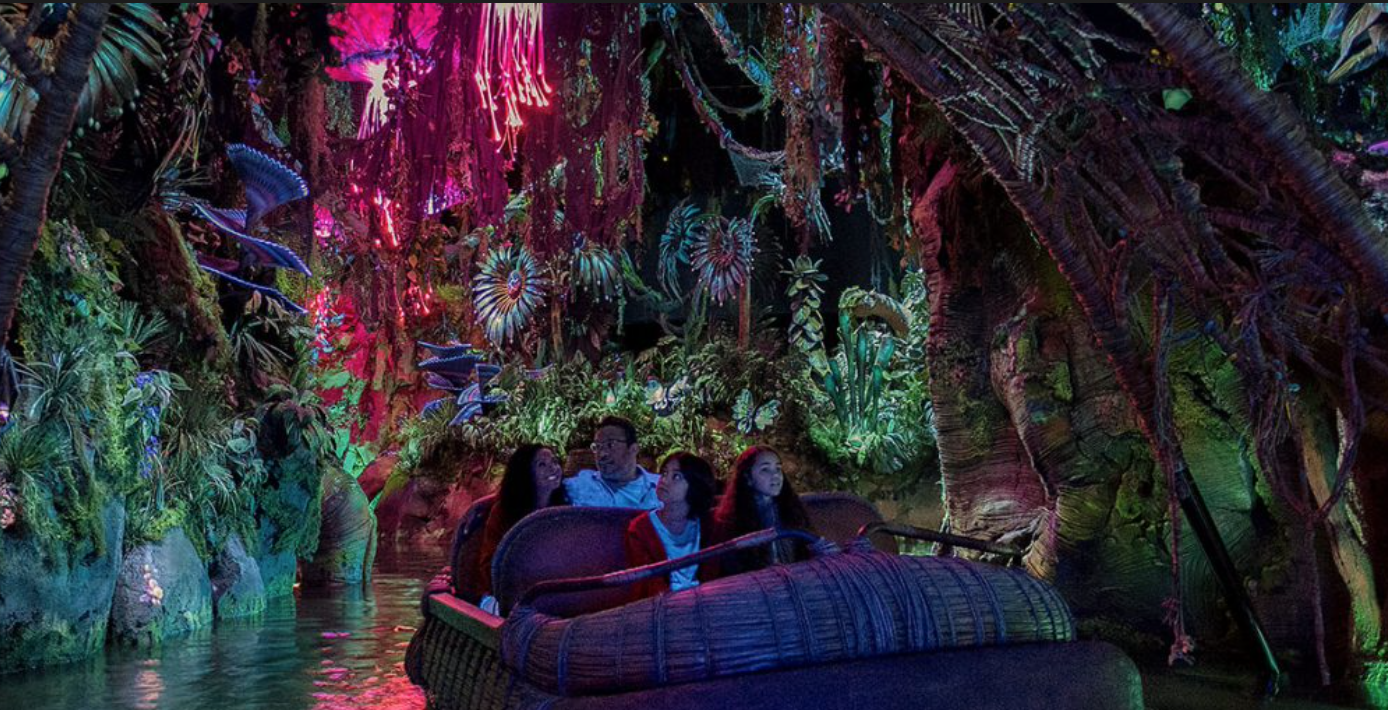
Photo: D23
Almost as importantly, every Animal Kingdom attraction increased its wait from last time, albeit modestly for the most part.
The other point I’ll highlight is that five Animal Kingdom attractions required an hour-long wait.
(Kent Phillips, photographer)
That’s extremely rare for this park, as is an average wait time of 60 minutes.
These are two strong signs that crowds were gigantic last week.
Disney’s Hollywood Studios
Credit: Disney
Of course, one park often proves to be the outlier with regard to wait times.
Let’s check the attraction wait times at Hollywood Studios for comparison.
- Slinky Dog Dash – 131 minutes, up 10
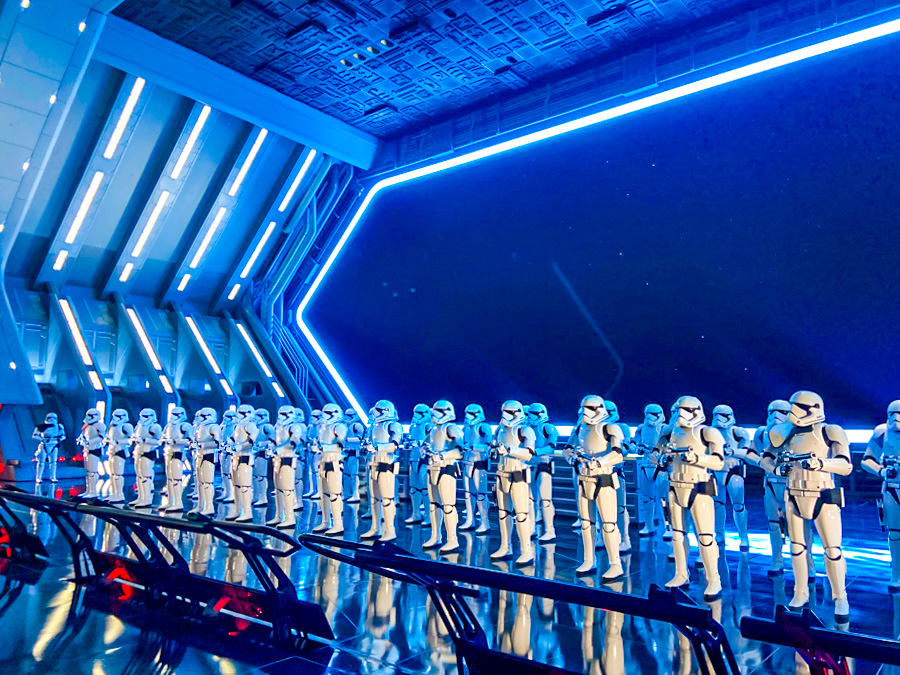
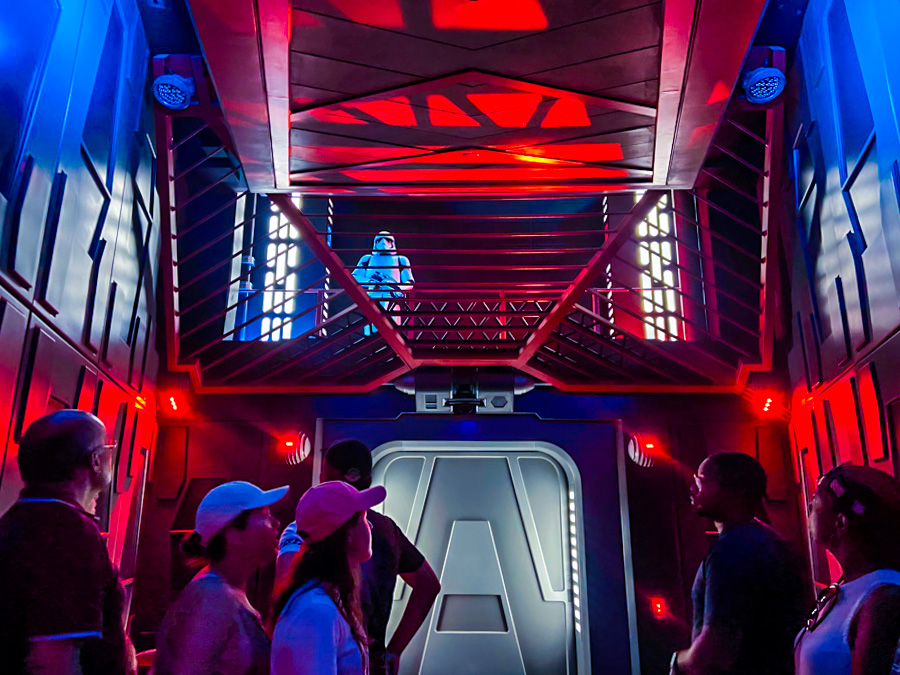
- Star Wars: Rise of the Resistance – 115 minutes, no change
- Twilight Zone Tower of Terror – 90 minutes, up 1
- Mickey & Minnie’s Runaway Railway – 82 minutes, up 5
- Toy Story Mania! – 82 minutes, up 6
- Millennium Falcon: Smugglers Run – 81 minutes, no change
- Alien Swirling Saucers – 51 minutes, up 3
- Red Carpet Dreams – 47 minutes, up 3
- Star Tours – The Adventures Continue – 31 minutes, up 6
- Celebrity Spotlight – 27 minutes, up 2
- Lightning McQueen’s Racing Academy – 15 minutes, no change
- Muppet*Vision 3D — 10 minutes, no change
Overall, Hollywood Studios visitors waited in line for an average of 59 minutes per attraction, five minutes more than last time.
That’s also two straight parks where every attraction listed the same average wait time or increased its wait by a few minutes.
EPCOT
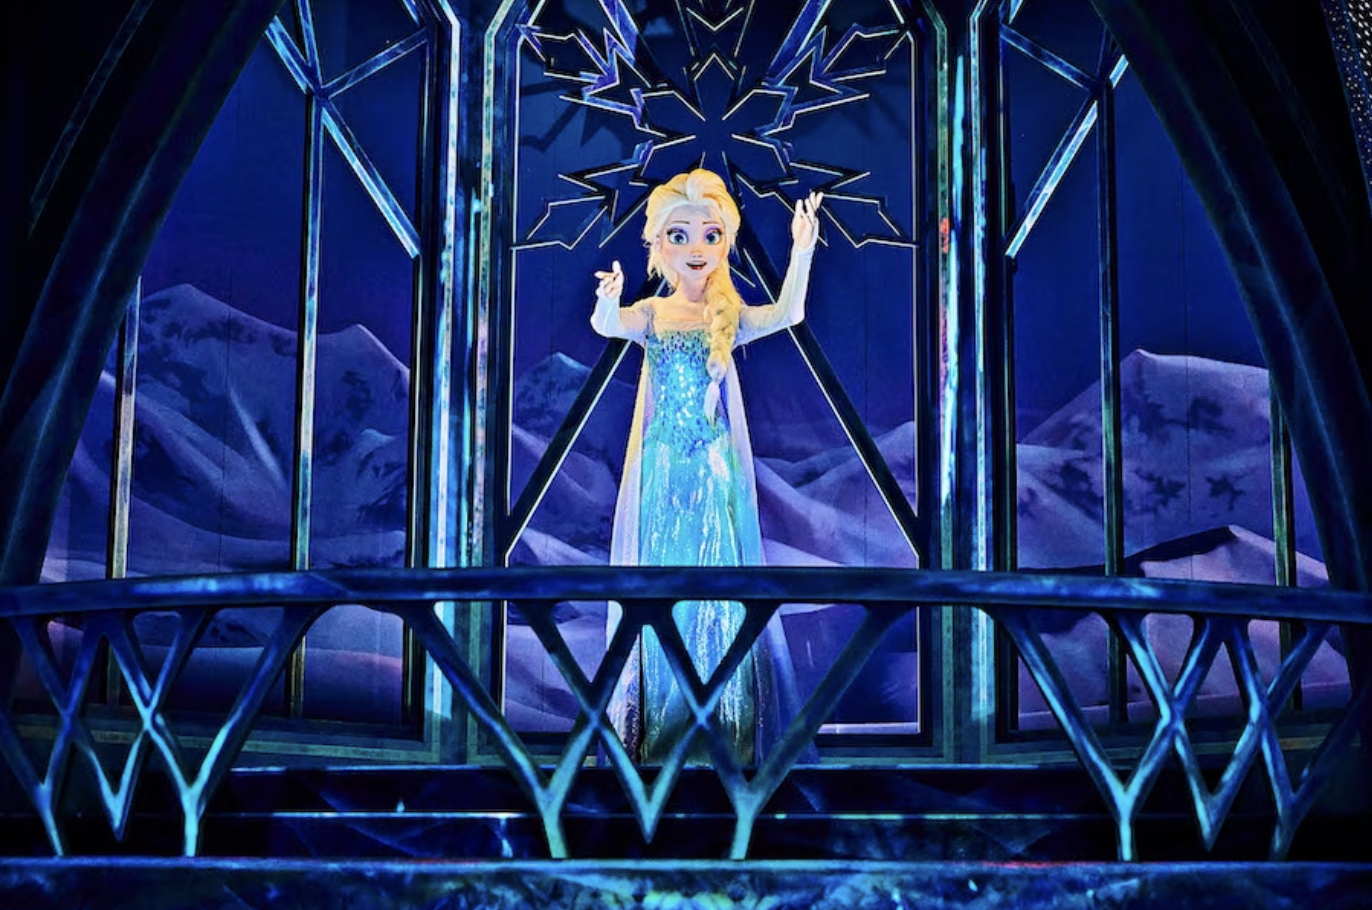
Photo: Disney
I think we know the deal by now, but EPCOT still provides some intrigue.
This past week marked the final days of the 2024 EPCOT International Festival of the Arts.
EPCOT also rewarded fans by adding many elements of the upcoming EPCOT International Flower & Garden Festival.
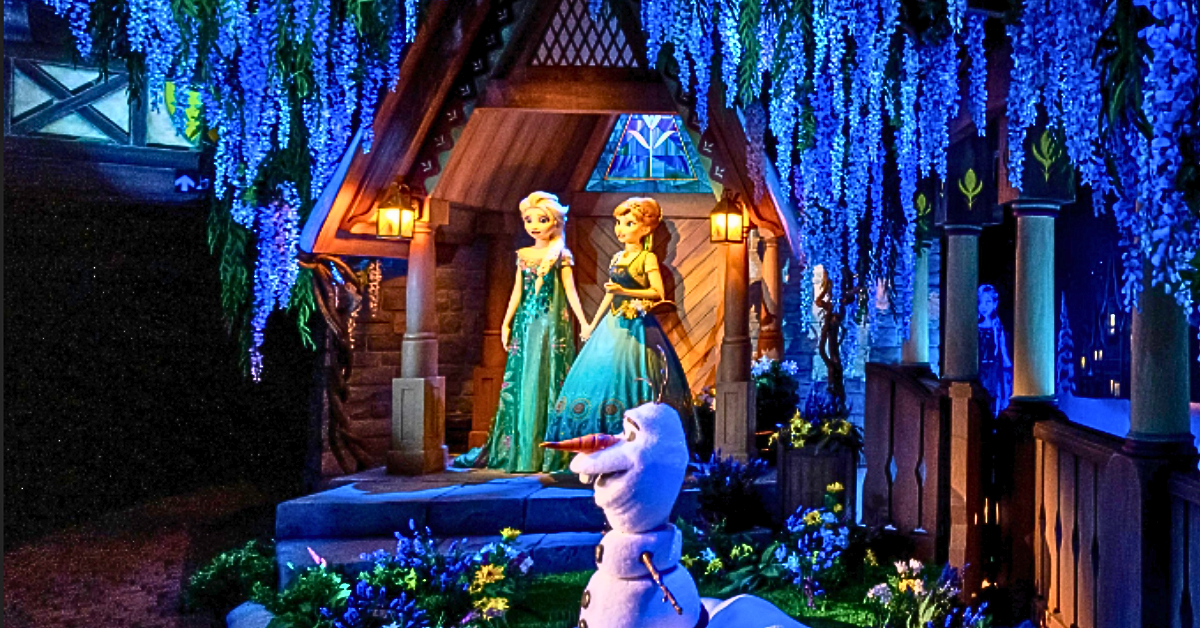
Photo: Disney
Many of the topiaries were already visible, which probably enticed a few extra guests as well.
How much did all these factors increase the average wait times? Let’s check:
- Remy’s Ratatouille Adventure – 98 minutes, up 1
- Frozen Ever After – 97 minutes, up 1
- Test Track – 84 minutes, up 2
- Soarin’ Around the World – 65 minutes, down 8
- Royal Sommerhus – 44 minutes, up 1
- Mission: SPACE – 39 minutes, down 6
- Spaceship Earth – 28 minutes, no change
- The Seas with Nemo & Friends – 23 minutes, no change
- Turtle Talk with Crush – 21 minutes, no change
- Journey into Imagination with Figment – 17 minutes, down 1
- Gran Fiesta Tour Starring the Three Caballeros – 16 minutes, no change
- Living with the Land – 16 minutes, down 2
Credit: Good Morning America
Okay, that data messes with the narrative a bit. Guests spent 45 minutes in line per attraction last week.
That’s one minute less than last time. However, I’ll remind you that EPCOT increased eight minutes the previous week.

Photo: Disney
For this park in particular, that’s a dramatic change in circumstances.
So, this week’s data reflects that the President’s Day crowds stayed longer than expected for a three-day holiday as a rule.
Magic Kingdom
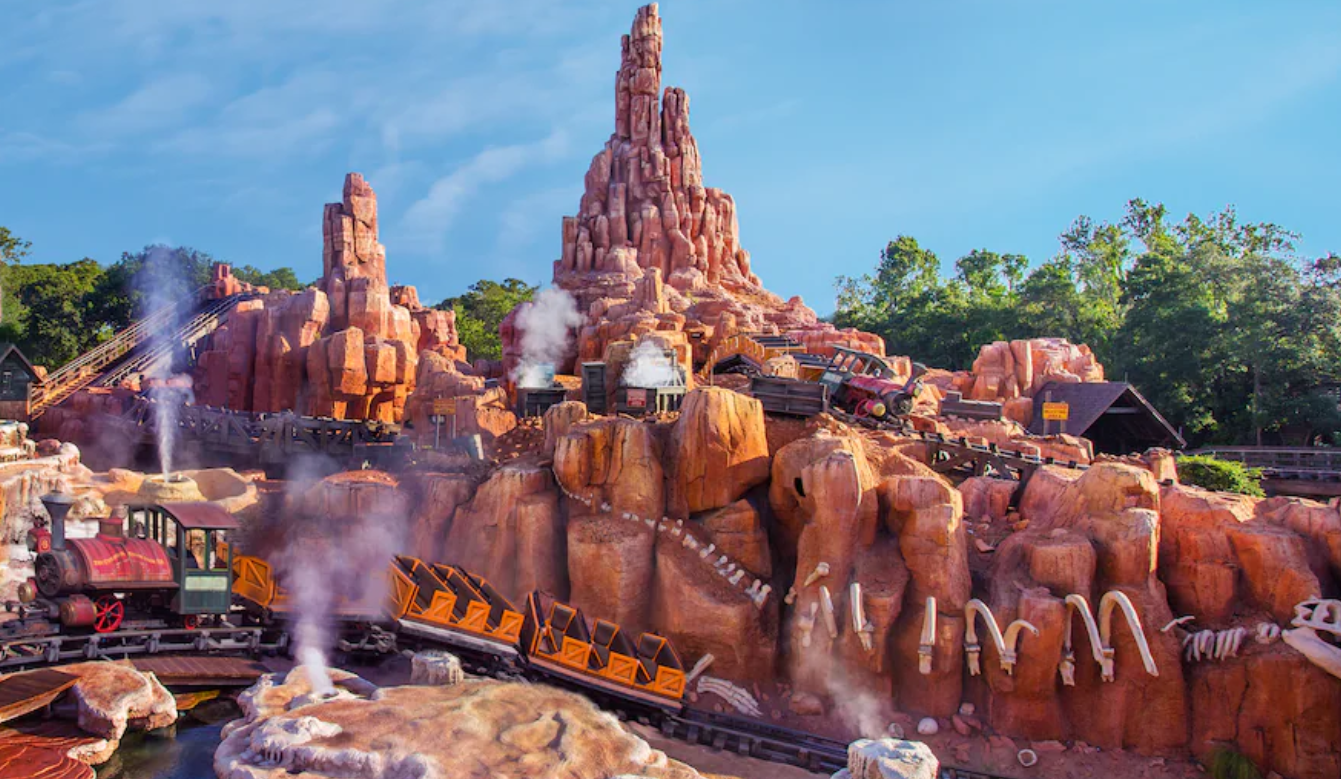
Photo: Disney
How were the Magic Kingdom crowds? Let’s check:
- Seven Dwarfs Mine Train – 102 minutes, up 5
- Peter Pan’s Flight – 82 minutes, up 7
- Jungle Cruise – 76 minutes, up 8
- Space Mountain – 74 minutes, no change
- Big Thunder Mountain Railroad – 62 minutes, up 7
- Haunted Mansion – 60 minutes, up 2
- Buzz Lightyear’s Space Ranger Spin – 51 minutes, up 4
- Ariel’s Grotto – 48 minutes, up 4
- Princess Fairytale Hall – 48 minutes, up 3
- The Many Adventures of Winnie the Pooh – 47 minutes, up 2
- Pirates of the Caribbean – 47 minutes, up 4
- Town Square Theater – 44 minutes, up 1
- Astro Orbiter – 43 minutes, up 6
- It’s a Small World – 41 minutes, up 5
- Pete’s Silly Sideshow – 41 minutes, up 4
- The Barnstormer – 40 minutes, up 7
- Dumbo the Flying Elephant – 39 minutes, up 7
- Enchanted Tales with Belle – 39 minutes, no change
- Under the Sea ~ Journey of the Little Mermaid – 37 minutes, up 2
- The Magic Carpets of Aladdin – 34 minutes, up 7
- Tomorrowland Speedway – 30 minutes, up 4
- Mad Tea Party – 24 minutes, up 2
- Walt Disney World Railroad – 23 minutes, up 5
- Tomorrowland Transit Authority PeopleMover – 22 minutes, up 5
- Prince Charming Regal Carrousel – 21 minutes, up 5
- Mickey’s PhilharMagic – 18 minutes, no change
- Monsters, Inc. Laugh Floor – 17 minutes, up 2
- Walt Disney’s Carousel of Progress – 5 minutes, no change
Final Thoughts
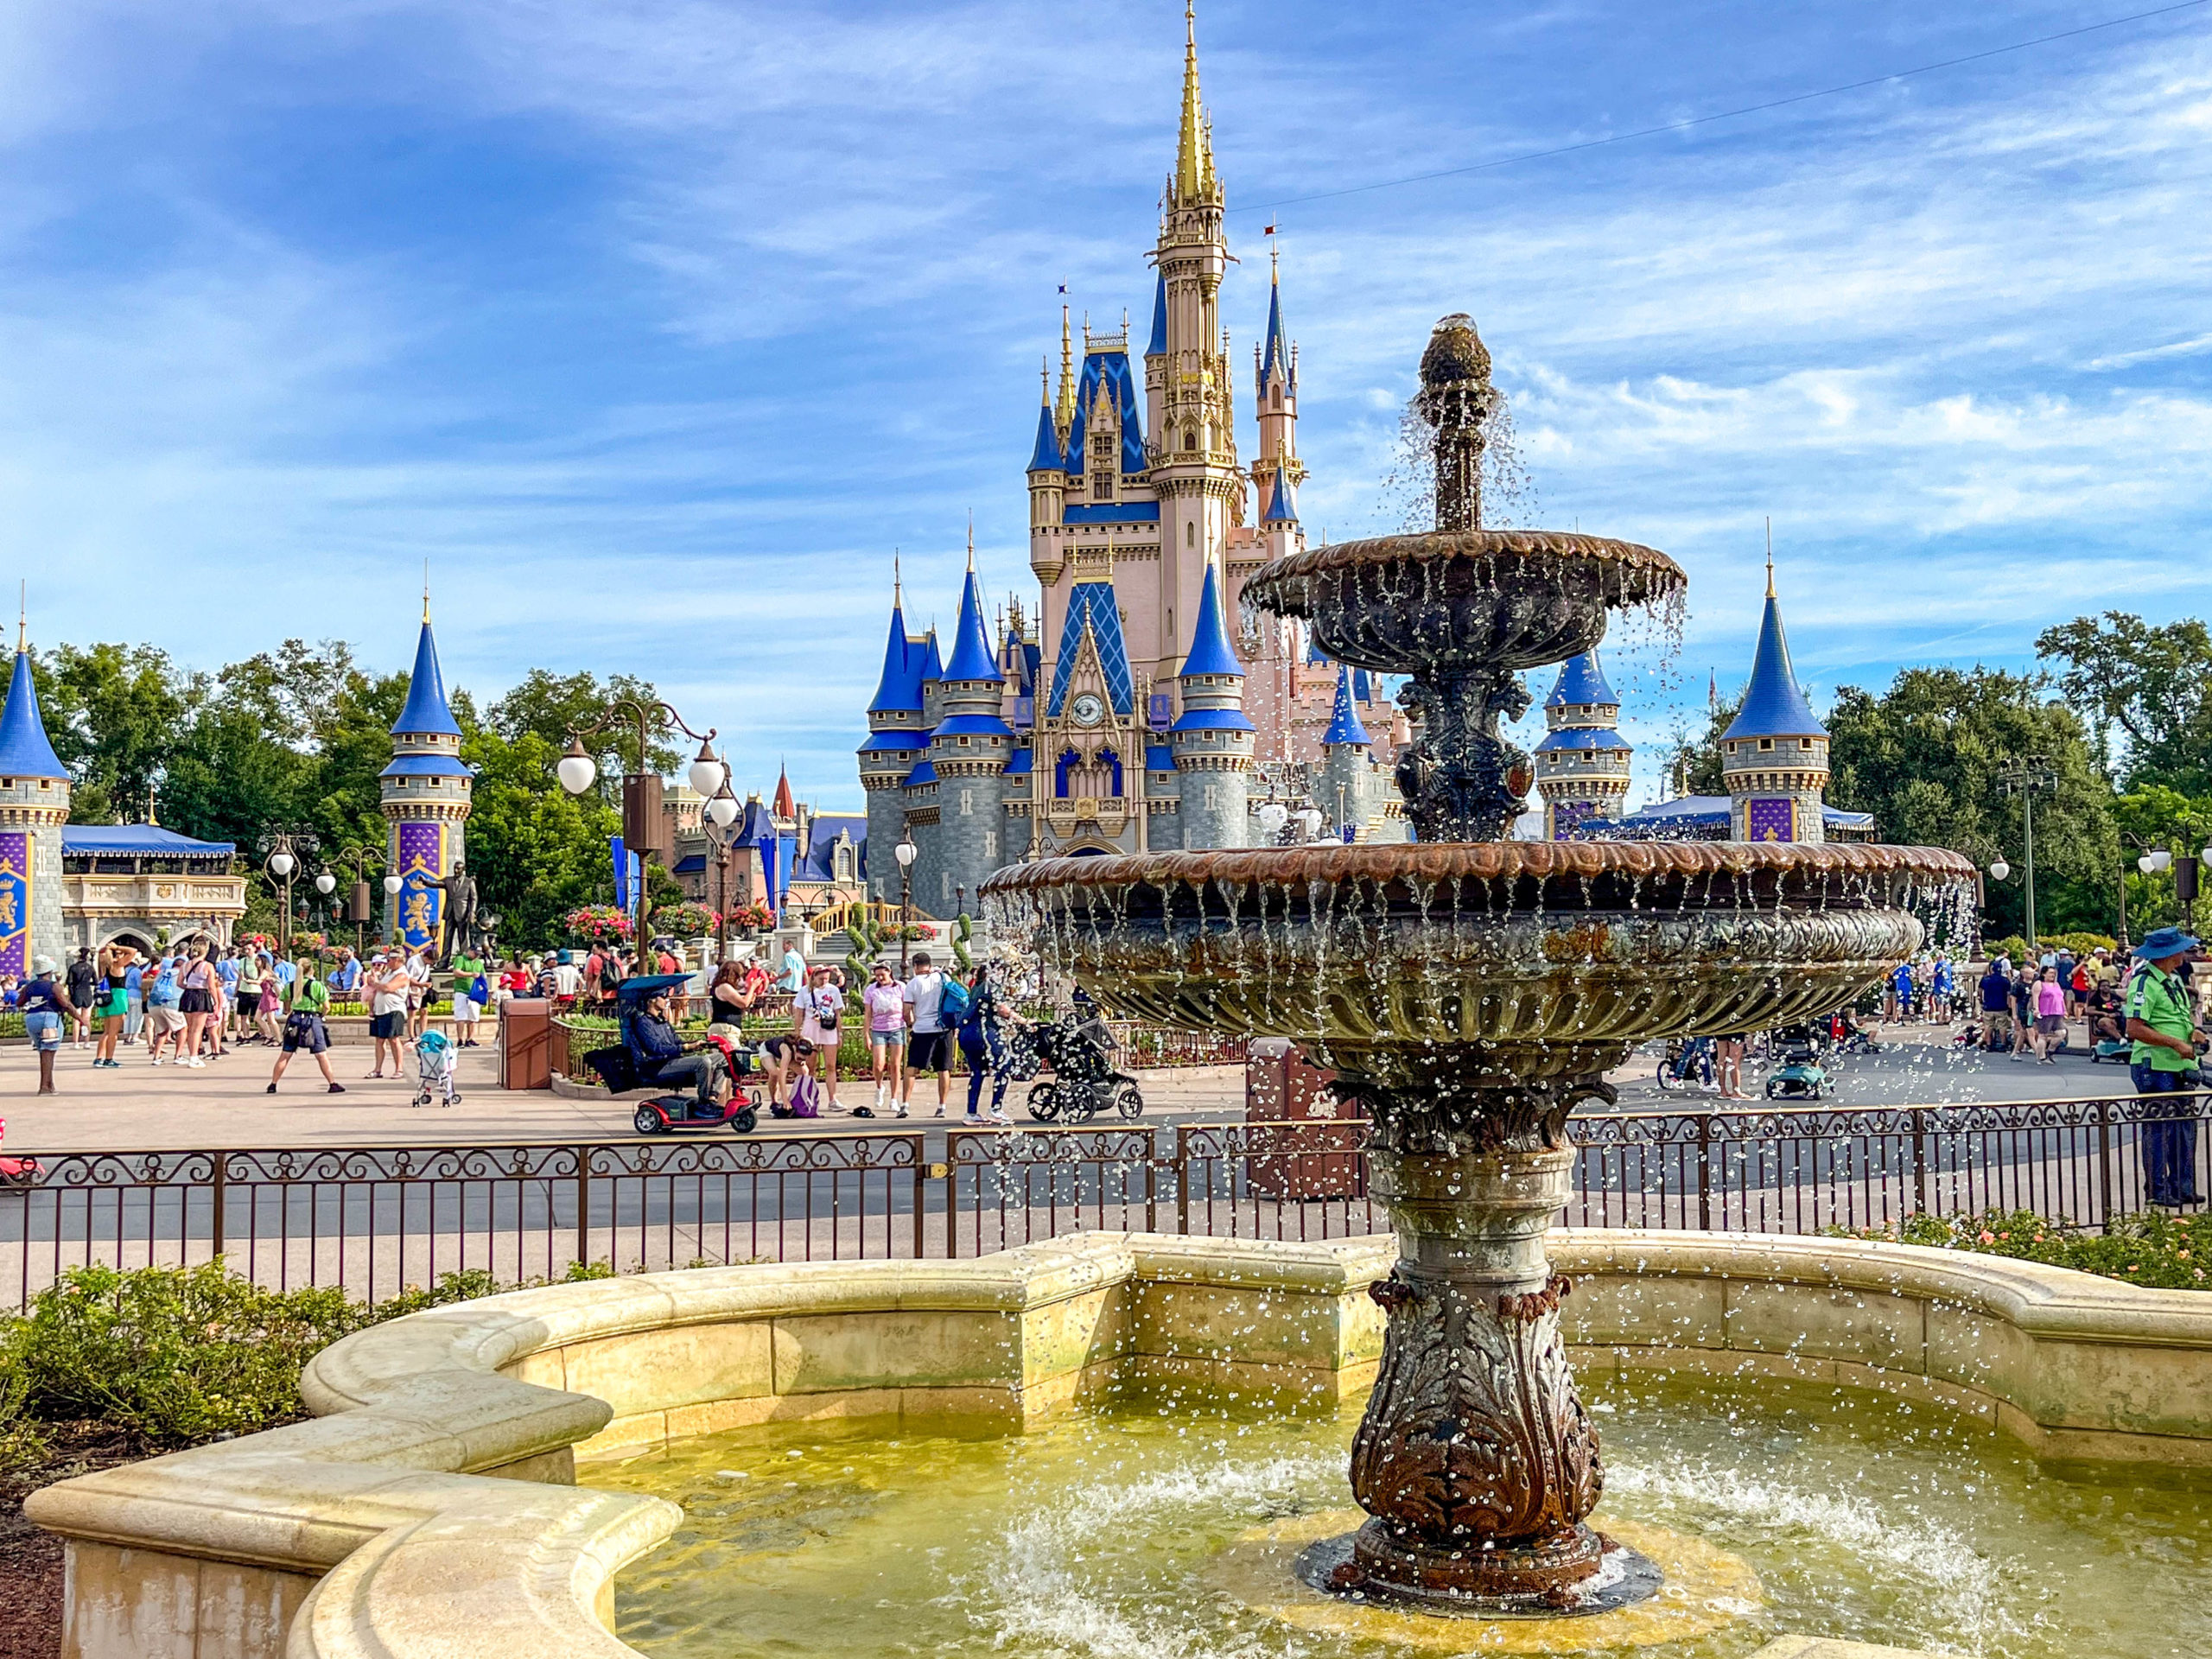
Cinderella Castle at Magic Kingdom
The first thing you probably noticed is that every Magic Kingdom attraction maintained or increaseed its average wait time.
Not coincidentally, the average wait time increased to 40 minutes, which is five minutes or 14 percent more than last time.
So, our anecdotal park reports totally align with the data. The parks were hopping this past week!
MickeyBlog Logo
Thanks for visiting MickeyBlog.com! Want to go to Disney? For a FREE quote on your next Disney vacation, please fill out the form below, and one of the agents from MickeyTravels, a Diamond Level Authorized Disney Vacation Planner, will be in touch soon!
Featured image: Disney