Walt Disney World Wait Times for Early September 2023
Walt Disney World just celebrated Destination D23 with a plethora of new theme park announcements.
Some of those guests spent the week at the parks, while everyone without tickets stayed away. Remember that we’re in September now.
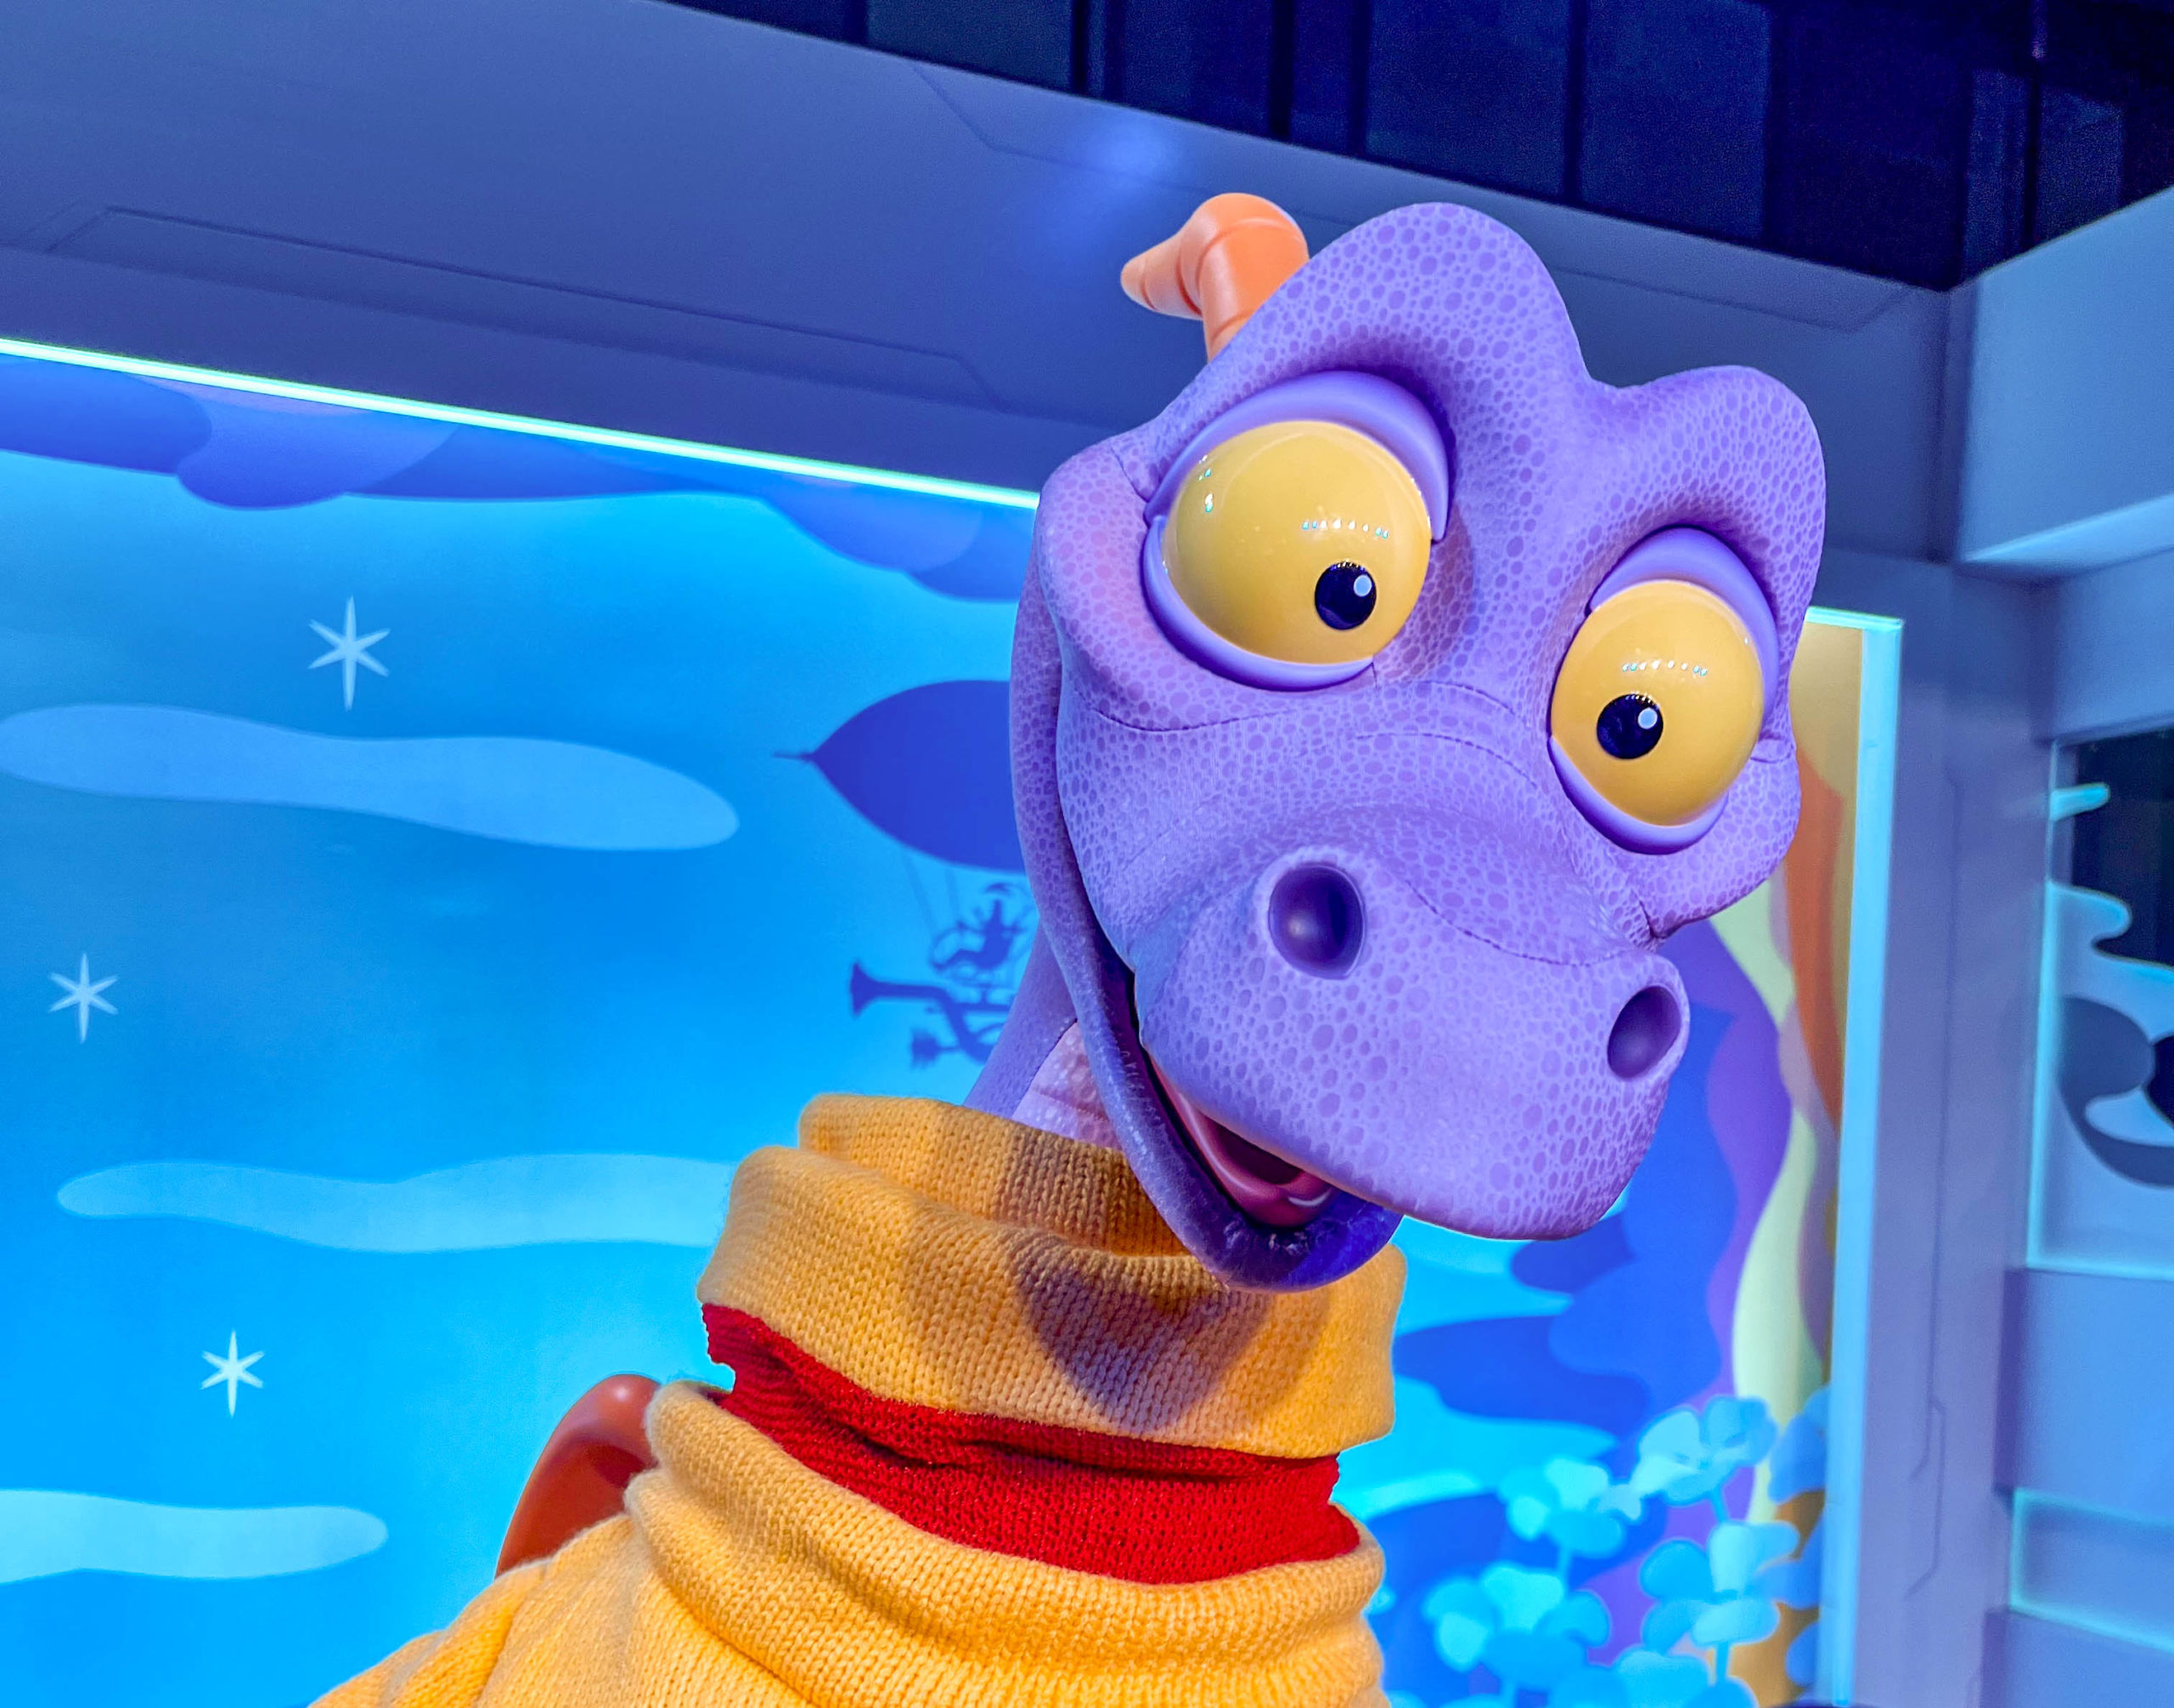
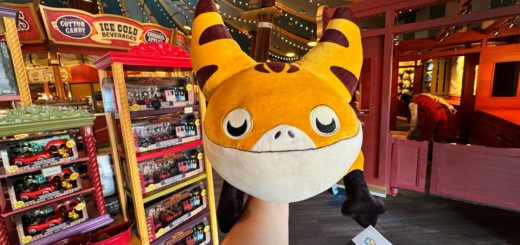
Figment
Since January became EPCOT International Festival of the Arts season, September has evolved into the least crowded month on the annual calendar.
So, how were Walt Disney World crowds this past week? I’m guessing…small.
Here are the average wait times for the first full week of September 2023.
Disney’s Animal Kingdom

Disney just stubbornly refused to announce a Zootopia or Encanto themed land coming to Animal Kingdom.
We still think Zootopia is happening, and Encanto likely will as well, probably as a Neighborhood.
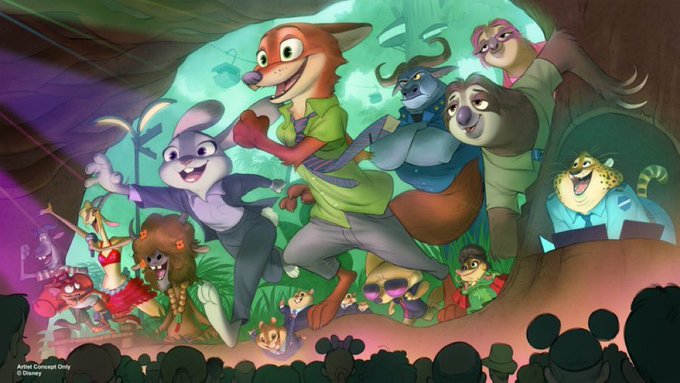
Photo: Disney
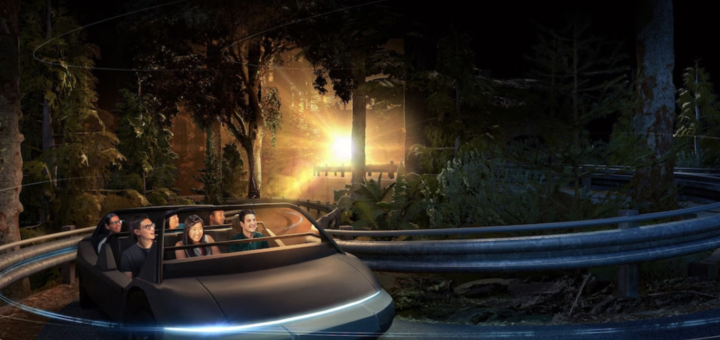
For now, we’ll spend another year with one attraction towering above the rest at Animal Kingdom.
That ride is Avatar Flight of Passage, which had an average wait of 66 minutes. That’s eight minutes more than the previous week.

Photo: Disney
The other Pandora ride, Na’vi River Journey, averaged a wait of 61 minutes, which is 12 minutes more than last time.
There’s an explanation for this, but let’s look at the park’s other average waits before getting into that.
- Adventurers Outpost – 38 minutes, up 5
- Kilimanjaro Safaris – 23 minutes, up 7
- Expedition Everest – 21 minutes, up 2
- DINOSAUR – 20 minutes, up 7
- Kali River Rapids – 18 minutes, no change
- It’s Tough to Be a Bug! – 10 minutes, no change
- TriceraTop Spin – 8 minutes, up 3
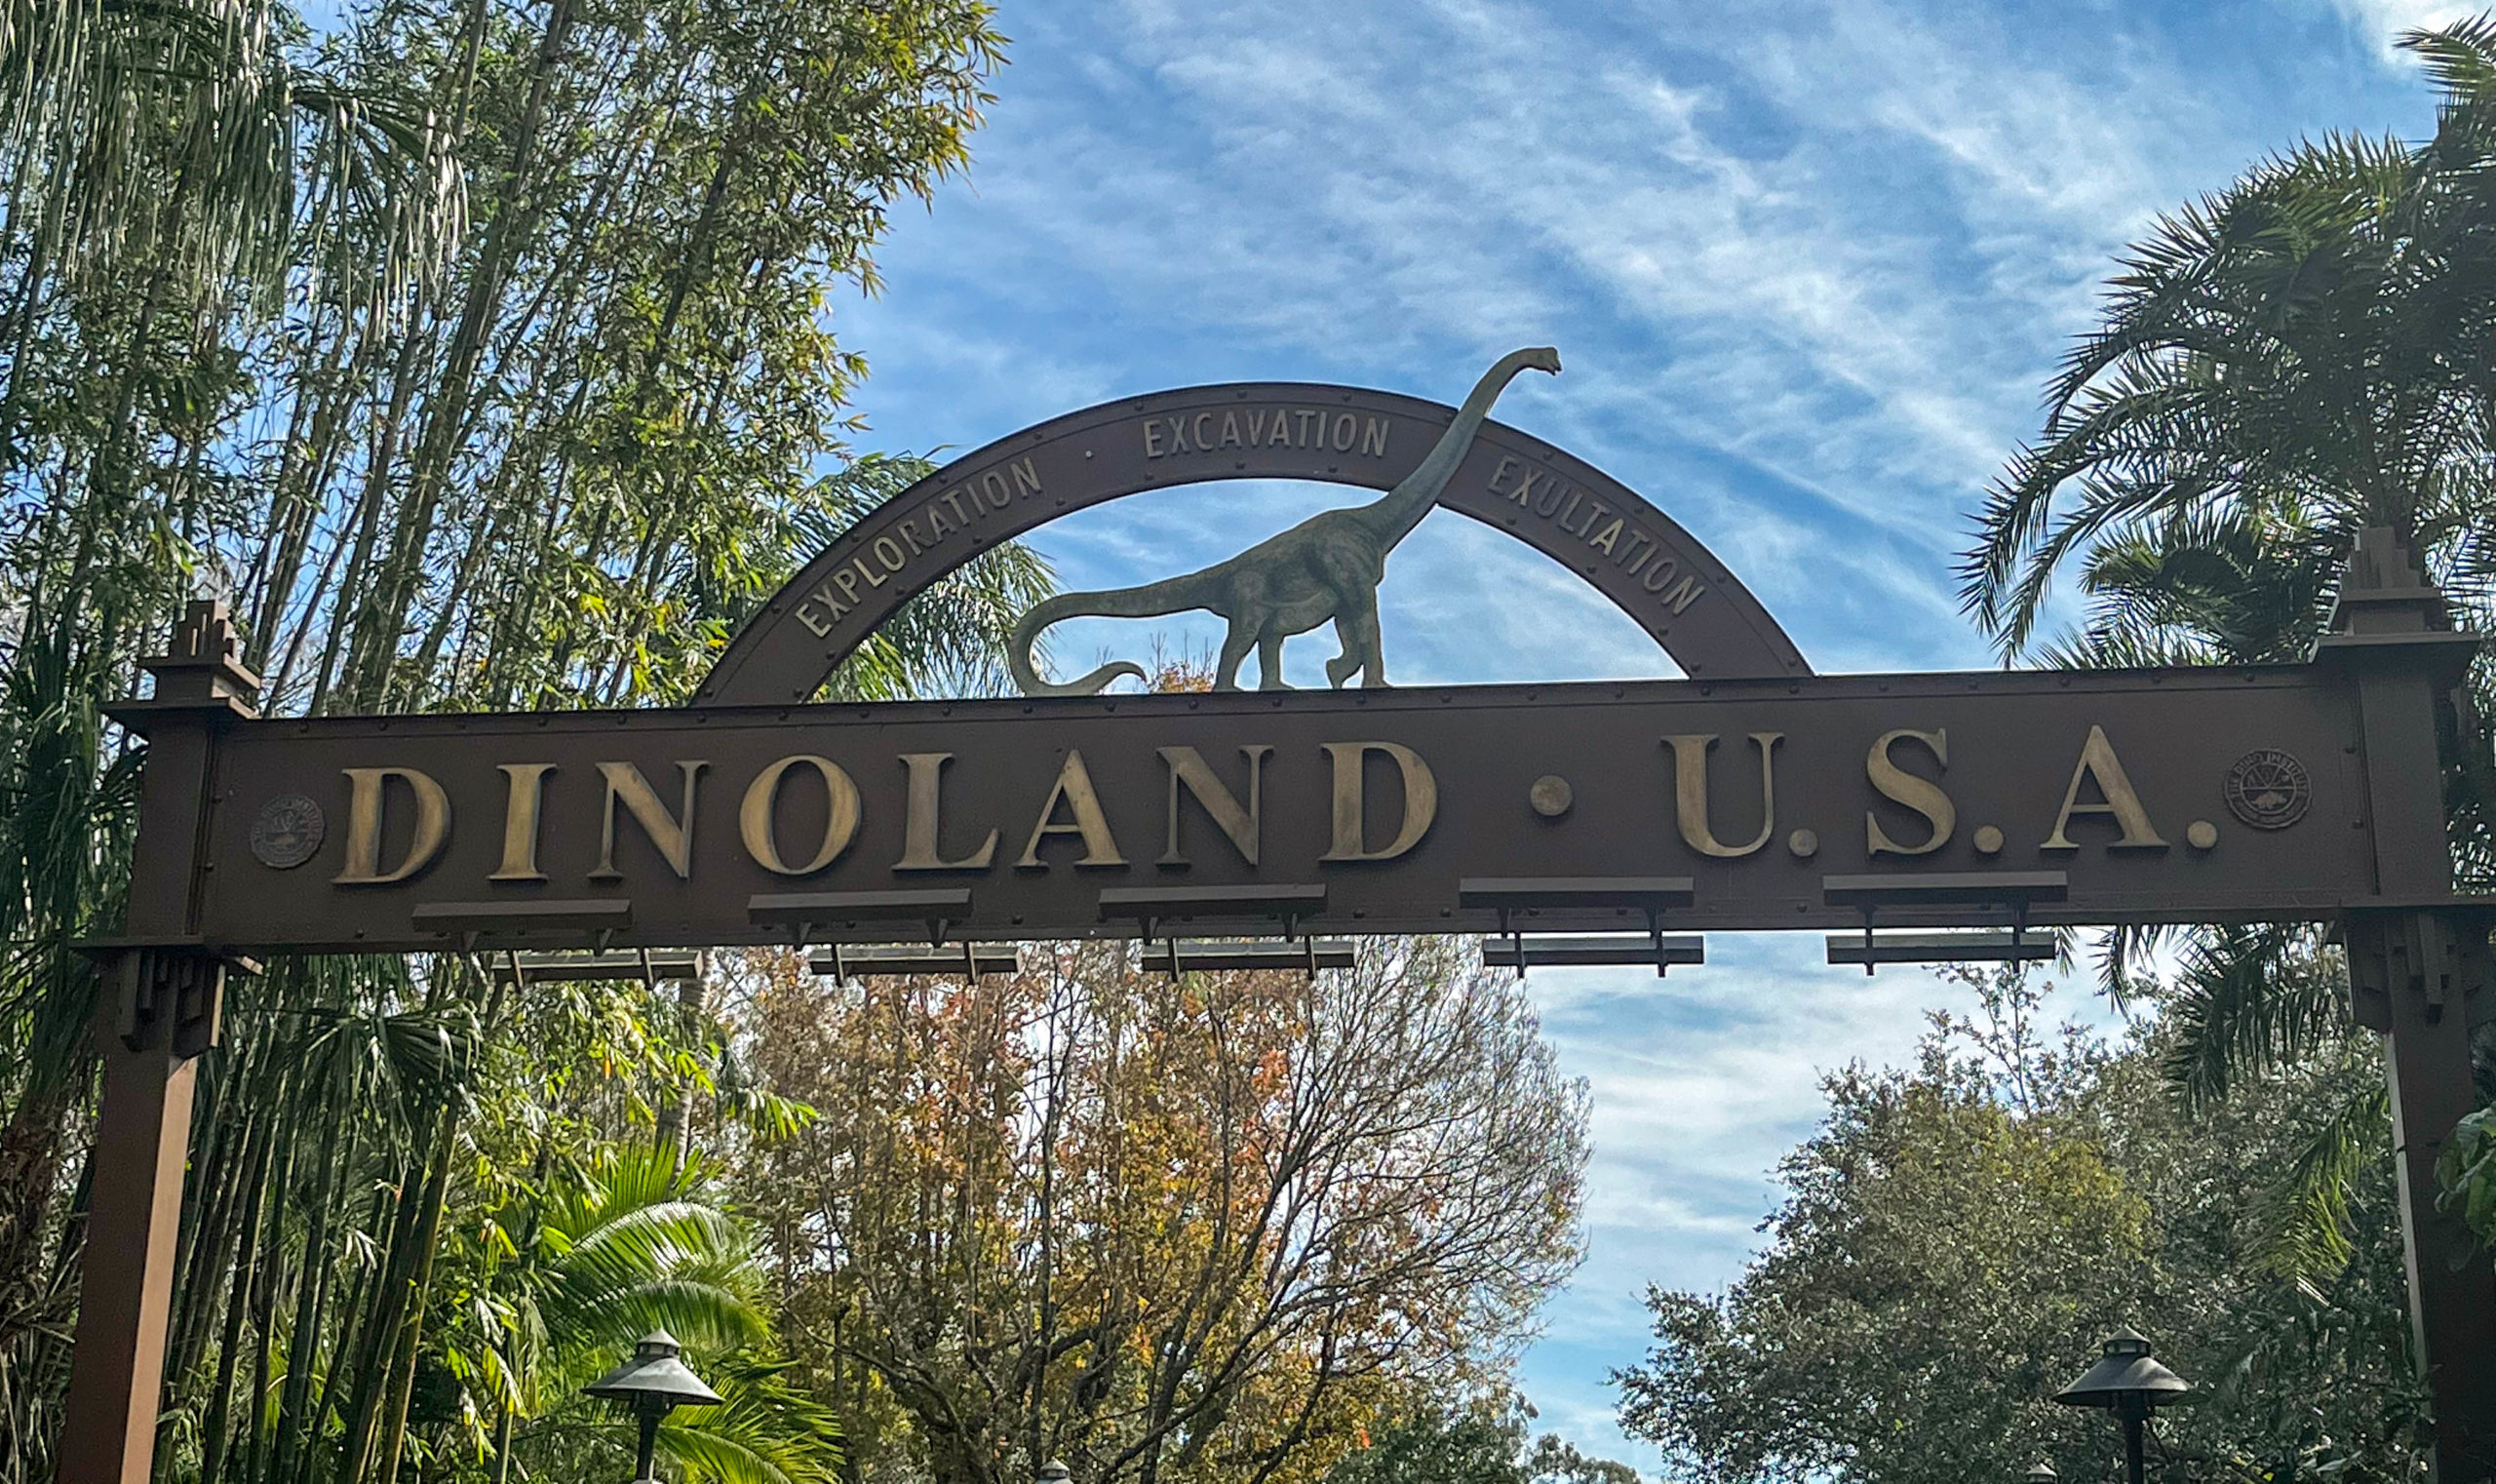
DinoLand USA
Overall, Animal Kingdom guests stood in line for an average of 30 minutes last week, which is four minutes more than the previous week.
That statement may confuse you since A) we’re in September and B) the previous week included the Labor Day holiday.
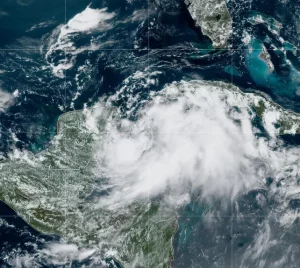
Credit: NOAA via The New York Times
The explanation is that Disney faced Hurricane Idalia the previous week. So, yeah, that was a pretty big factor.
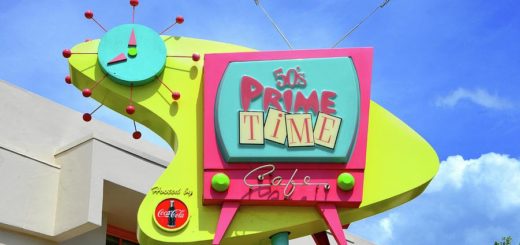
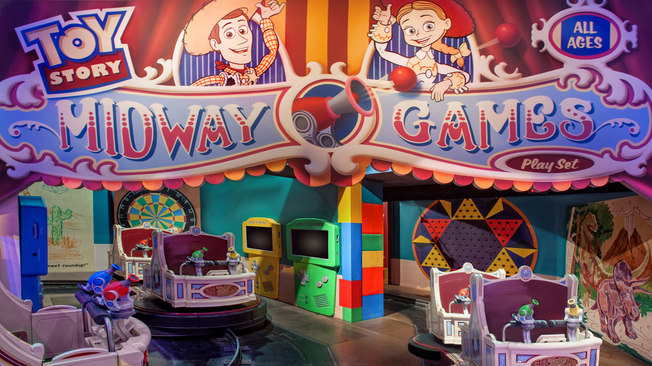
Disney’s Hollywood Studios

Photo: ScreenCrush
With such extreme weather in the area, theme park fans stayed away from the parks during the end of August and the start of September.
For this reason, it’s safe to expect wait times to increase across the board this week.
Is that what happened at Hollywood Studios? Let’s check:
- Slinky Dog Dash – 79 minutes, up 11
- Star Wars: Rise of the Resistance – 57 minutes, up 3
- Mickey & Minnie’s Runaway Railway – 53 minutes, up 4
- Rock ‘n’ Roller Coaster Starring Aerosmith – 49 minutes, down 6
- Toy Story Mania! – 46 minutes, up 5
- Twilight Zone Tower of Terror – 40 minutes, up 2
- Millennium Falcon: Smugglers Run – 38 minutes, down 2
- Red Carpet Dreams – 37 minutes, up 4
- Alien Swirling Saucers – 23 minutes, up 1
- Lightning McQueen’s Racing Academy – 18 minutes, up 3
- Celebrity Spotlight – 14 minutes, up 1
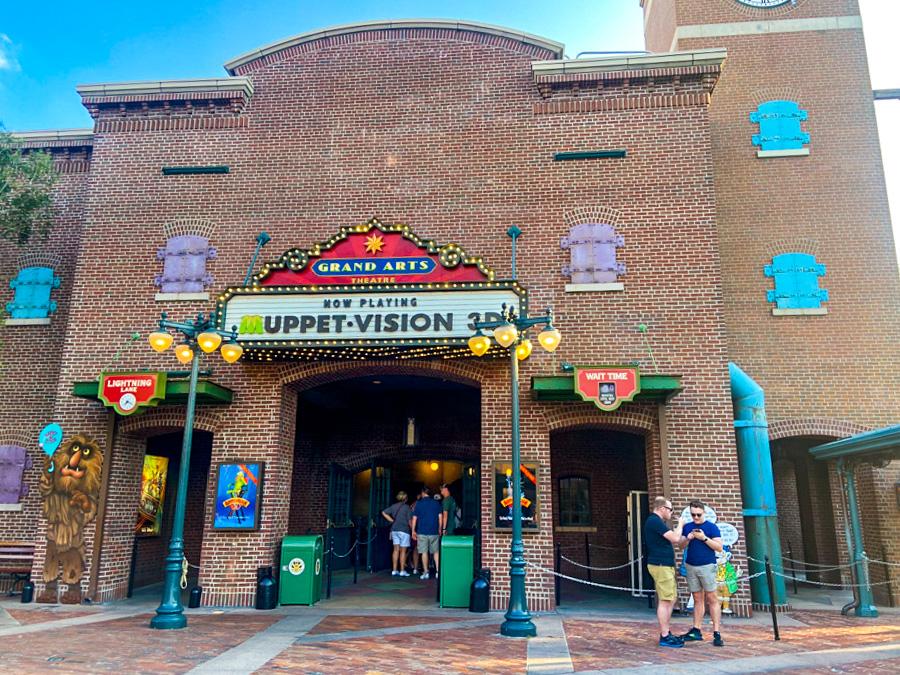
- Muppet*Vision 3D – 10 minutes, no change
- Star Tours – The Adventures Continue – 10 minutes, down 10
Overall, Hollywood Studios attractions required an average wait of 34 minutes, which is just one minute more than last time.
So, the competing factors of September this week vs. a hurricane last week mostly canceled out one another.
Hollywood Studios still only had one attraction with an hourlong wait and only five over 45 minutes, which is grrrreat for this park!
EPCOT

Photo: Disney
At EPCOT, we just learned that Test Track will undergo a modest redesign soon.
When that happens, EPCOT’s attractions will experience a ripple effect caused by the fact that one of the most popular rides here is offline.
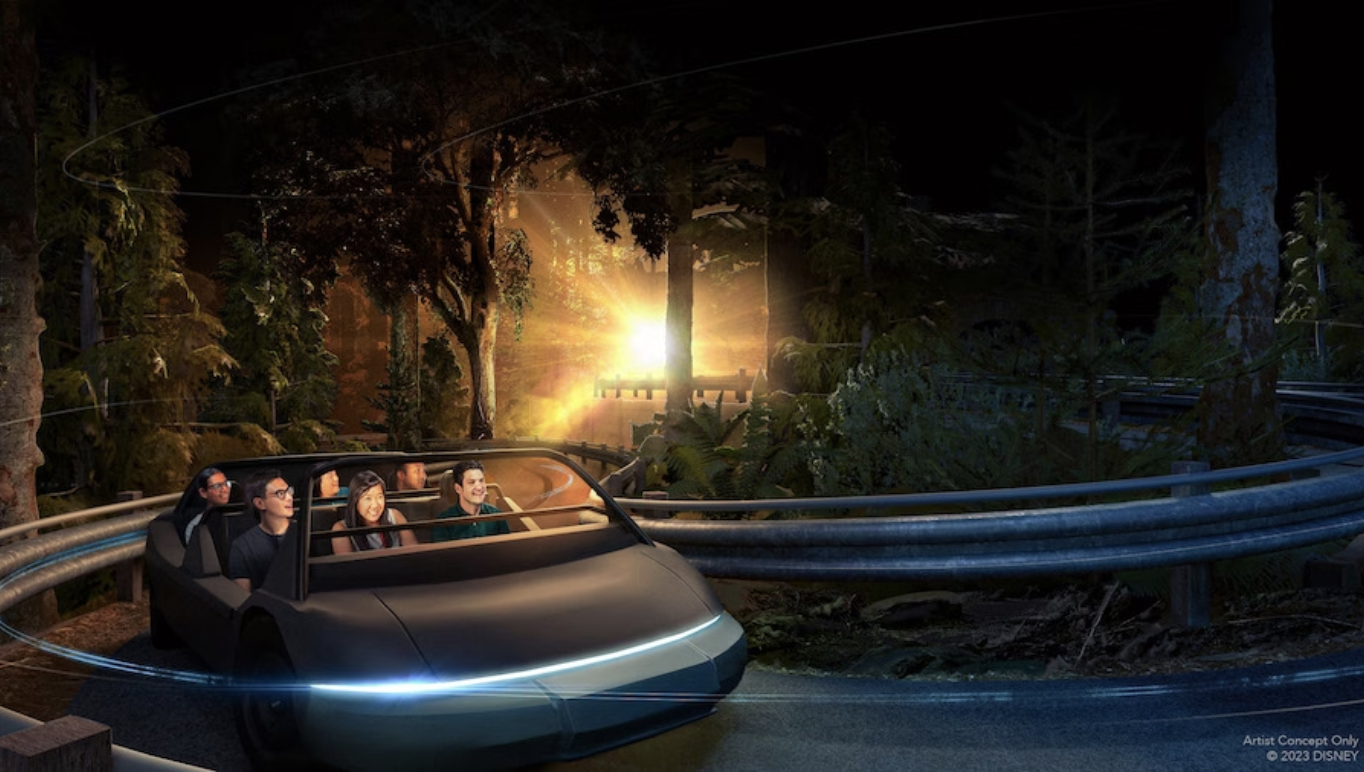
Photo: Disney
For the time being, EPCOT’s crowd behavior is quite predictable, though. Here are last week’s average waits:
- Frozen Ever After – 68 minutes, up 10
- Remy’s Ratatouille Adventure – 54 minutes, up 8
- Test Track – 48 minutes, down 7
- Royal Sommerhus – 29 minutes, up 2
- Soarin’ Around the World – 28 minutes, up 5
- Turtle Talk with Crush – 18 minutes, no change
- Mission: SPACE – 16 minutes, up 3
- Spaceship Earth – 13 minutes, up 2
- Journey into Imagination with Figment – 12 minutes, up 1
- The Seas with Nemo & Friends – 12 minutes, up 2
- Living with the Land – 11 minutes, up 2
- Gran Fiesta Tour Starring the Three Caballeros – 10 minutes, up 2
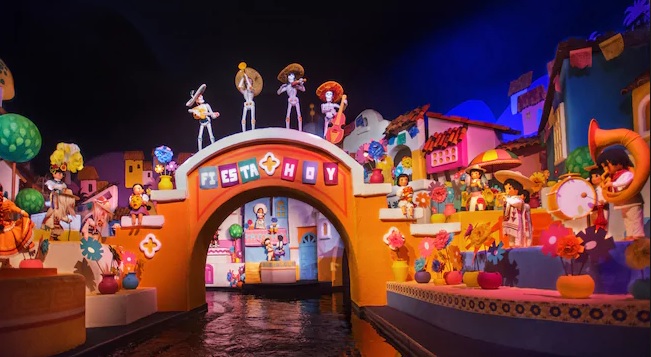
Image: Disney
Overall, EPCOT attractions averaged a wait of 26 minutes each. That’s only one minute more than last time.
Again, we’re witnessing two strange park phenomena neutralizing one another.
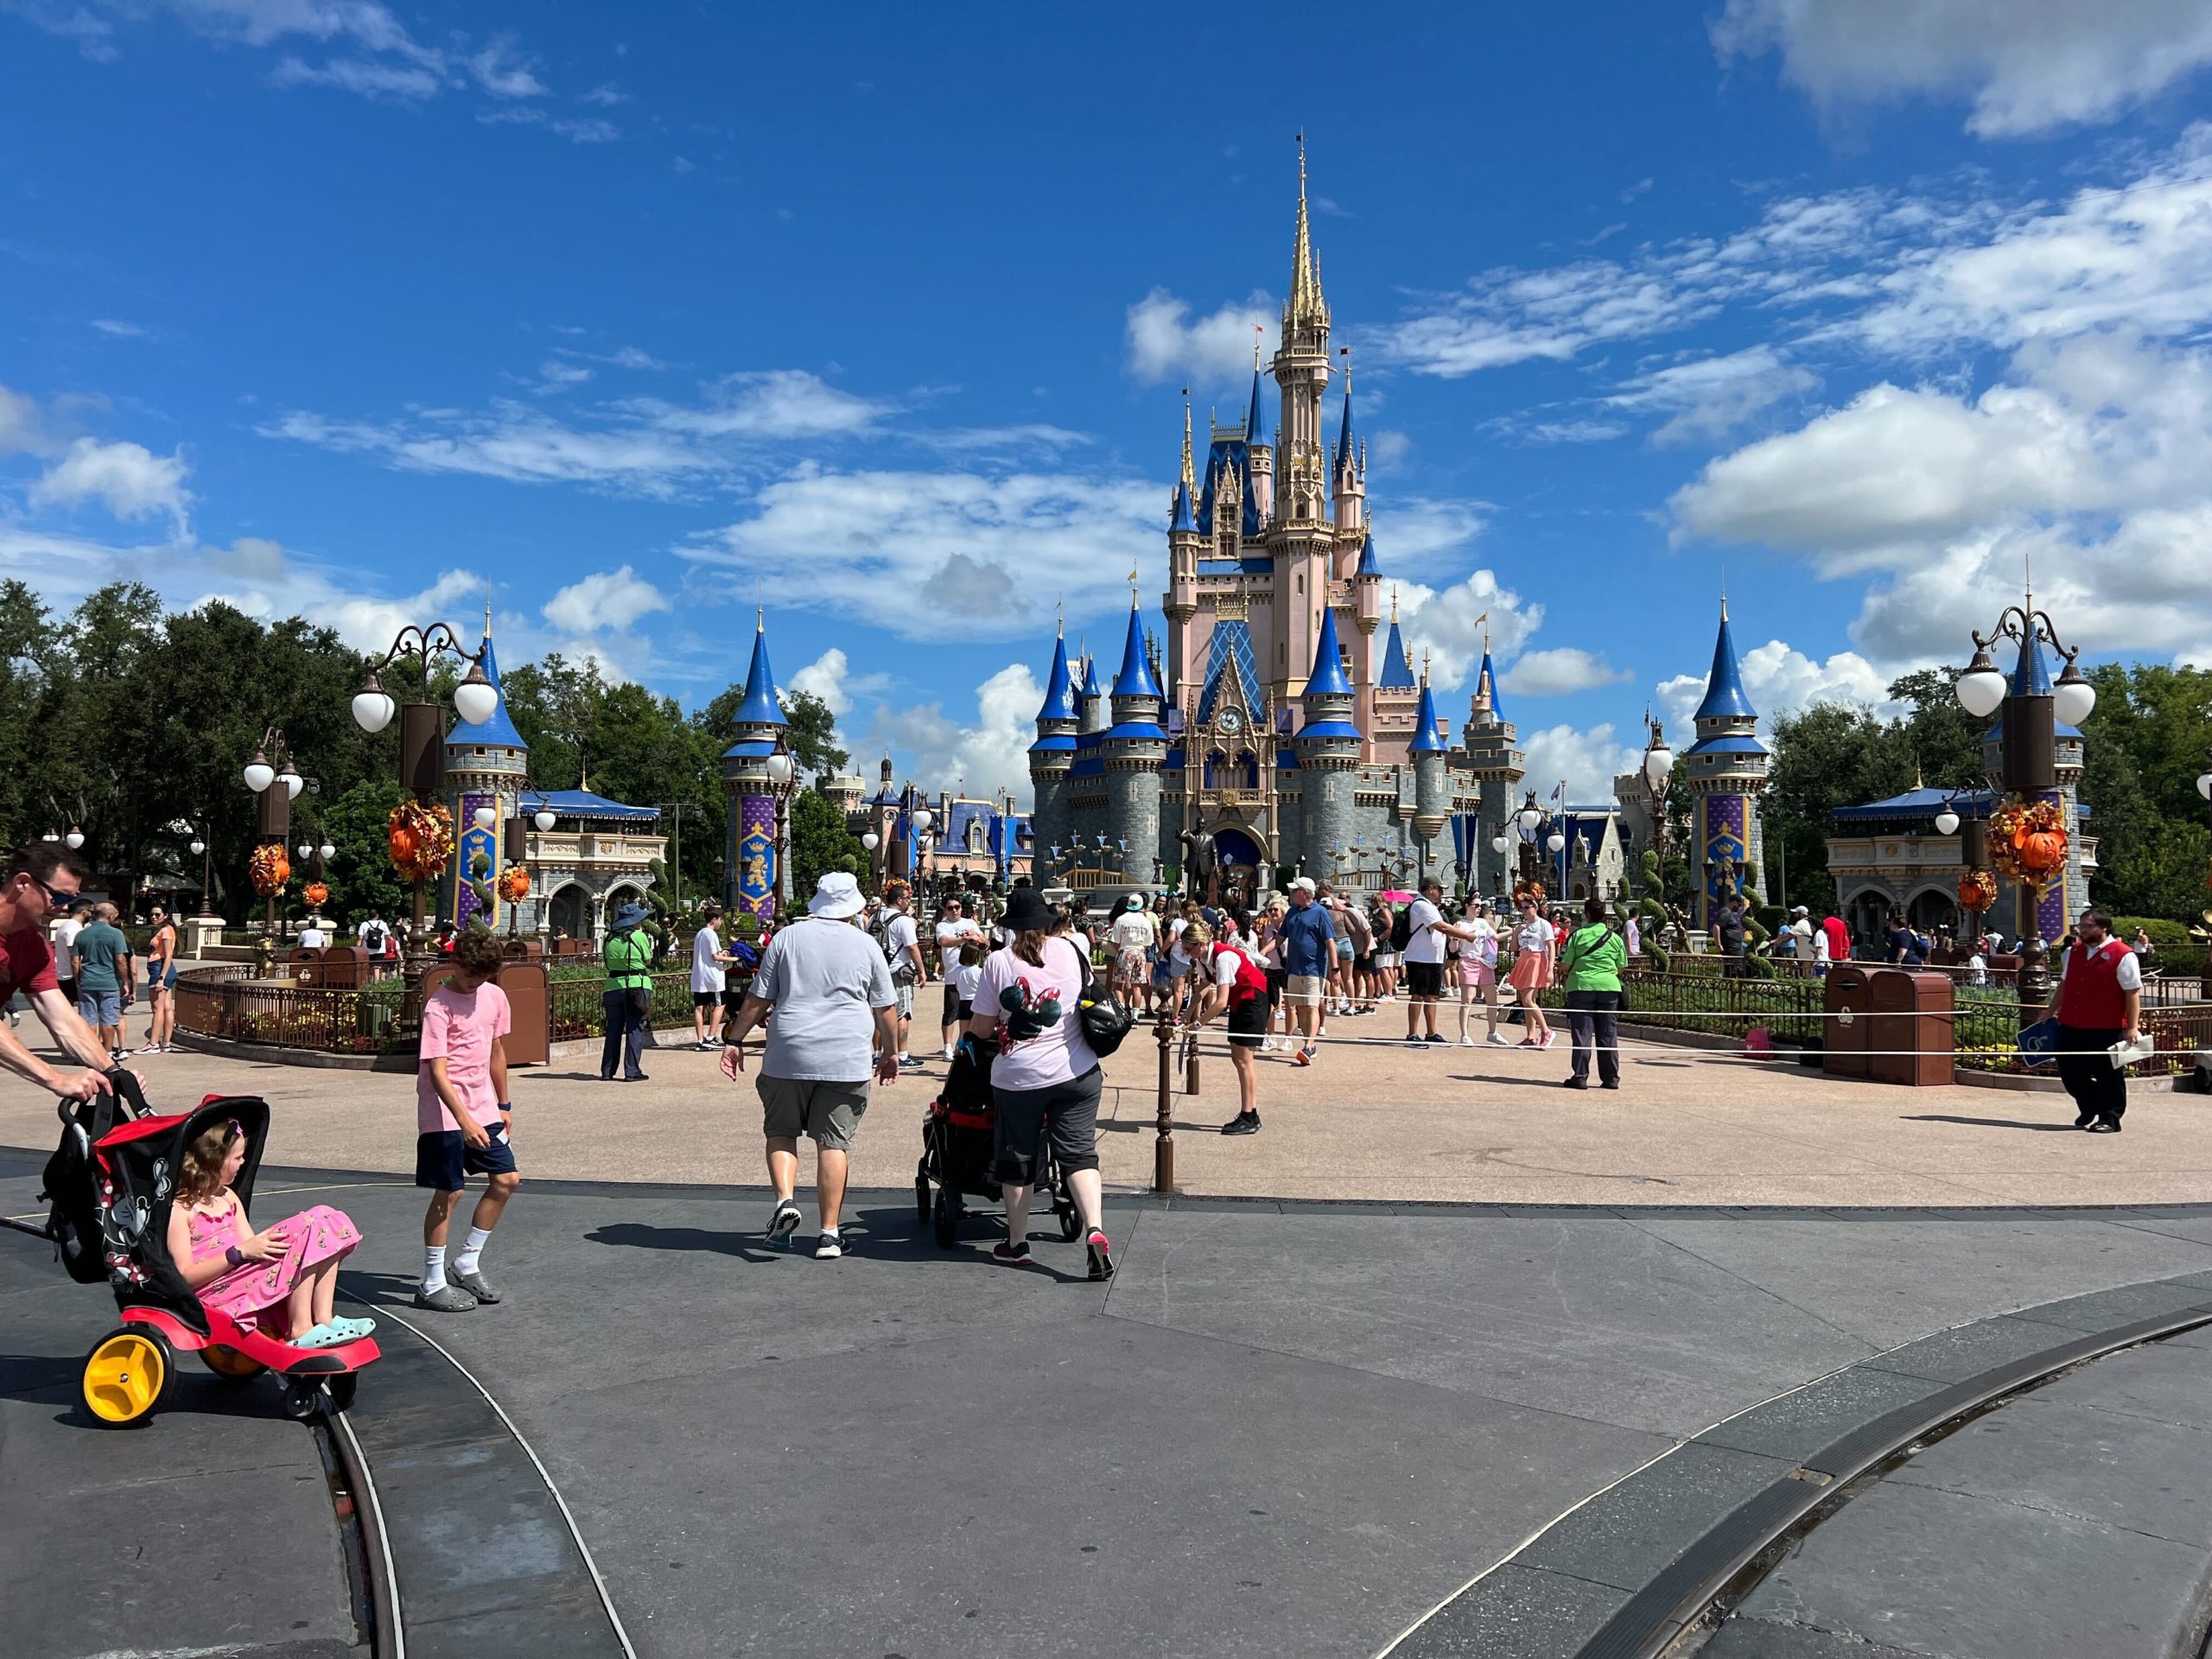
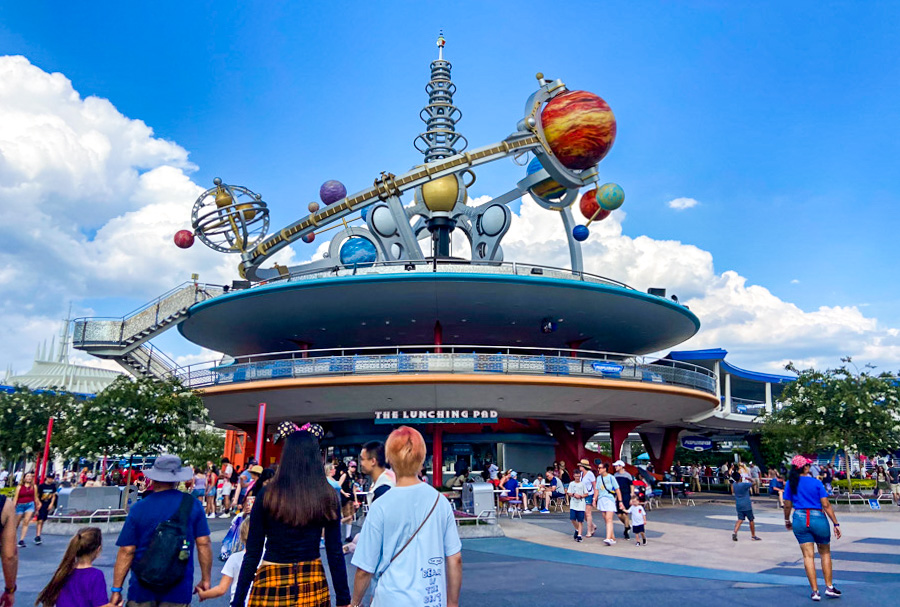
Magic Kingdom

Photo: Disney
Finally, we have the most popular theme park on the planet, and it’s a place Disney suggests will get even better soon.
Until then, here are the average wait times at Magic Kingdom last week:
- Seven Dwarfs Mine Train – 64 minutes, up 1
- Peter Pan’s Flight – 63 minutes, up 3
- Jungle Cruise – 45 minutes, up 6
- Space Mountain – 40 minutes, up 7
- Haunted Mansion – 38 minutes, up 4
- Princess Fairytale Hall – 37 minutes, up 3
- Ariel’s Grotto – 35 minutes, up 2
- Pete’s Silly Sideshow – 32 minutes, up 4
- Town Square Theater – 32 minutes, no change
- The Many Adventures of Winnie the Pooh – 31 minutes, up 2
- Pirates of the Caribbean – 30 minutes, up 11
- Buzz Lightyear’s Space Ranger Spin – 28 minutes, up 4
- Big Thunder Mountain Railroad – 27 minutes, up 6
- Astro Orbiter – 25 minutes, no change
- Enchanted Tales with Belle – 23 minutes, no change
- Monsters, Inc. Laugh Floor – 18 minutes, up 6
- Tomorrowland Speedway – 18 minutes, down 4
- Under the Sea ~ Journey of the Little Mermaid – 18 minutes, up 5
- Mickey’s PhilharMagic – 17 minutes, up 2
- Walt Disney World Railroad – 17 minutes, up 4
- It’s a Small World – 16 minutes, up 2
- The Barnstormer – 15 minutes, no change
- Tomorrowland Transit Authority PeopleMover – 13 minutes, up 2
- The Magic Carpets of Aladdin – 12 minutes, no change
- Dumbo the Flying Elephant – 11 minutes, up 1
- Mad Tea Party – 10 minutes, no change
- Prince Charming Regal Carrousel – 9 minutes, no change
- Country Bear Jamboree – 5 minutes, no change
- Walt Disney’s Carousel of Progress – 5 minutes, no change
Final Thoughts
Photo: Disney
Guests at Magic Kingdom this past week stood in line for an average of 24 minutes, which is one minute more than the previous week.
Overall, all four theme parks’ attractions averaged slightly longer wait times from Labor Day Week.
Only two attractions indicated smaller wait times than the holiday week.
That’s the impact of a hurricane on Disney crowds right there. It’s easily quantified and shows up in the data for the first ten days of September.
Photo: MickeyBlog
Thanks for visiting MickeyBlog.com! Want to go to Disney? For a FREE quote on your next Disney vacation, please fill out the form below, and one of the agents from MickeyTravels, a Diamond Level Authorized Disney Vacation Planner, will be in touch soon!
Feature Photo: Disney