Walt Disney World Wait Times for Late July 2023
Whenever MickeyBlog publishes a park crowds post, you know something is happening.
We’ve noticed either unusually large or small crowds and want to highlight what’s happening in real-time so that you can hopefully take advantage.
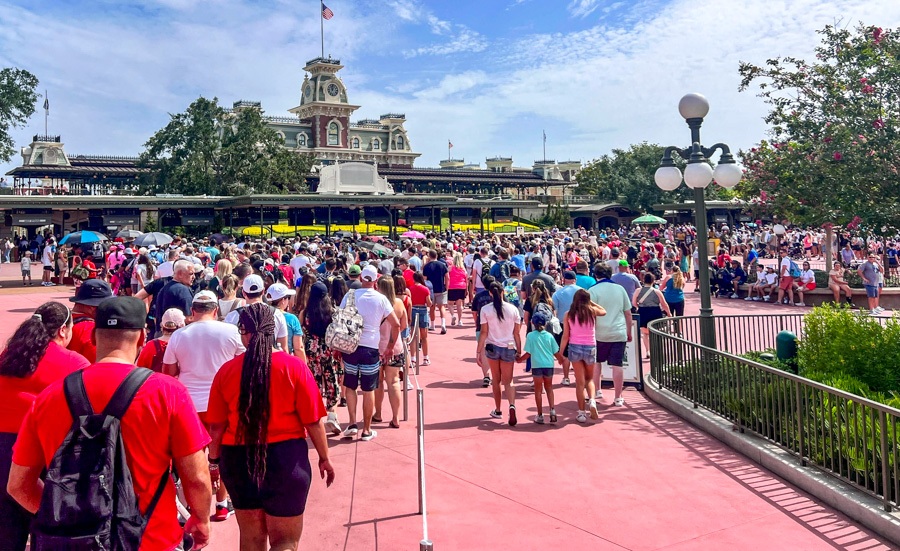
This past week, our park crowds post signaled massive volumes of people at Magic Kingdom.
Did all the parks share the same behavior, or was this a one-off on a single day?
We’ll find out in the latest Walt Disney World Wait Times data. Here’s what we know!
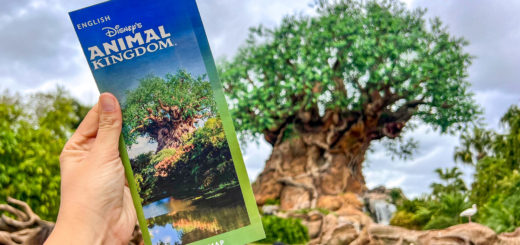
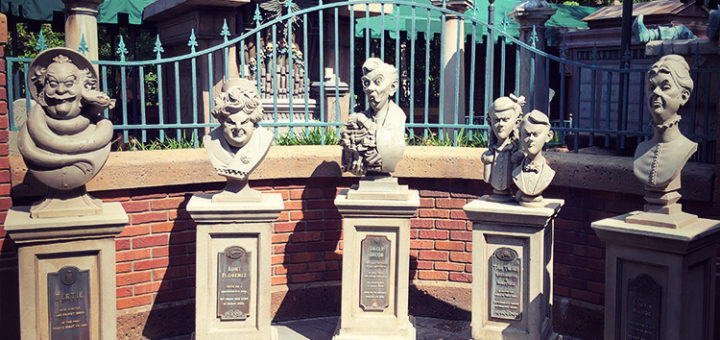
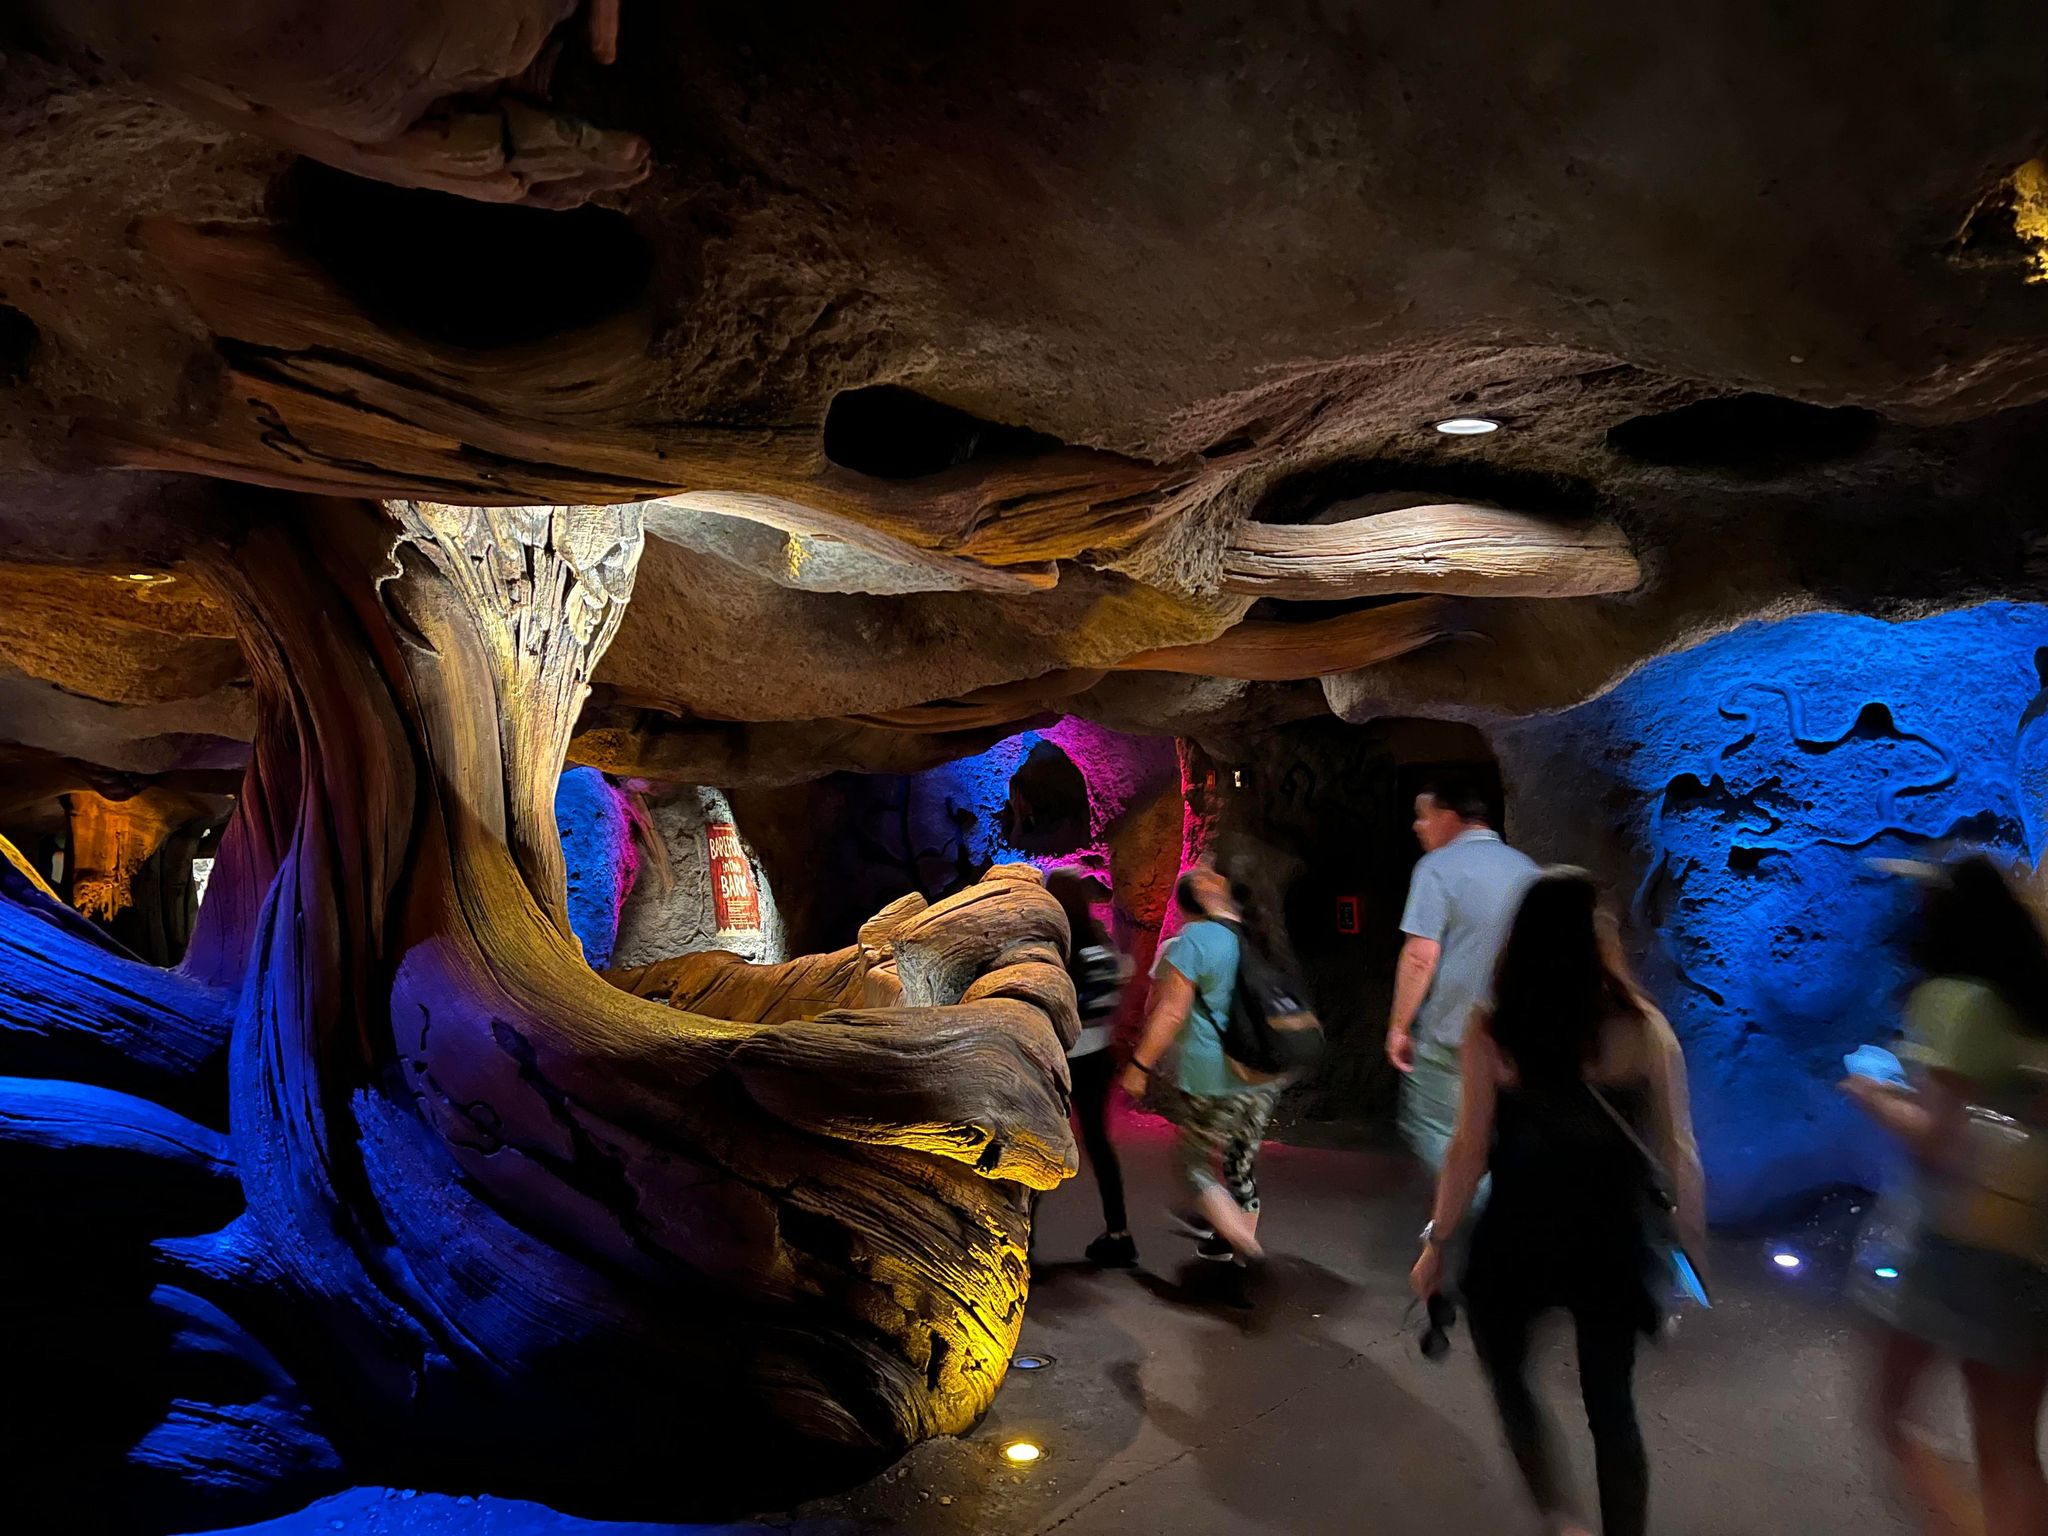
Disney’s Animal Kingdom
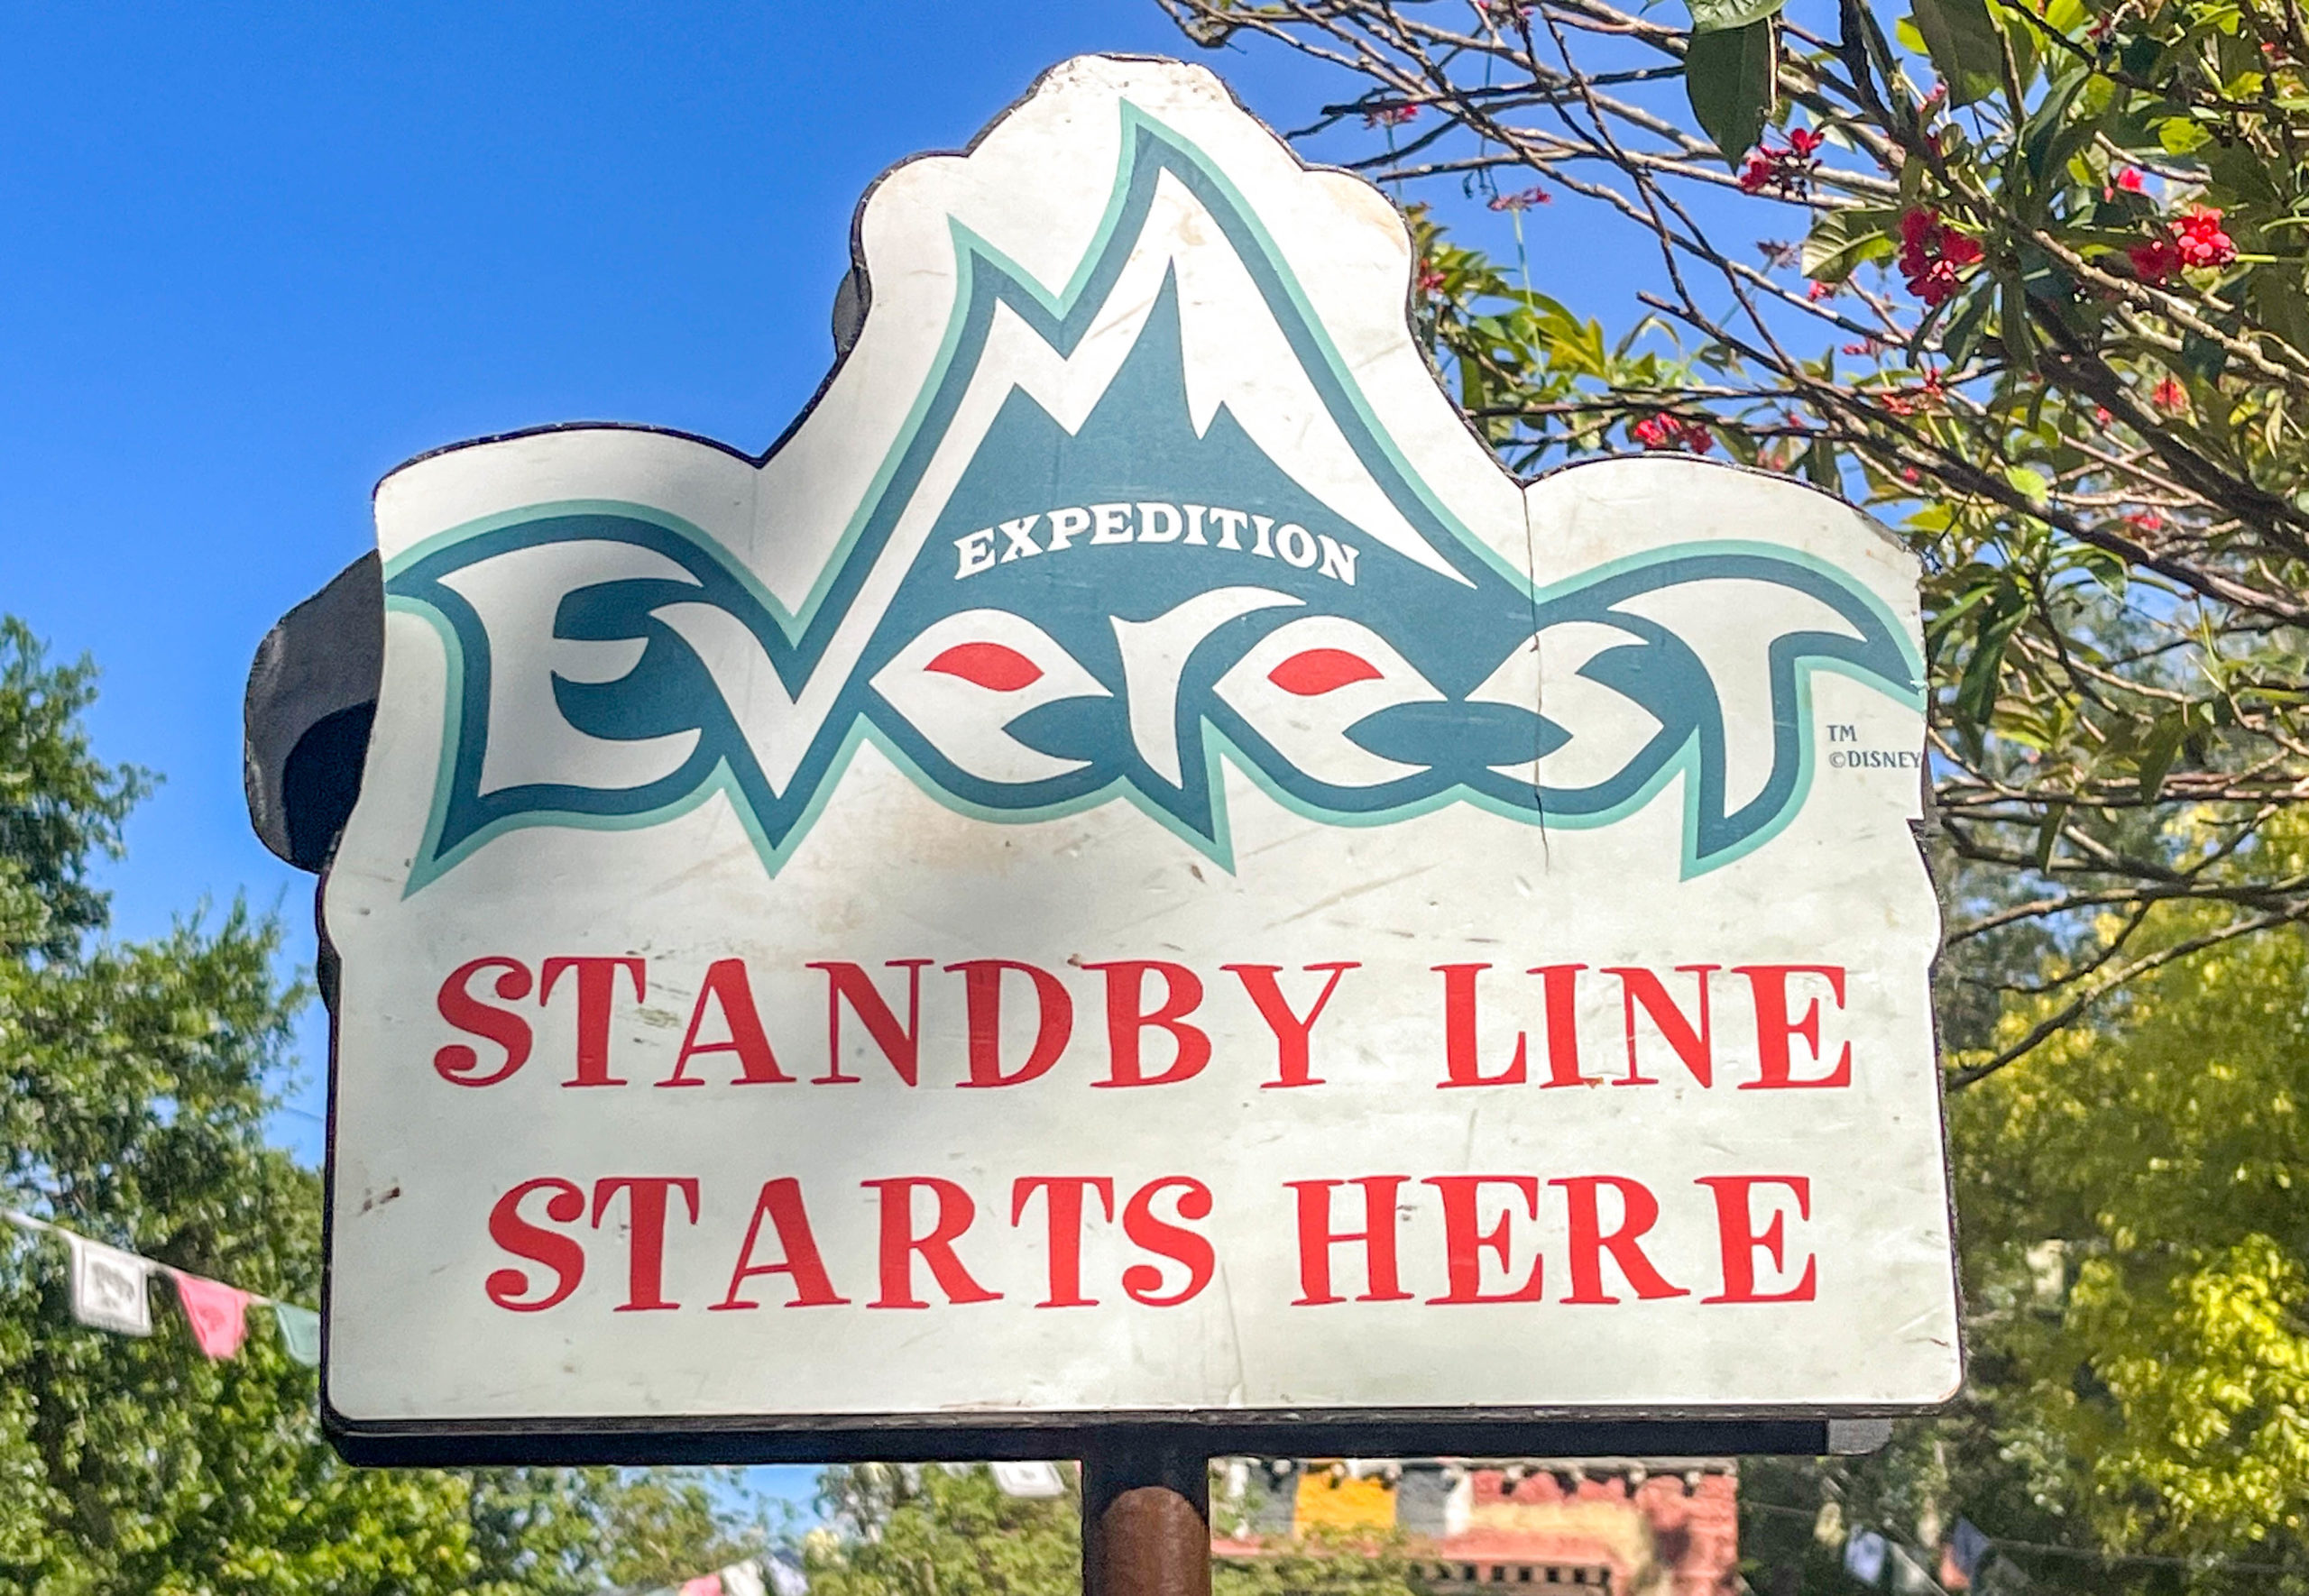
Standby Line
Historically, July has differentiated itself as THE most crowded month at theme parks across North America.
With kids on summer break, families rush to the parks to enjoy some quality time.
July 2023 began with some irregularities at Walt Disney World, primarily due to July 4th falling on a Tuesday and a savage heat wave in the south.
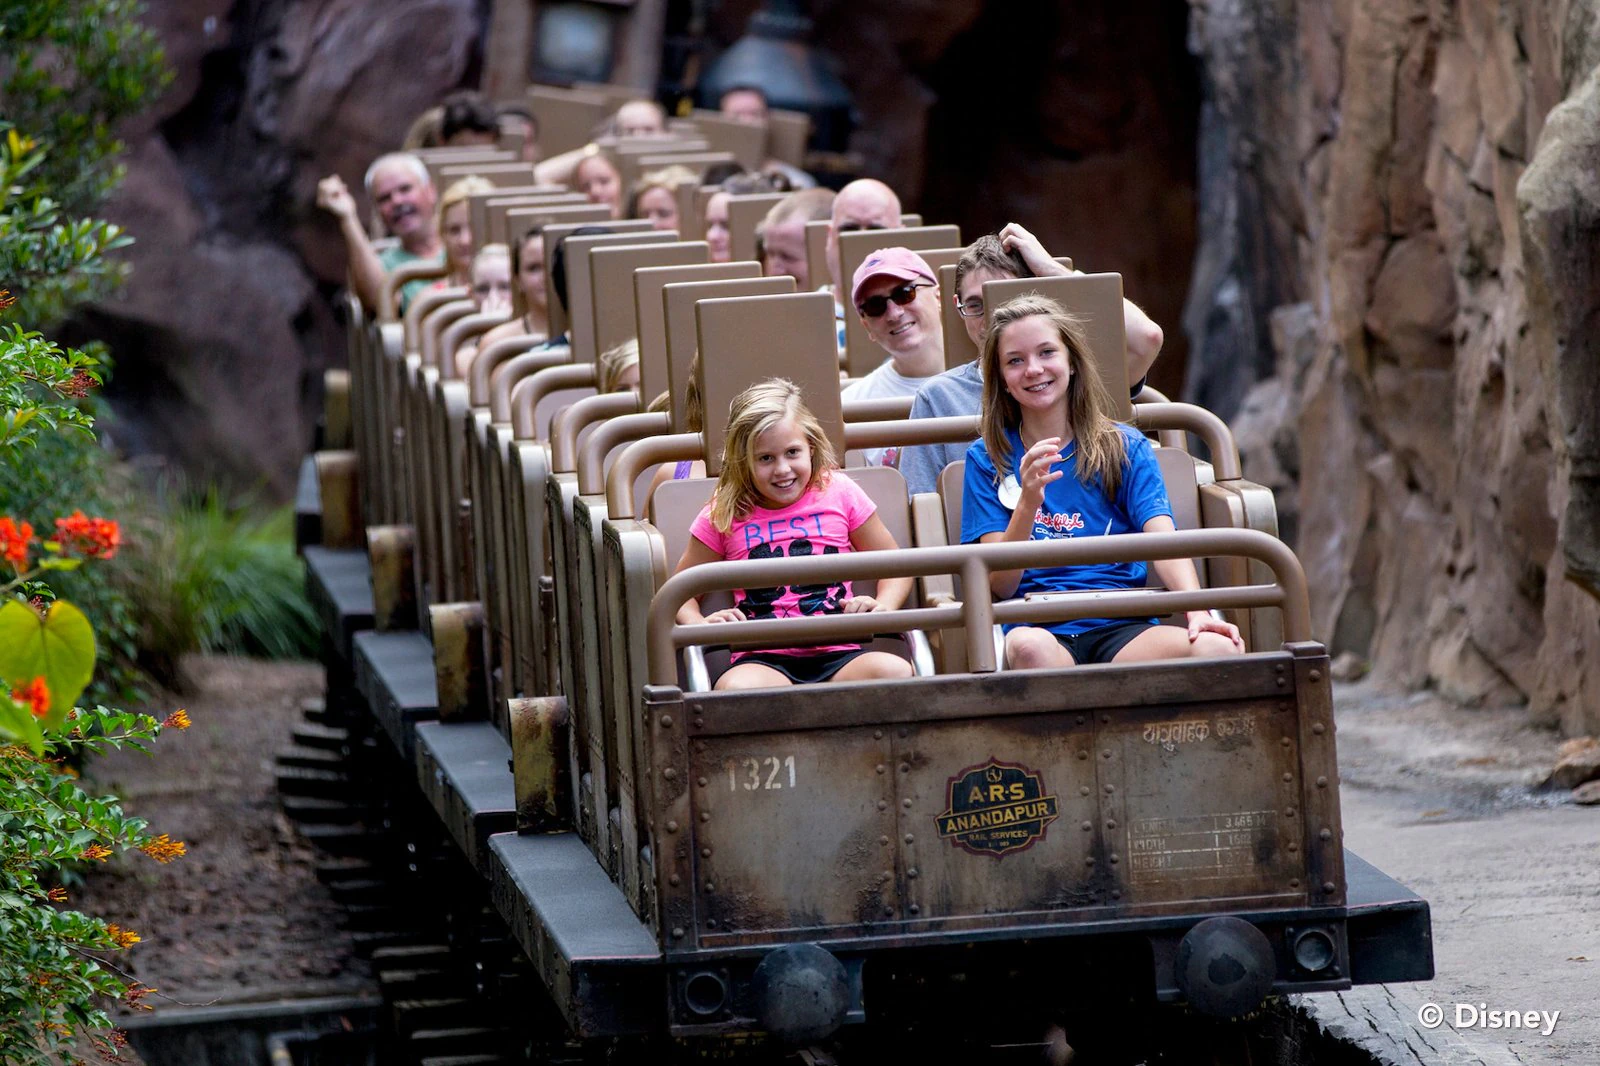
Photo: Disney
Since then, normalcy has returned, with crowds generally increasing each week.
Was that the case at Animal Kingdom over the past seven days? Here are the average wait times for each attraction:
- Avatar Flight of Passage – 111 minutes, up 4
- Na’vi River Journey – 83 minutes, up 2
- Kali River Rapids – 54 minutes, up 4
- Expedition Everest – 46 minutes, up 3
- Adventurers Outpost – 45 minutes, no change
- DINOSAUR – 45 minutes, no change
- Kilimanjaro Safaris – 39 minutes, up 1
- It’s Tough to Be a Bug! – 15 minutes, no change
- TriceraTop Spin – 12 minutes, up 3
So, everything at Animal Kingdom either increased its average wait time from the previous week or remained the same.
Overall, park guests stood in line for an average of 51 minutes, which is two minutes more than during the third week of July.
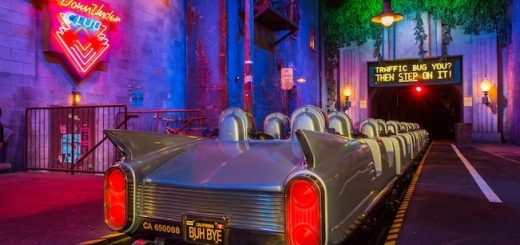
Disney’s Hollywood Studios
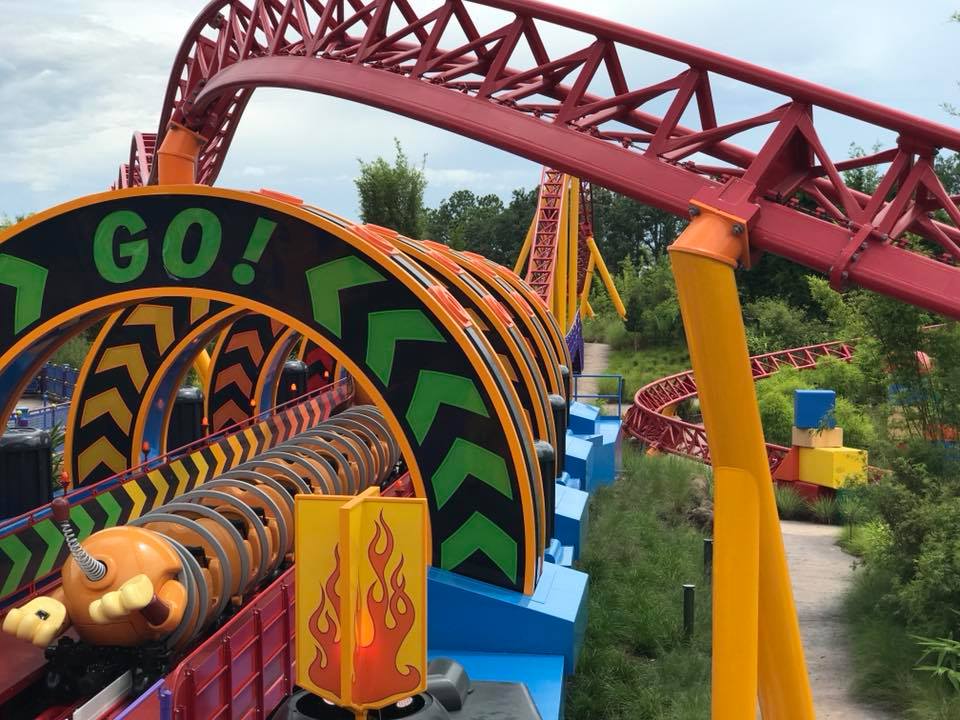
Did Hollywood Studios follow the same trajectory, or did it go off on its own?
Typically, Hollywood Studios doesn’t share the same behavior as the other three parks. Its unique set of E-ticket attractions makes it unpredictable.
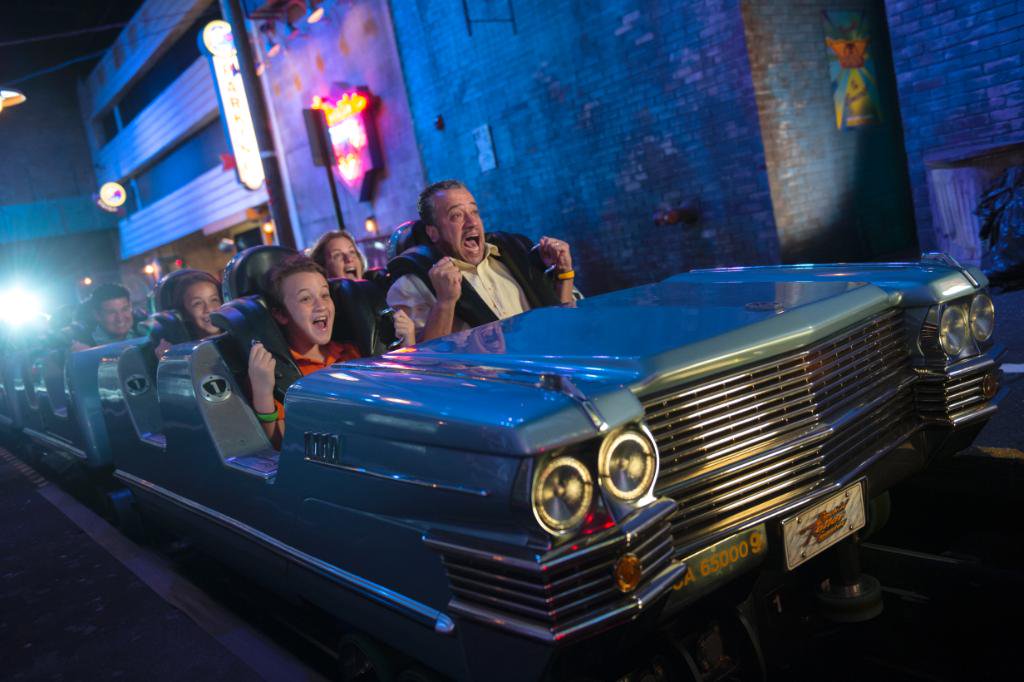
Image: Disney
Here are the park’s average wait times for the last week of July:
- Slinky Dog Dash – 108 minutes, up 15
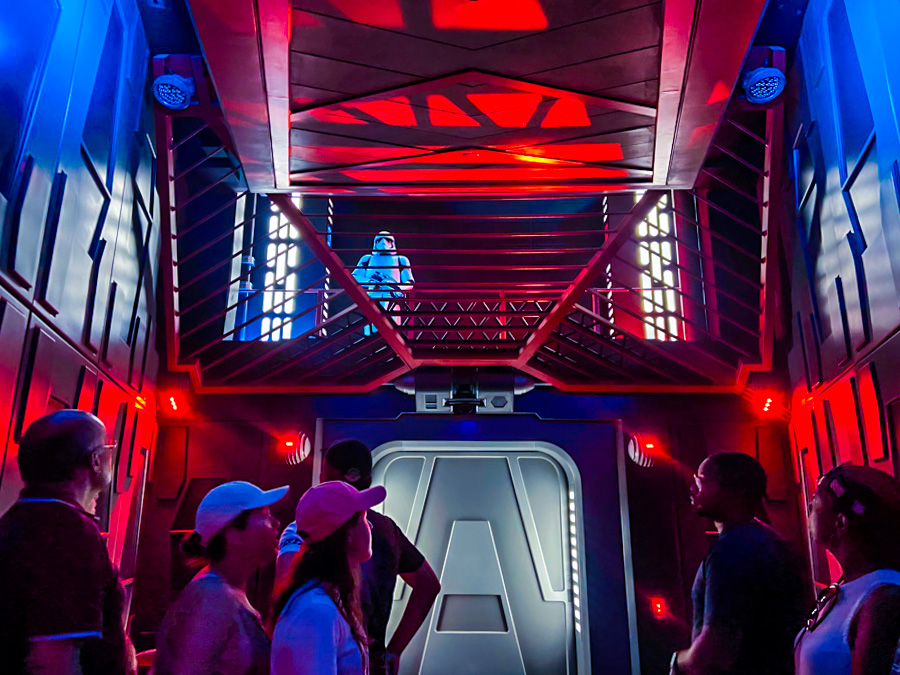
- Star Wars: Rise of the Resistance 95 minutes, up 10
- Rock ‘n’ Roller Coaster Starring Aerosmith – 94 minutes, up 18
- Twilight Zone Tower of Terror – 88 minutes, up 29
- Millennium Falcon: Smugglers Run – 86 minutes, up 5
- Toy Story Mania! – 78 minutes, up 11
- Mickey & Minnie’s Runaway Railway – 73 minutes, up 6
- Red Carpet Dreams – 43 minutes, up 2
- Alien Swirling Saucers – 42 minutes, up 3
- Star Tours – The Adventures Continue! – 26 minutes, up 6
- Celebrity Spotlight – 21 minutes, up 3
- Lightning McQueen’s Racing Academy – 20 minutes, up 5
- Muppet*Vision 3D – 10 minutes, no change
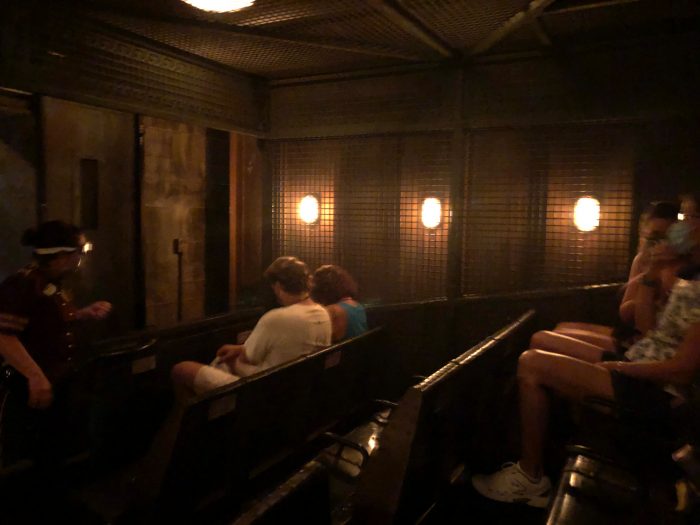
Photo: Touring Plans
Oh, no. Ohnonono.
So, umm, I don’t think you need to know much about the parks to recognize a dramatic change in park crowds at Hollywood Studios last week.
Seven different attractions required a wait of 73 minutes (!) or more.
Rock ‘n’ Roller Coaster almost caught Rise of the Resistance in terms of average wait.
One of these attractions is over in about two minutes, while the other lasts more than 20.
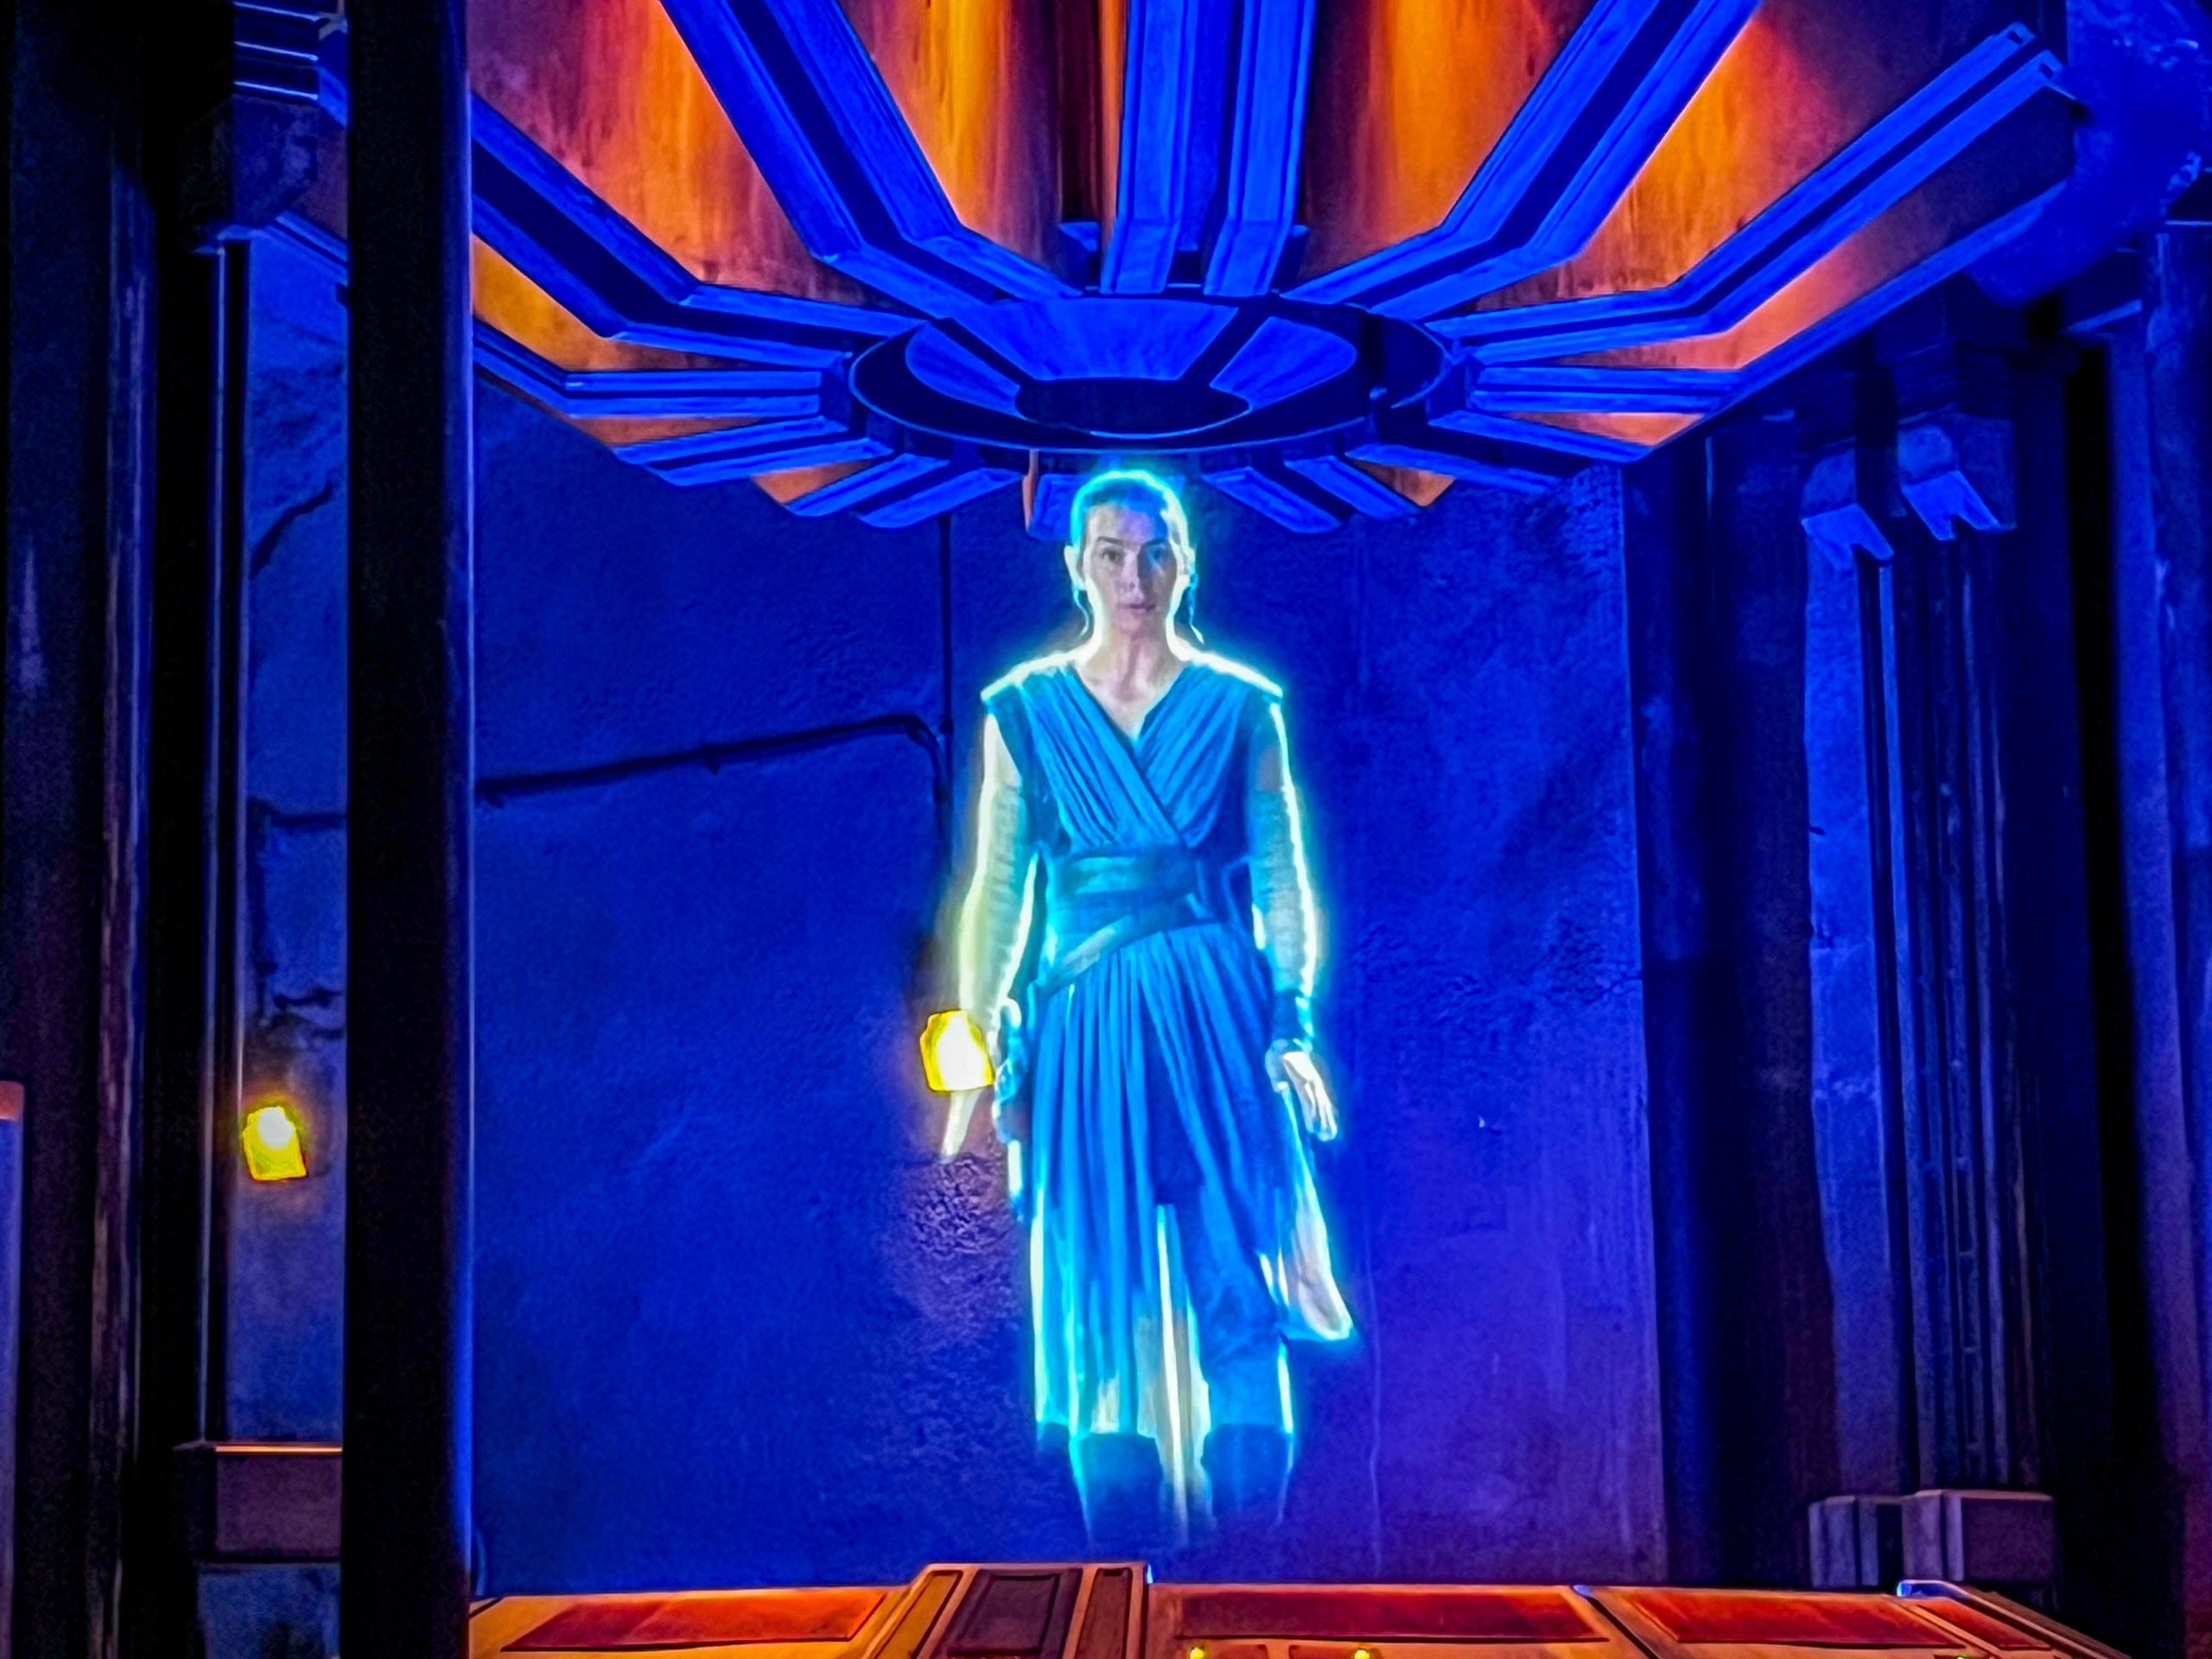
If you’re ever in the park when this happens, for the love of all you hold holy, pick Rise of the Resistance!
Anyway, Hollywood Studios attractions averaged a wait of 55 minutes, which is ten minutes or 22 percent more than the previous week. Yikes!
EPCOT

Now I’m holding my breath because nearly half of EPCOT’s data comes from the opening weekend of the 2023 EPCOT International Food & Wine Festival.
We know that crowds were sizable during this event, as you can tell from several of our festival reports.
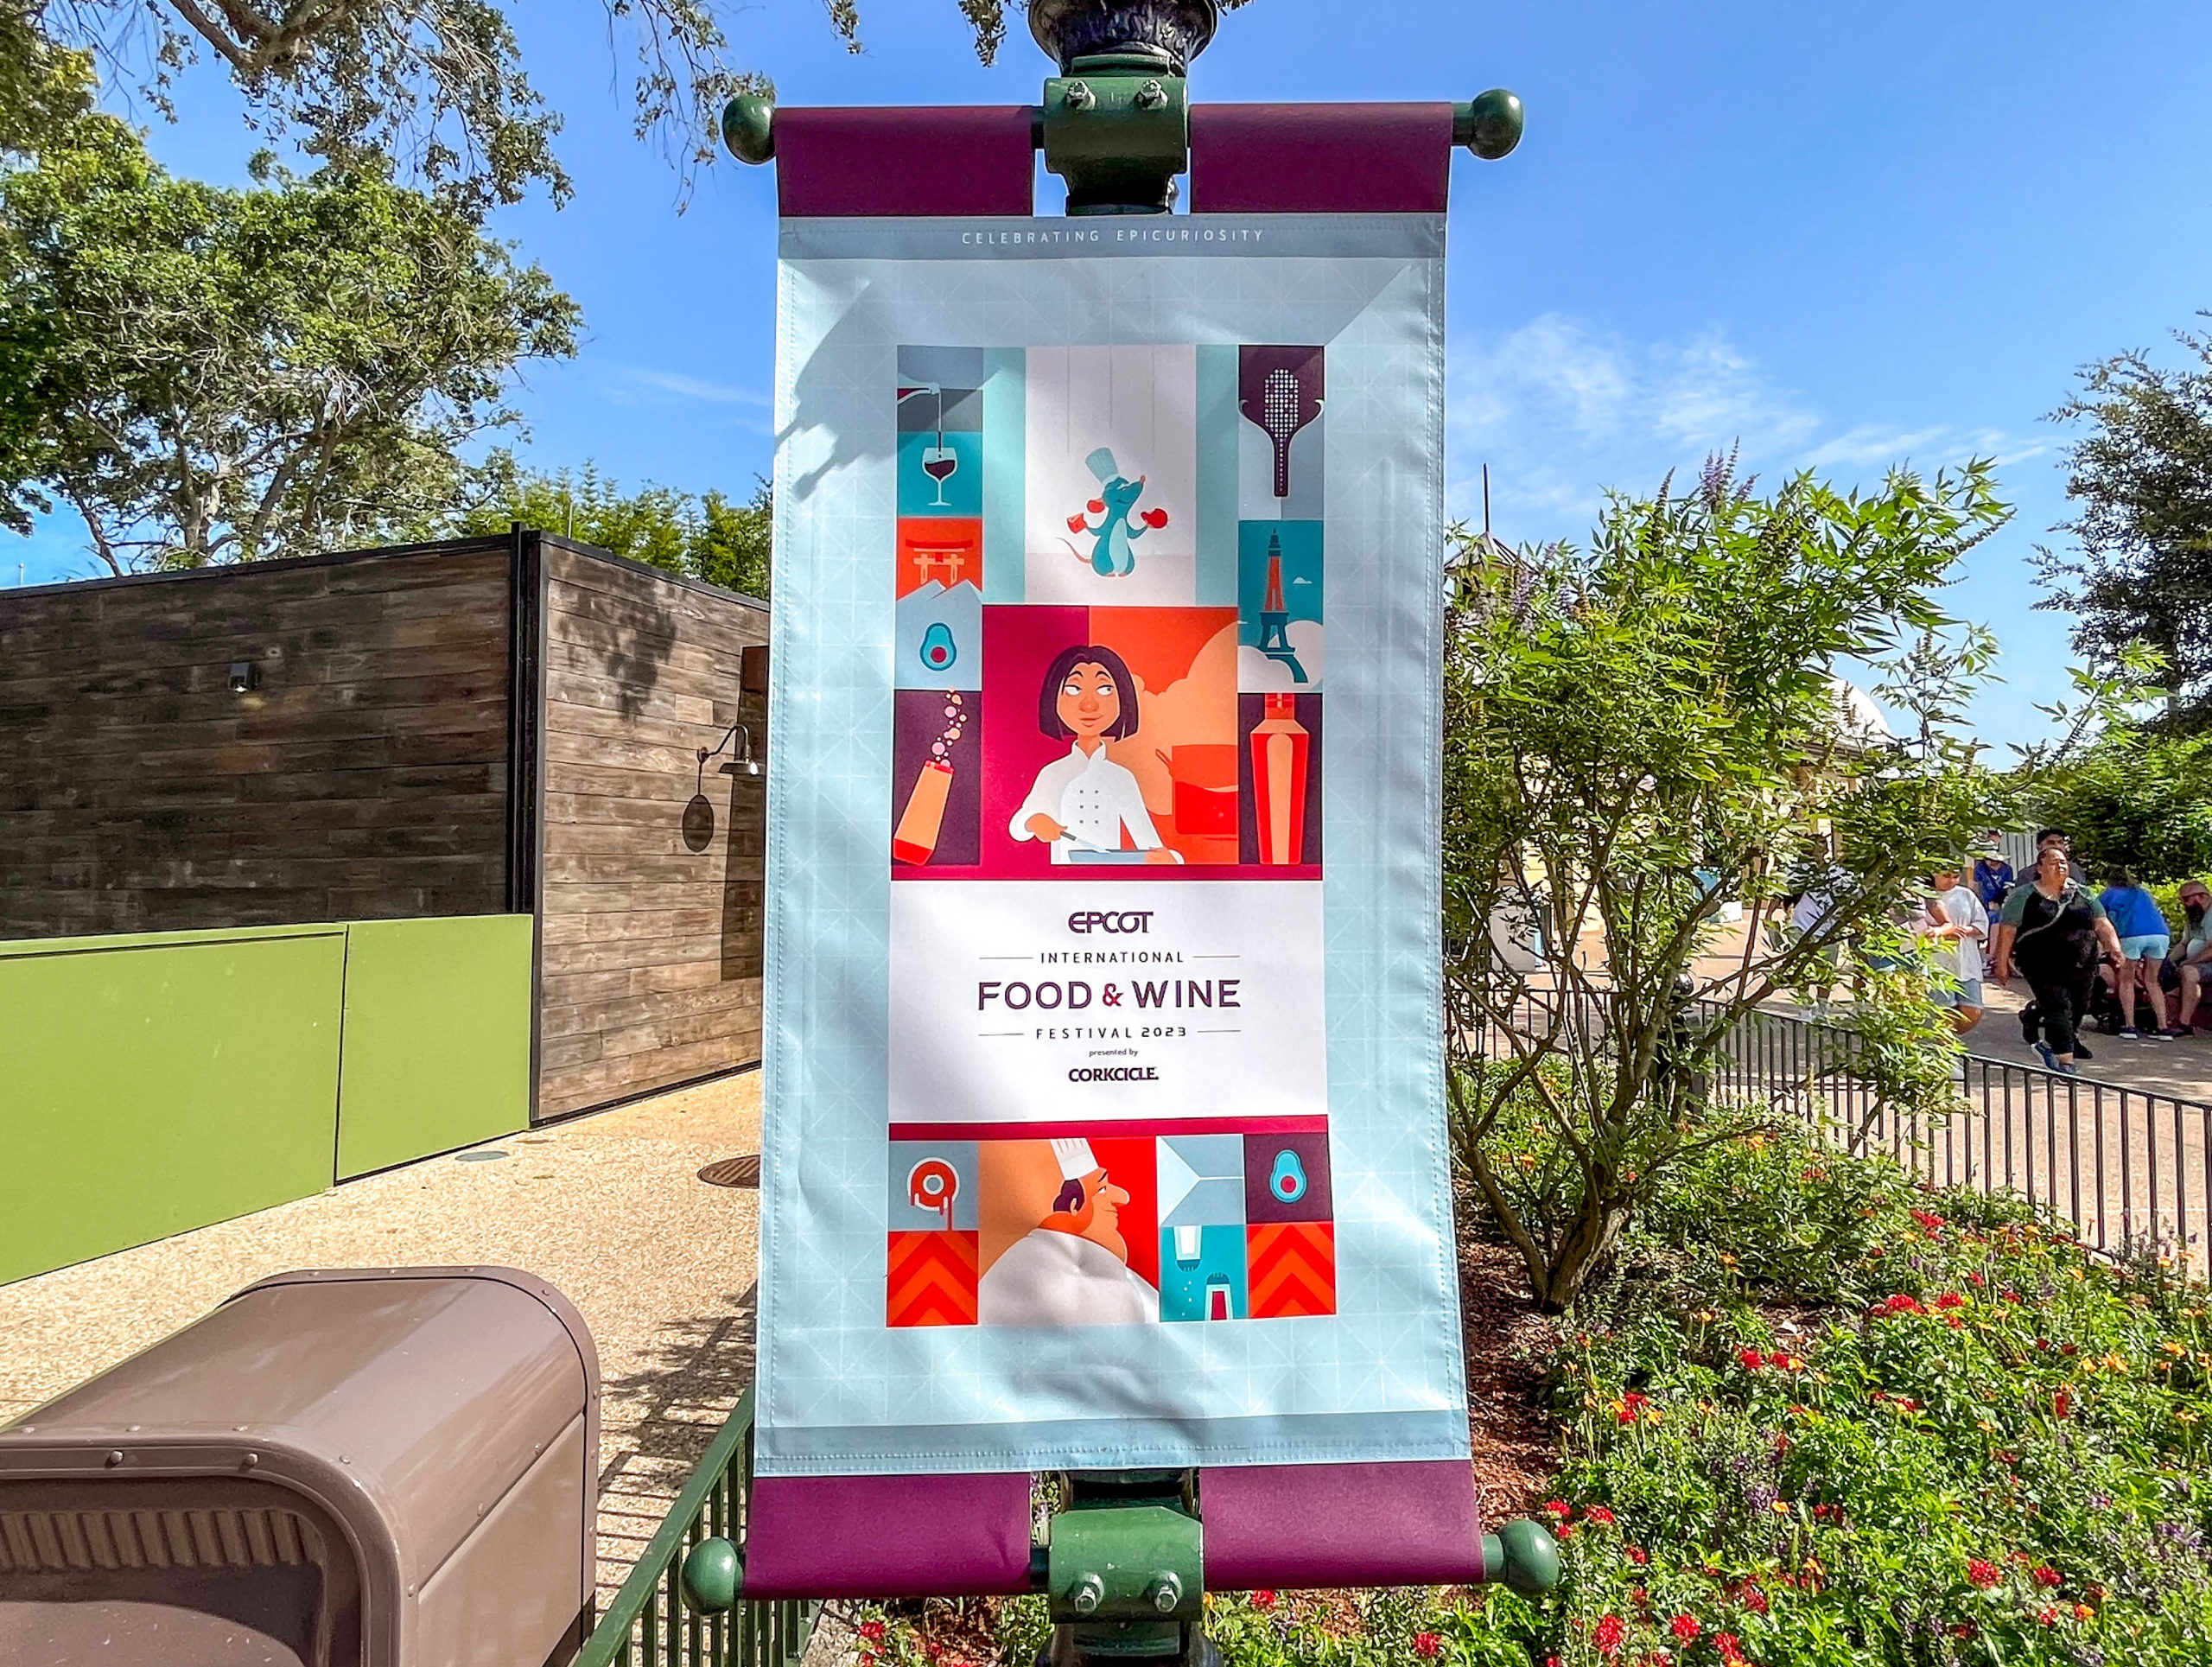
2023 EPCOT Food & Wine Festival
Did that translate to longer average attraction wait times for the week? Here’s the data:
- Frozen Ever After – 76 minutes, up 9
- Test Track – 72 minutes, no change
- Remy’s Ratatouille Adventures – 69 minutes, up 5
- Soarin’ Around the World – 46 minutes, up 9
- Mission: SPACE – 30 minutes, up 1
- Royal Sommerhus – 29 minutes, up 1
- Spaceship Earth – 25 minutes, up 3
- Turtle Talk with Crush – 19 minutes, up 1
- The Seas with Nemo & Friends – 16 minutes, up 2
- Journey into Imagination with Figment – 15 minutes, down 3
- Gran Fiesta Tour Starring the Three Caballeros – 13 minutes, up 3
- Living with the Land – 12 minutes, no change
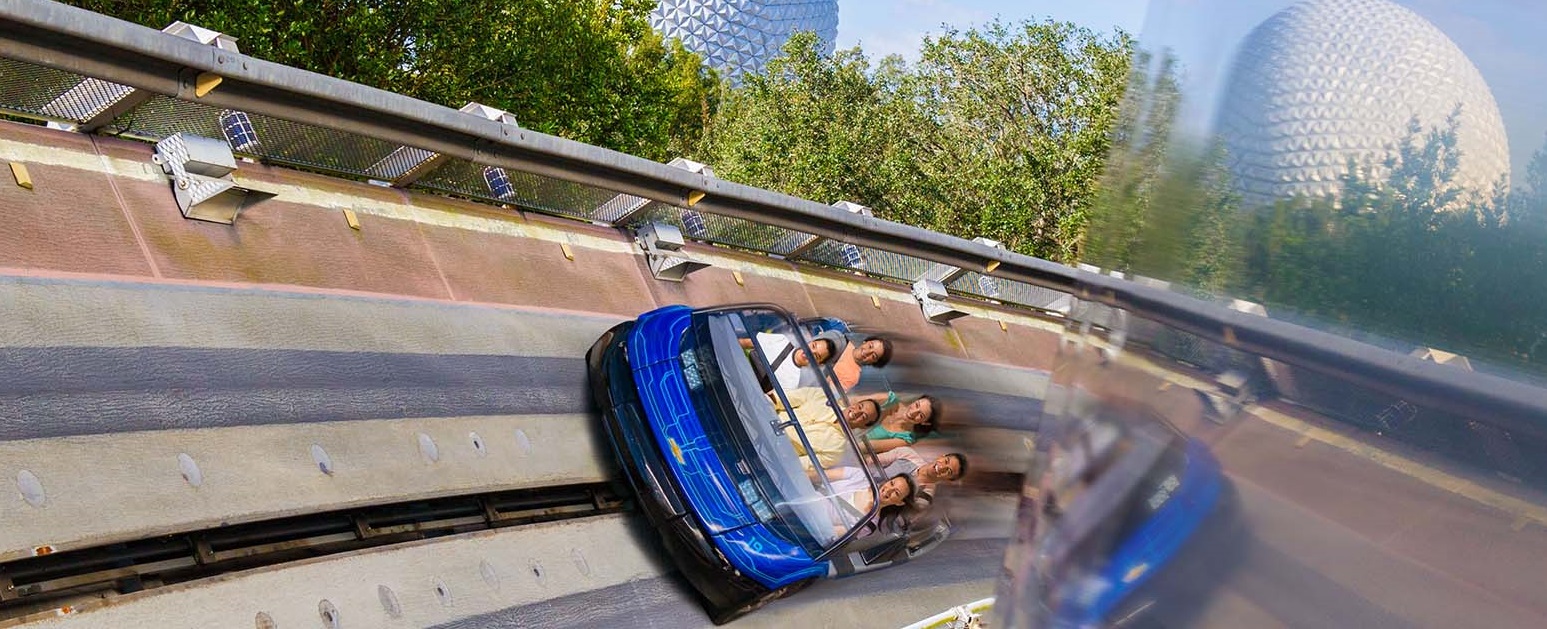
Photo: Disney
Okay, we finally tracked an attraction wait time that dropped for the week. I dunno what everyone had against Figment last week.
Still, the overall picture at EPCOT is clear. Guests stood in line for an average of 35 minutes last week, which is three minutes more than the previous week.
Magic Kingdom
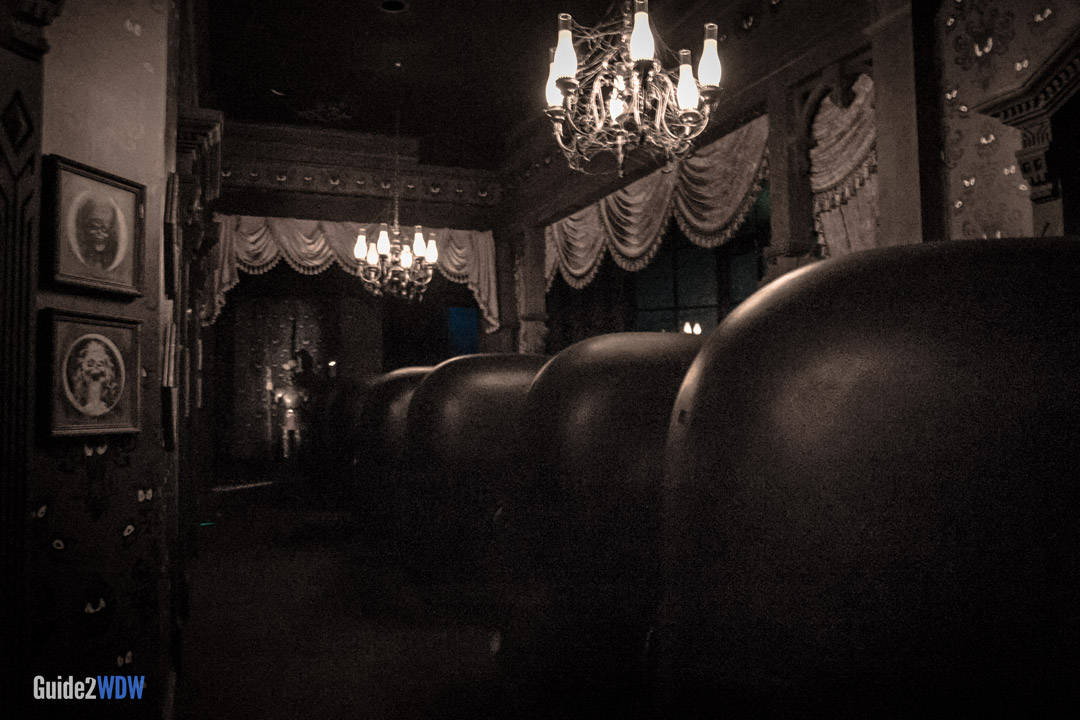
Photo:Disney Fanatic
Did Magic Kingdom continue the trend of larger crowds? The answer is definitely yes.
However, the sheer depth of available attractions generally keeps wait times in check. Was that the case last week? Well, it’s the strangest thing…
- Seven Dwarfs Mine Train – 99 minutes, no change
- Peter Pan’s Flight – 81 minutes, down 1
- Space Mountain – 71 minutes, up 2
- Jungle Cruise – 56 minutes, up 1
- Haunted Mansion – 54 minutes, up 4
- Buzz Lightyear’s Space Ranger Spin – 53 minutes, no change
- Big Thunder Mountain Railroad – 49 minutes, no change
- Princess Fairytale Hall – 46 minutes, no change
- Town Square Theater – 46 minutes, up 6
- Pirates of the Caribbean – 39 minutes, down 4
- Ariel’s Grotto – 38 minutes, no change
- The Many Adventures of Winnie the Pooh – 38 minutes, down 2
- Astro Orbiter – 37 minutes, up 2
- It’s a Small World – 33 minutes, down 3
- Pete’s Silly Sideshow – 33 minutes, no change
- Enchanted Tales with Belle – 31 minutes, no change
- Under the Sea ~ Journey of the Little Mermaid – 31 minutes, up 1
- Tomorrowland Speedway – 28 minutes, up 3
- The Barnstormer – 24 minutes, up 1
- Dumbo the Flying Elephant – 24 minutes, up 3
- The Magic Carpets of Aladdin – 23 minutes, up 3
- Tomorrowland Transit Authority PeopleMover – 19 minutes, up 5
- Monsters, Inc. Laugh Floor – 18 minutes, no change
- Mickey’s PhilharMagic – 17 minutes, down 1
- Walt Disney World Railroad – 17 minutes, down 2
- Mad Tea Party – 16 minutes, up 2
- Prince Charming Regal Carrousel – 10 minutes, down 2
- Country Bear Jamboree – 5 minutes, no change
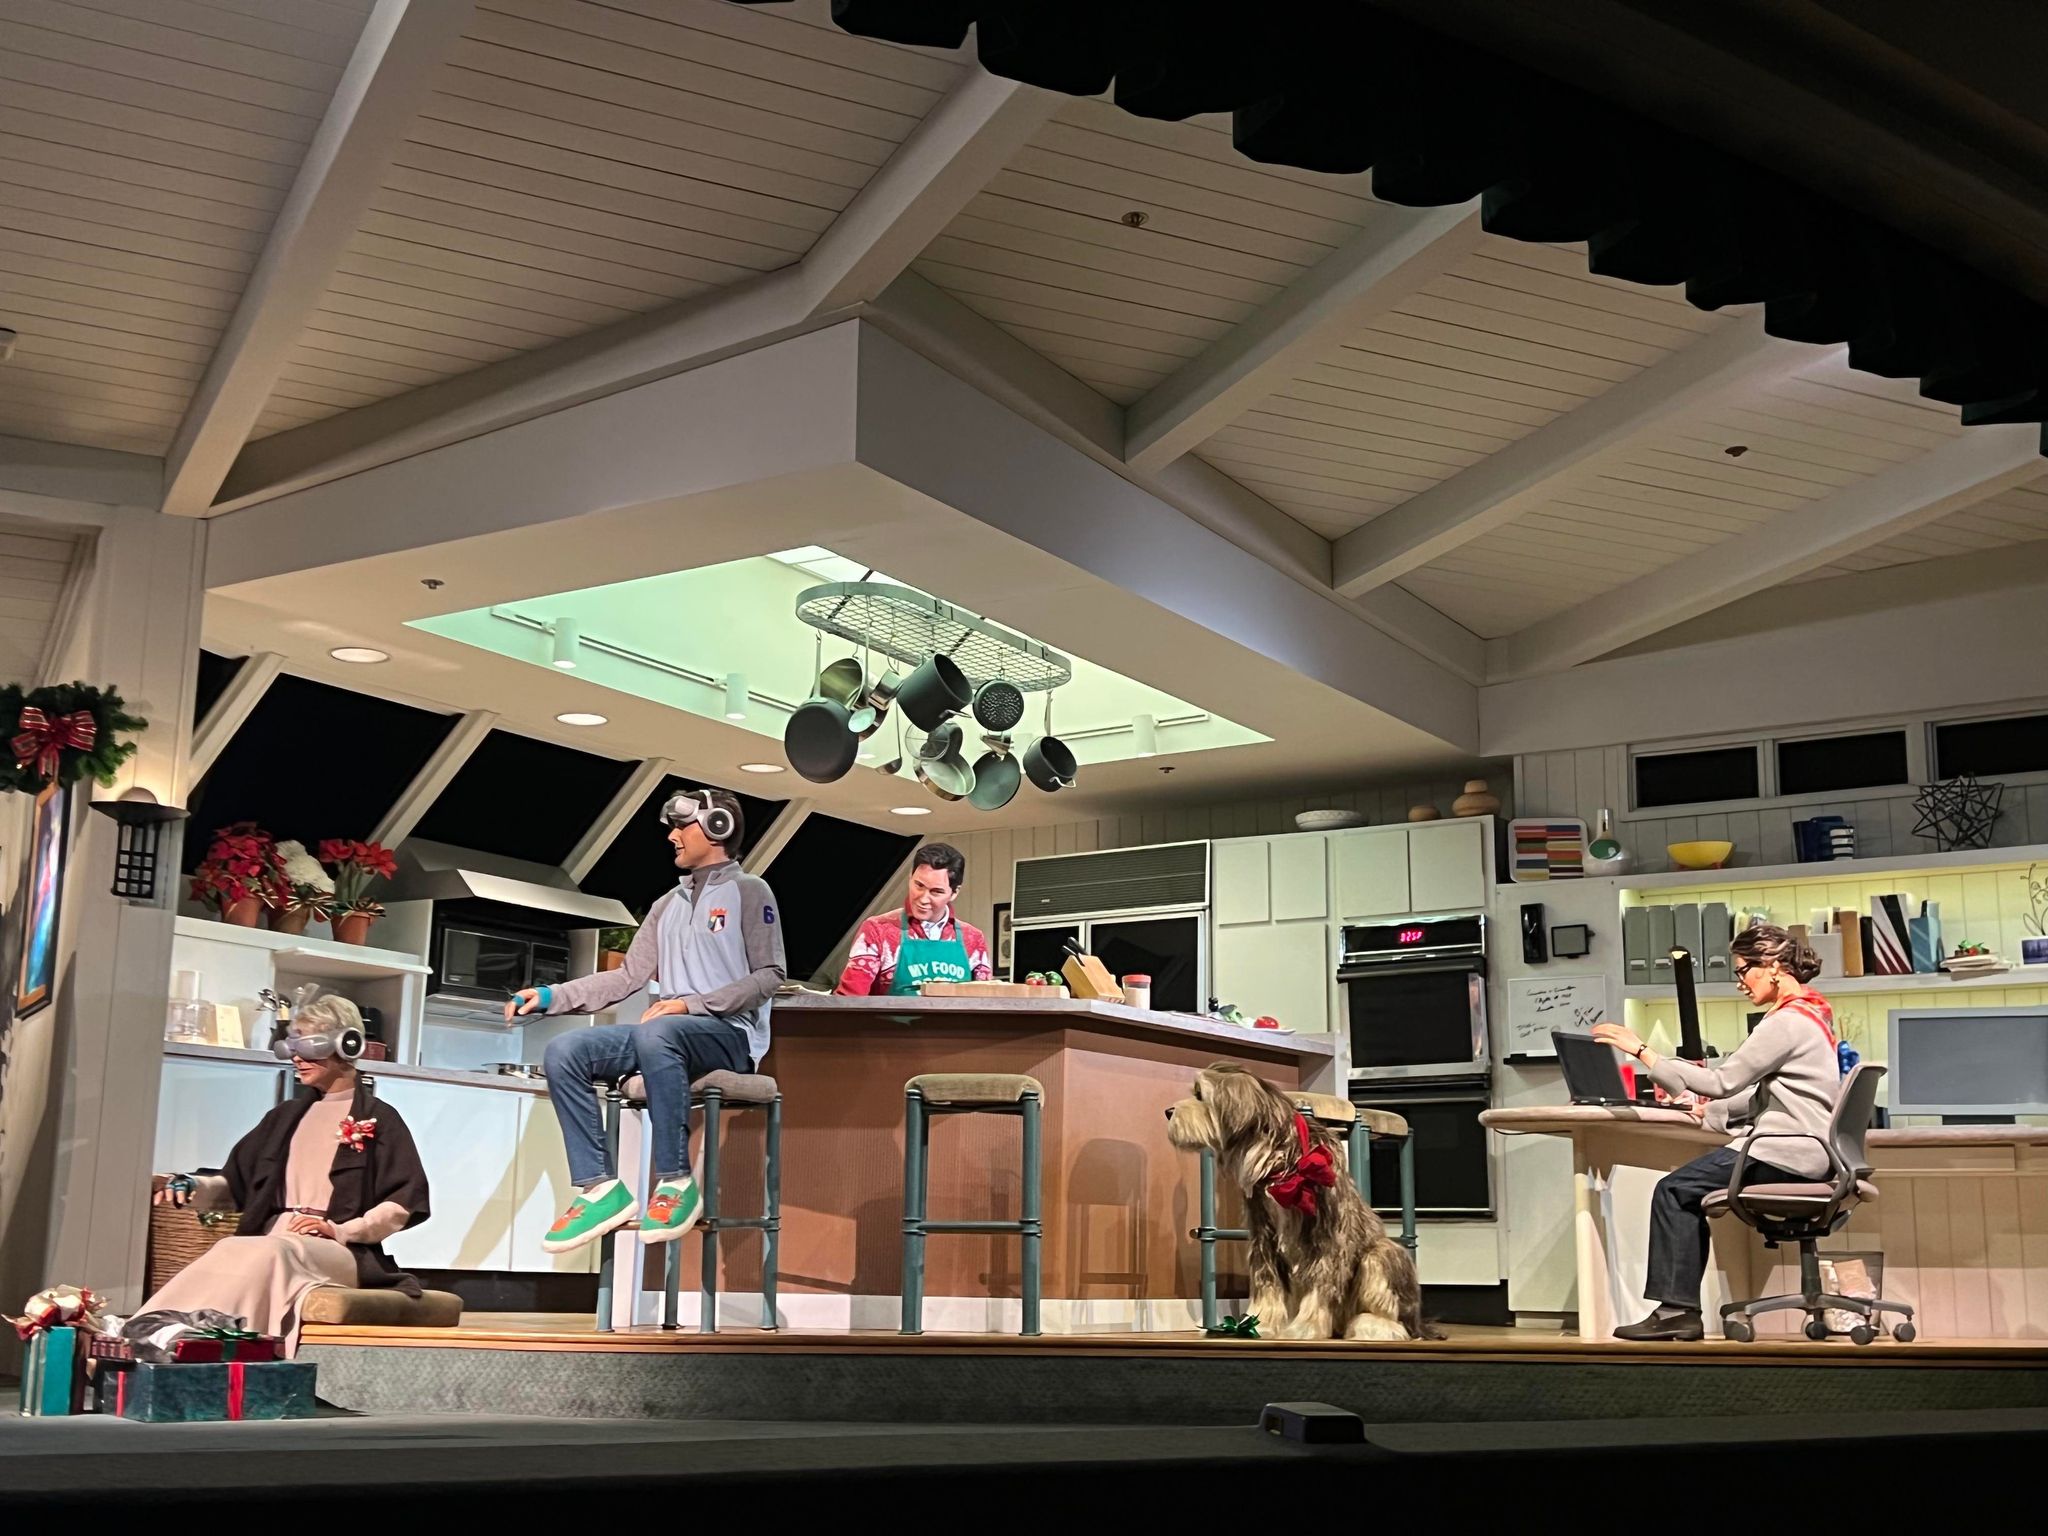
- Walt Disney’s Carousel of Progress – 5 minutes, no change
Final Thoughts
So, Magic Kingdom’s crowds spread out enough that the attractions didn’t vary much.
In fact, the average wait time per attraction was 35 minutes, only one minute more than the previous week.
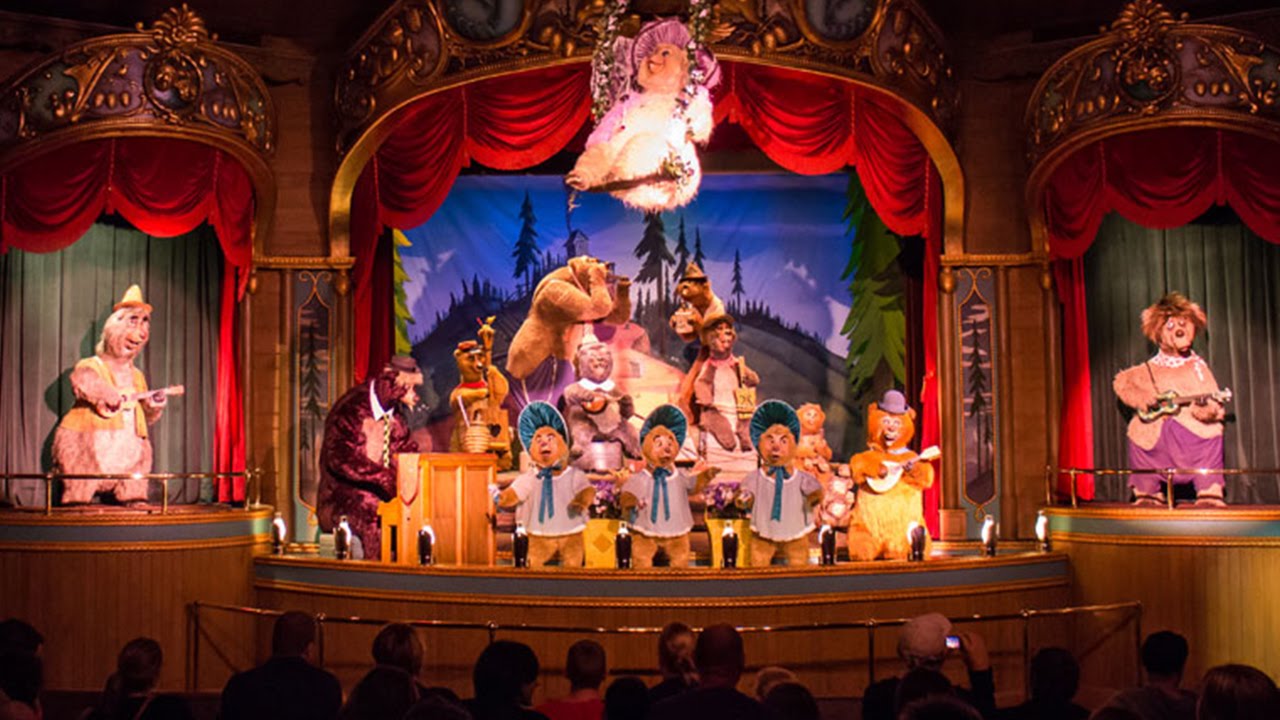
Photo: Disney
This is one of those theme park behaviors that’s challenging to conceptualize.
Magic Kingdom can spread out crowds throughout the park due to the sheer volume of available attractions.
Hollywood Studios lacks that option because it’s so small, and its E-ticket attractions remain in such high demand.
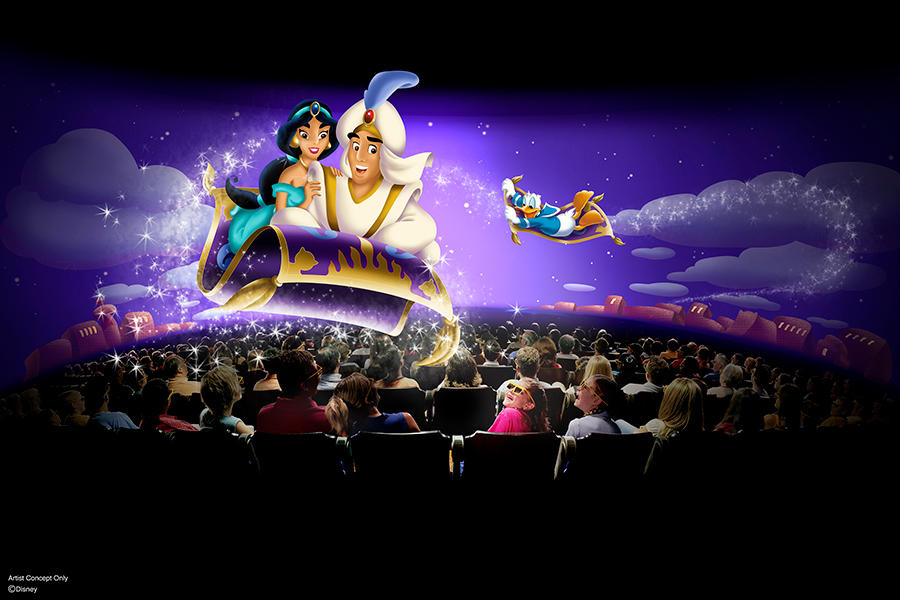
Photo: Disney
In terms of theme park design and management, Magic Kingdom is superior for this reason. It can handle bigger crowds better.
Keep that in mind when you’re visiting Walt Disney World on a crowded day!
Photo: MickeyBlog
Thanks for visiting MickeyBlog.com! Want to go to Disney? For a FREE quote on your next Disney vacation, please fill out the form below, and one of the agents from MickeyTravels, a Diamond Level Authorized Disney Vacation Planner, will be in touch soon!