Walt Disney World Wait Times for Third Week of July 2023
The mystery of Walt Disney World continues.
Some visitors have posted pictures that show small crowds at various theme park locations.
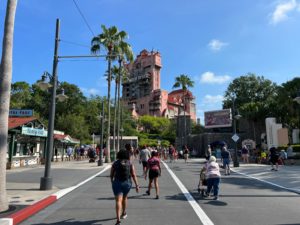

Meanwhile, others have posted frankly absurd wait times for some of Disney’s most popular attractions. Something has to give, right?
Let’s figure out what’s happening with wait times during the third week of July 2023.
Disney’s Animal Kingdom

Disney100 Sign
We’re about three weeks away from Disney’s quarterly earnings report. At that point, Disney executives will discuss park revenue.
As part of this conversation, someone at Disney typically indicates attendance levels for the past quarter as well as upcoming ones.


I can say with confidence that everyone will hang on to CEO Bob Iger’s words when that moment comes.
Iger recently indicated on CNBC that Florida tourism has generally declined this summer, but that Disney’s numbers are fine.


Photo: DIsney+
Meanwhile, Disney analysts and (especially) critics are reading the tea leaves. Their interpretation suggests a vast decrease in demand.
Were that true, we should track the drop in wait times.


I’ll note that one of my peers, the foremost expert in the industry, recently explicitly stated that’s not the case.
I trust that individual the most of anyone on this subject. So, I’m curious what they know that nobody else has noticed yet.


Photo: Disney
Keeping all that in mind, here are Animal Kingdom’s average wait times last week:
- Avatar Flight of Passage – 107 minutes, up 2
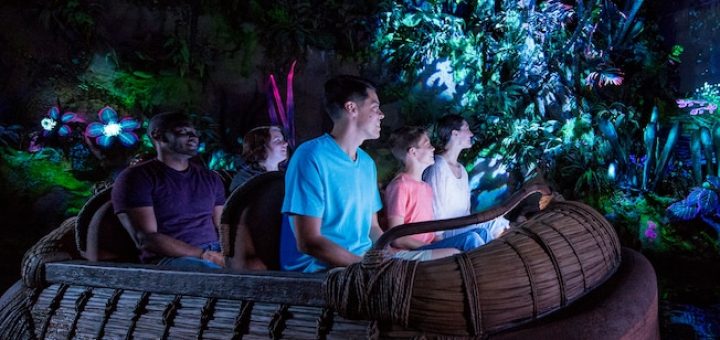
- Na’vi River Journey – 81 minutes, up 8
- Kali River Rapids – 50 minutes, up 3
- Adventurers Outpost – 45 minutes, up 6
- DINOSAUR – 45 minutes, up 7
- Expedition Everest – 43 minutes, up 3
- Kilimanjaro Safaris – 38 minutes, up 2
- It’s Tough to Be a Bug! – 15 minutes, up 5
- TriceraTop Spin – 9 minutes, no change


Photo: Disney
Obviously, NOTHING in this data suggests a park slowdown this past week.
On the contrary, EVERY attraction increased its wait time or held last week’s total.
Therefore, the average attraction required a wait of 49 minutes, an increase of four minutes from the last time.
Disney’s Hollywood Studios
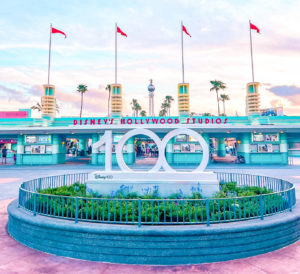

Generally, I wait until I have Hollywood Studios data before I start making any sweeping claims about attendance, though.
Here are the park’s average attraction wait times:
- Slinky Dog Dash – 93 minutes, down 4
- Star Wars: Rise of the Resistance – 85 minutes, down 8
- Millennium Falcon: Smugglers Run – 81 minutes, up 4
- Rock ‘n’ Roller Coaster Starring Aerosmith – 75 minutes, down 12
- Mickey & Minnie’s Runaway Railway – 67 minutes, down 1
- Toy Story Mania! – 67 minutes, down 2
- Twilight Zone Tower of Terror – 59 minutes, down 5
- Red Carpet Dreams – 41 minutes, up 2
- Alien Swirling Saucers – 39 minutes, down 1
- Star Tours – The Adventures Continue! – 20 minutes, down 5
- Celebrity Spotlight – 18 minutes, down 1
- Lightning McQueen’s Racing Academy – 15 minutes, down 3
- Muppet*Vision 3D – 10 minutes, no change


Rise of the Resistance
Okay, most Hollywood Studios attractions decreased their average waits last week.
Not coincidentally, this park was where people were posting pictures of short lines and small crowds. So, we’ve confirmed these anecdotes empirically.
Overall, guests at Hollywood Studios waited for an average of 45 minutes, three minutes less than the previous week.
EPCOT


Photo: Disney
Okay, that’s one in the “smaller crowds” column and another in the “larger crowds” column. Stuff like this drives data scientists mad.
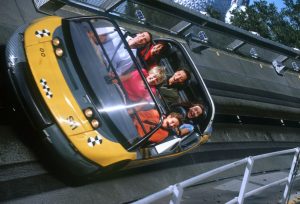

Photo: Disney
We’ll use EPCOT as the tiebreaker. Here are the park’s average waits for the past week:
- Test Track – 72 minutes, up 7
- Frozen Ever After – 67 minutes, up 3
- Remy’s Ratatouille Adventure – 64 minutes, up 3
- Soarin’ Around the World – 37 minutes, up 4
- Mission: SPACE – 29 minutes, up 3
- Royal Sommerhus – 28 minutes, up 1
- Spaceship Earth – 22 minutes, up 3
- Journey into Imagination with Figment – 18 minutes, up 4
- Turtle Talk with Crush – 18 minutes, no change
- The Seas with Nemo & Friends – 14 minutes, no change
- Living with the Land – 12 minutes, up 2
- Gran Fiesta Tour Starring the Three Caballeros – 10 minutes, up 1


Photo: Disney
So, EPCOT behaved similarly to Animal Kingdom, with every attraction either increasing its average wait or remaining the same as the last time.
Overall, guests waited for an average of 32 minutes, three minutes more than the previous week.
Magic Kingdom
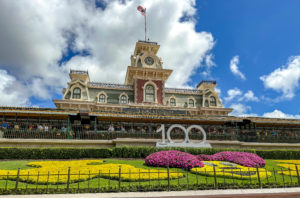

One of two things is about to happen. Either Magic Kingdom’s wait times will go up on average, thereby indicating higher attendance levels at Walt Disney World overall, or they’ll decrease.
If that second thing happens, we’ll have two parks with larger crowds and two parks with smaller crowds, which will indicate basically a draw.


Here are Magic Kingdom’s average attraction wait times for the past week:
- Seven Dwarfs Mine Train – 99 minutes, up 8
- Peter Pan’s Flight – 82 minutes, up 4
- Space Mountain – 69 minutes, down 3
- Jungle Cruise – 55 minutes, up 1
- Buzz Lightyear’s Space Ranger Spin – 53 minutes, up 4
- Haunted Mansion – 50 minutes, no change
- Big Thunder Mountain Railroad – 49 minutes, no change
- Buzz Lightyear’s Space Ranger Spin – 47 minutes, up 1
- Princess Fairytale Hall – 46 minutes, up 4
- Pirates of the Caribbean – 43 minutes, no change
- The Many Adventures of Winnie the Pooh – 40 minutes, no change
- Town Square Theater – 40 minutes, no change
- Ariel’s Grotto – 38 minutes, no change
- It’s a Small World – 36 minutes, up 4
- Astro Orbiter – 35 minutes, down 1
- Pete’s Silly Sideshow – 33 minutes, up 1
- Enchanted Tales with Belle – 31 minutes, up 1
- Under the Sea ~ Journey of the Little Mermaid – 30 minutes, up 4
- Tomorrowland Speedway – 25 minutes, no change
- The Barnstormer – 23 minutes, no change
- Dumbo the Flying Elephant – 21 minutes, up 1
- The Magic Carpets of Aladdin – 20 minutes, up 1
- Mickey’s PhilharMagic – 18 minutes, no change
- Monsters, Inc. Laugh Floor – 18 minutes, up 1
- Walt Disney World Railroad – 15 minutes, up 1
- Mad Tea Party – 14 minutes, down 1
- Tomorrowland Transit Authority PeopleMover – 14 minutes, no change
- Prince Charming Regal Carrousel – 12 minutes, up 1
- Country Bear Jamboree – 5 minutes, no change
- Walt Disney’s Carousel of Progress – 5 minutes, no change
Final Thoughts


As you can tell, Magic Kingdom trended upward…but only very slightly.
Guests stood in line for an average of 34 minutes per attraction, a one-minute increase from the previous week.
So, no matter what you’ve heard or read, Walt Disney World crowds were slightly larger overall.
The week of July 4th is looking more and more like a quirk anomaly.

Photo: MickeyBlog
Thanks for visiting MickeyBlog.com! Want to go to Disney? For a FREE quote on your next Disney vacation, please fill out the form below, and one of the agents from MickeyTravels, a Diamond Level Authorized Disney Vacation Planner, will be in touch soon!
Feature Photo: Disney


