Walt Disney World Wait Times for Second Week of July 2023
Okay, we’ve had a lot of stories recently that suggest attendance has dropped at Florida theme parks.
For example, here’s a Wall Street Journal article featuring MickeyBlog’s Greg Antonelle and a CNN one with MickeyBlog’s Kayla Pareti.
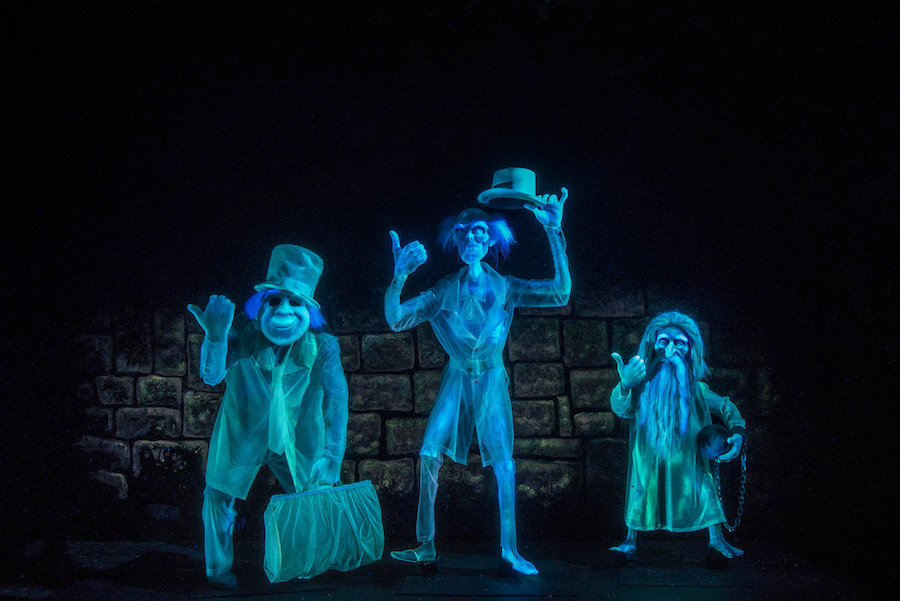
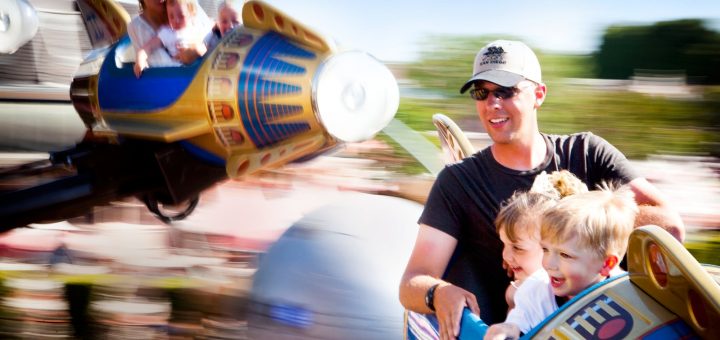
Photo: Joshua Sudock/Disneyland Resort
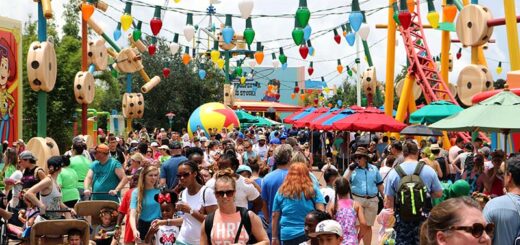
Anecdotally, we’ve noticed smaller crowds at the parks thus far in July.
Does that translate to shorter wait times? Let’s find out! Here are Walt Disney World’s average wait times for last week.
Disney’s Animal Kingdom
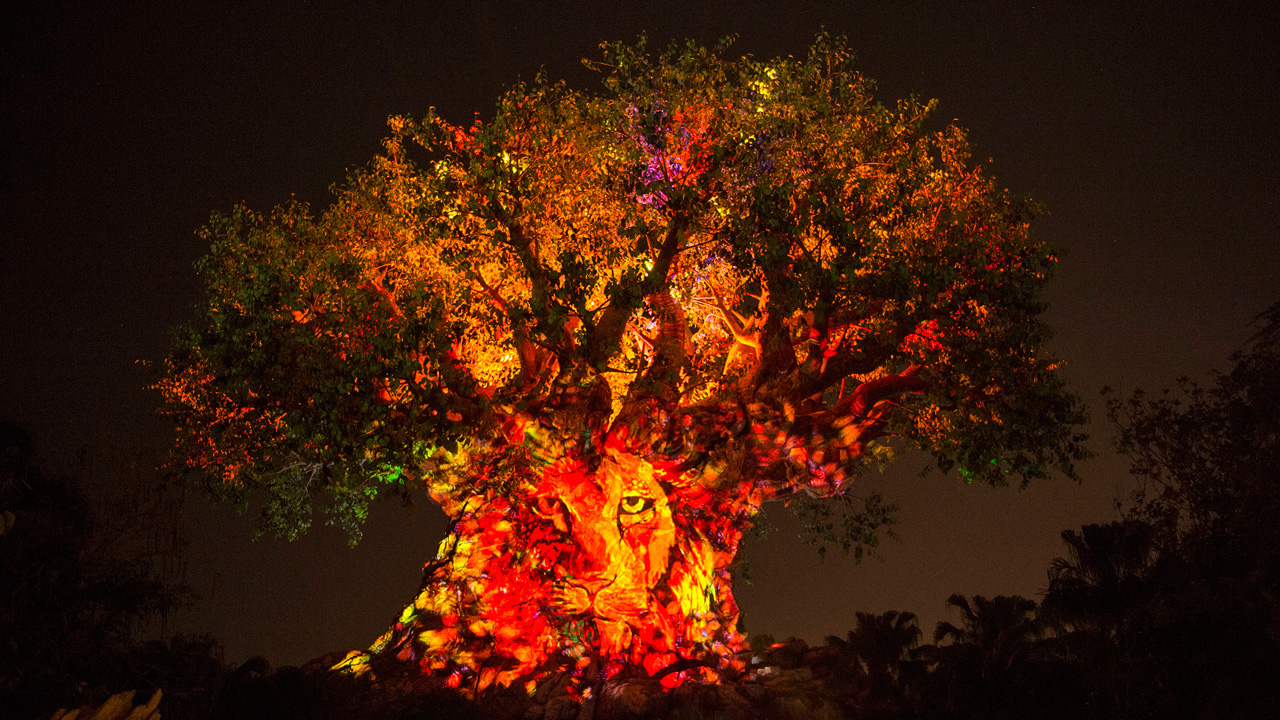
Photo: Disney
In the previous evaluation for the week of July 4th, two theme parks witnessed modest increases in wait times while the other two declined.
Animal Kingdom’s attraction lines went up, which was partially due to the lower number of rides here.
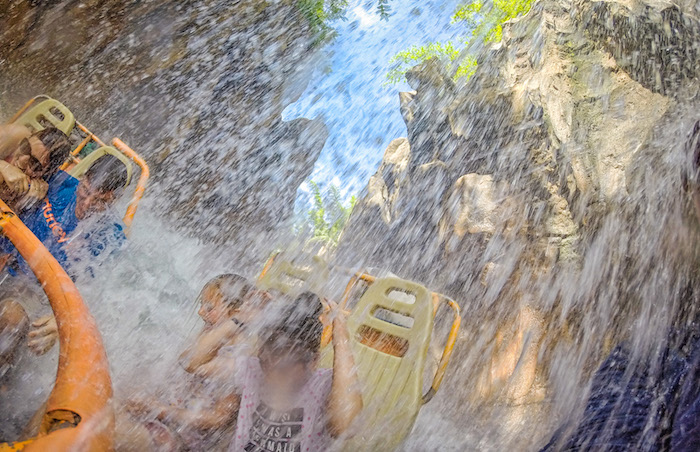
Photo by Judd Helms via WDW Magazine
Since Animal Kingdom is more experiential, its attraction wait times generally involve smaller fluctuations than some of the others.
The one oddity in that data set was that Kali River Rapids basically held serve in the face of record-setting temperatures.
I would have expected a spike as guests cooled off. That’s one of several curiosities from the holiday week that have bothered me in tracking the data.
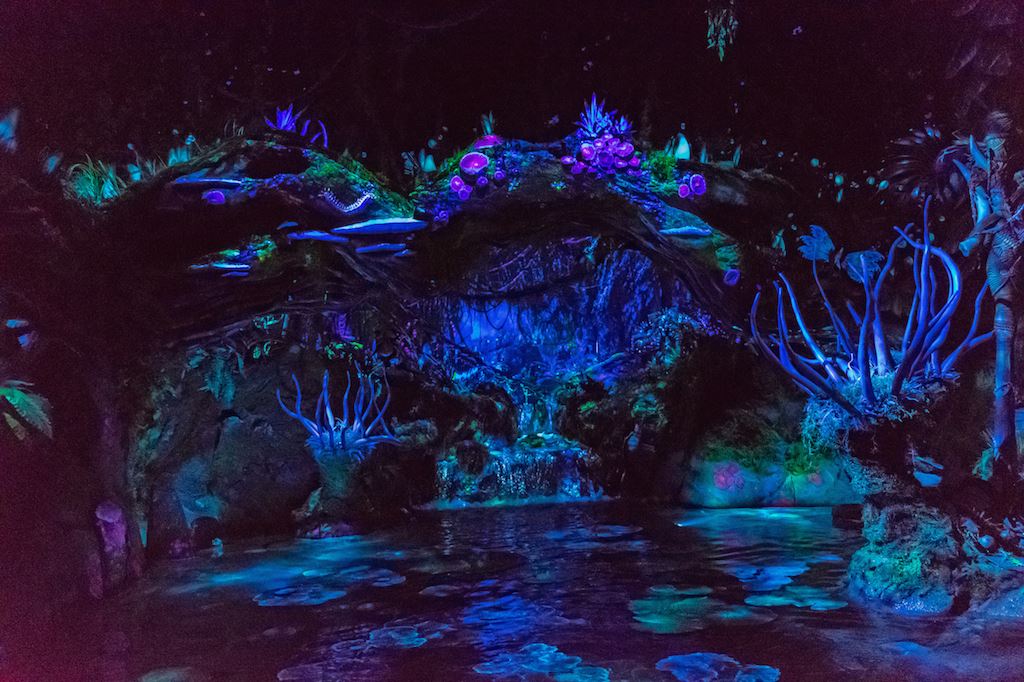
Photo: TouringPlans.com
Hopefully, this past week’s information makes more sense. Here are the average waits at Animal Kingdom last week:
- Avatar Flight of Passage — 105 minutes, up 8
- Na’vi River Journey – 73 minutes, up 4
- Kali River Rapids – 47 minutes, up 1
- Expedition Everest – 40 minutes, up 6
- Adventurers Outpost – 39 minutes, down 1
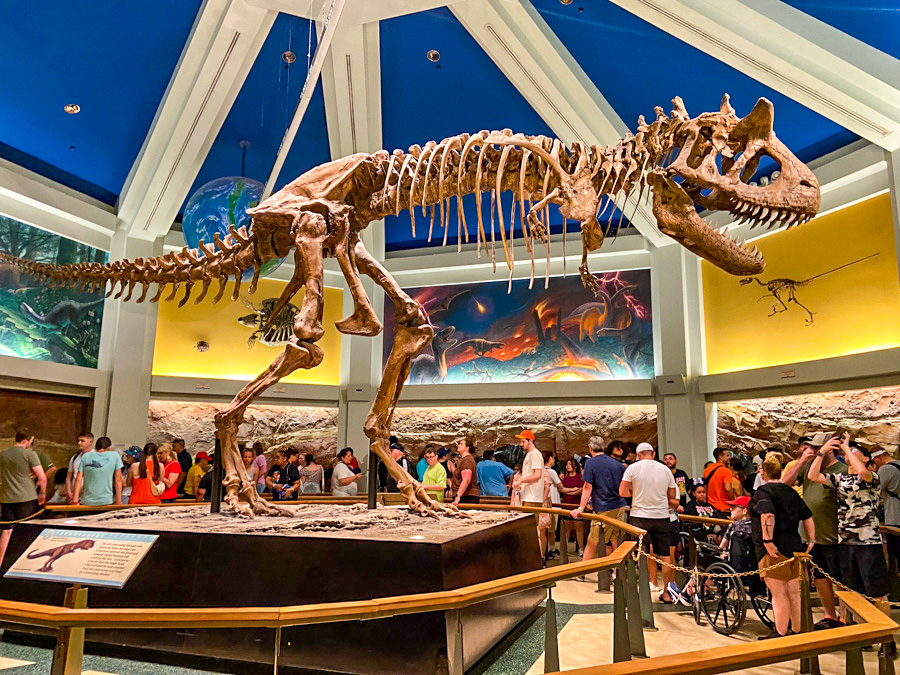
- DINOSAUR – 38 minutes, no change
- Kilimanjaro Safaris – 36 minutes, up 6
- It’s Tough to Be a Bug! – 10 minutes, no change
- TriceraTop Spin – 9 minutes, no change
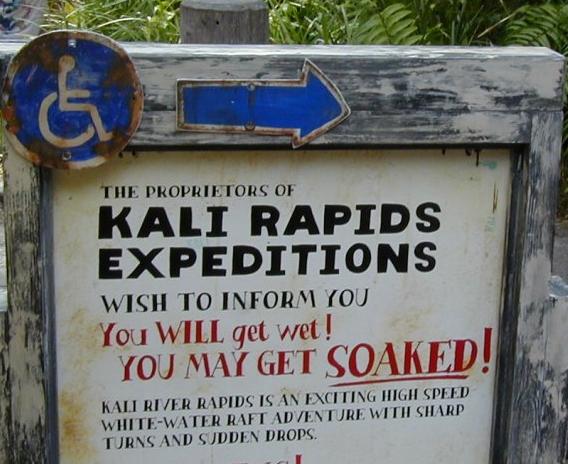
Photo: WIkipedia
So, the consistency of Kali River Rapids continues to confuse me. Generally, during extreme heat, that ride’s wait spikes by 30 percent or more.
I’m not tracking anything like that in July 2023, which is puzzling. But it’s my problem, and I’ll deal with it.
Anyway, guests waited for an average of 45 minutes, which is one minute more than last time.
Thus far, July has remained eerily consistent at Animal Kingdom.
Disney’s Hollywood Studios
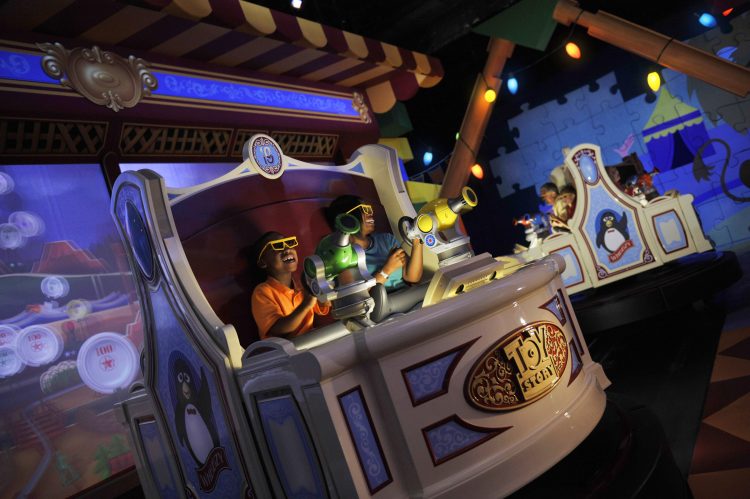
Photo: Disney
This park dropped about eight percent during the holiday week, which shouldn’t happen.
People have spent lots of time on social media arguing why, but let’s not lose sight of what matters.
If you were at the park that week, you must have been delighted due to the lack of crowds relative to what you had braced for. Congrats!
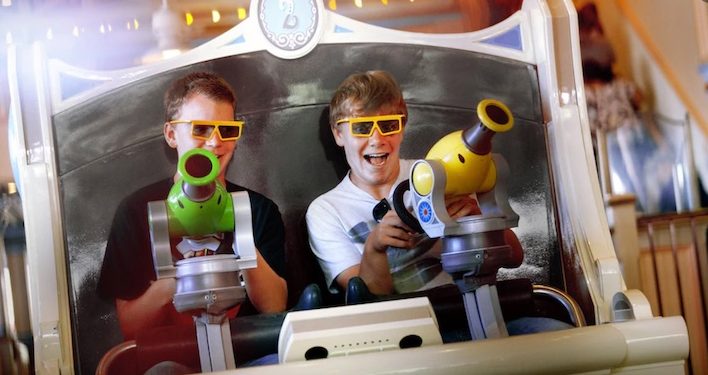
Photo: Disney
So, how were the crowds the week after July 4th? Here are the average wait times at Hollywood Studios last week:
- Slinky Dog Dash – 97 minutes, up 8
- Star Wars – Rise of the Resistance – 93 minutes, up 10
- Rock ‘n’ Roller Coaster Starring Aerosmith – 87 minutes, up 21
- Millennium Falcon: Smugglers Run – 77 minutes, up 11
- Toy Story Mania! – 69 minutes, up 12
- Mickey & Minnie’s Runaway Railway – 68 minutes, up 7
- Twilight Zone Tower of Terror – 64 minutes, up 15
- Alien Swirling Saucers – 40 minutes, up 3
- Red Carpet Dreams – 39 minutes, up 2
- Star Tours – The Adventures Continue – 25 minutes, up 6
- Celebrity Spotlight – 19 minutes, up 1
- Lightning McQueen’s Racing Academy – 18 minutes, up 1
- Muppet*Vision 3D – 10 minutes, no change
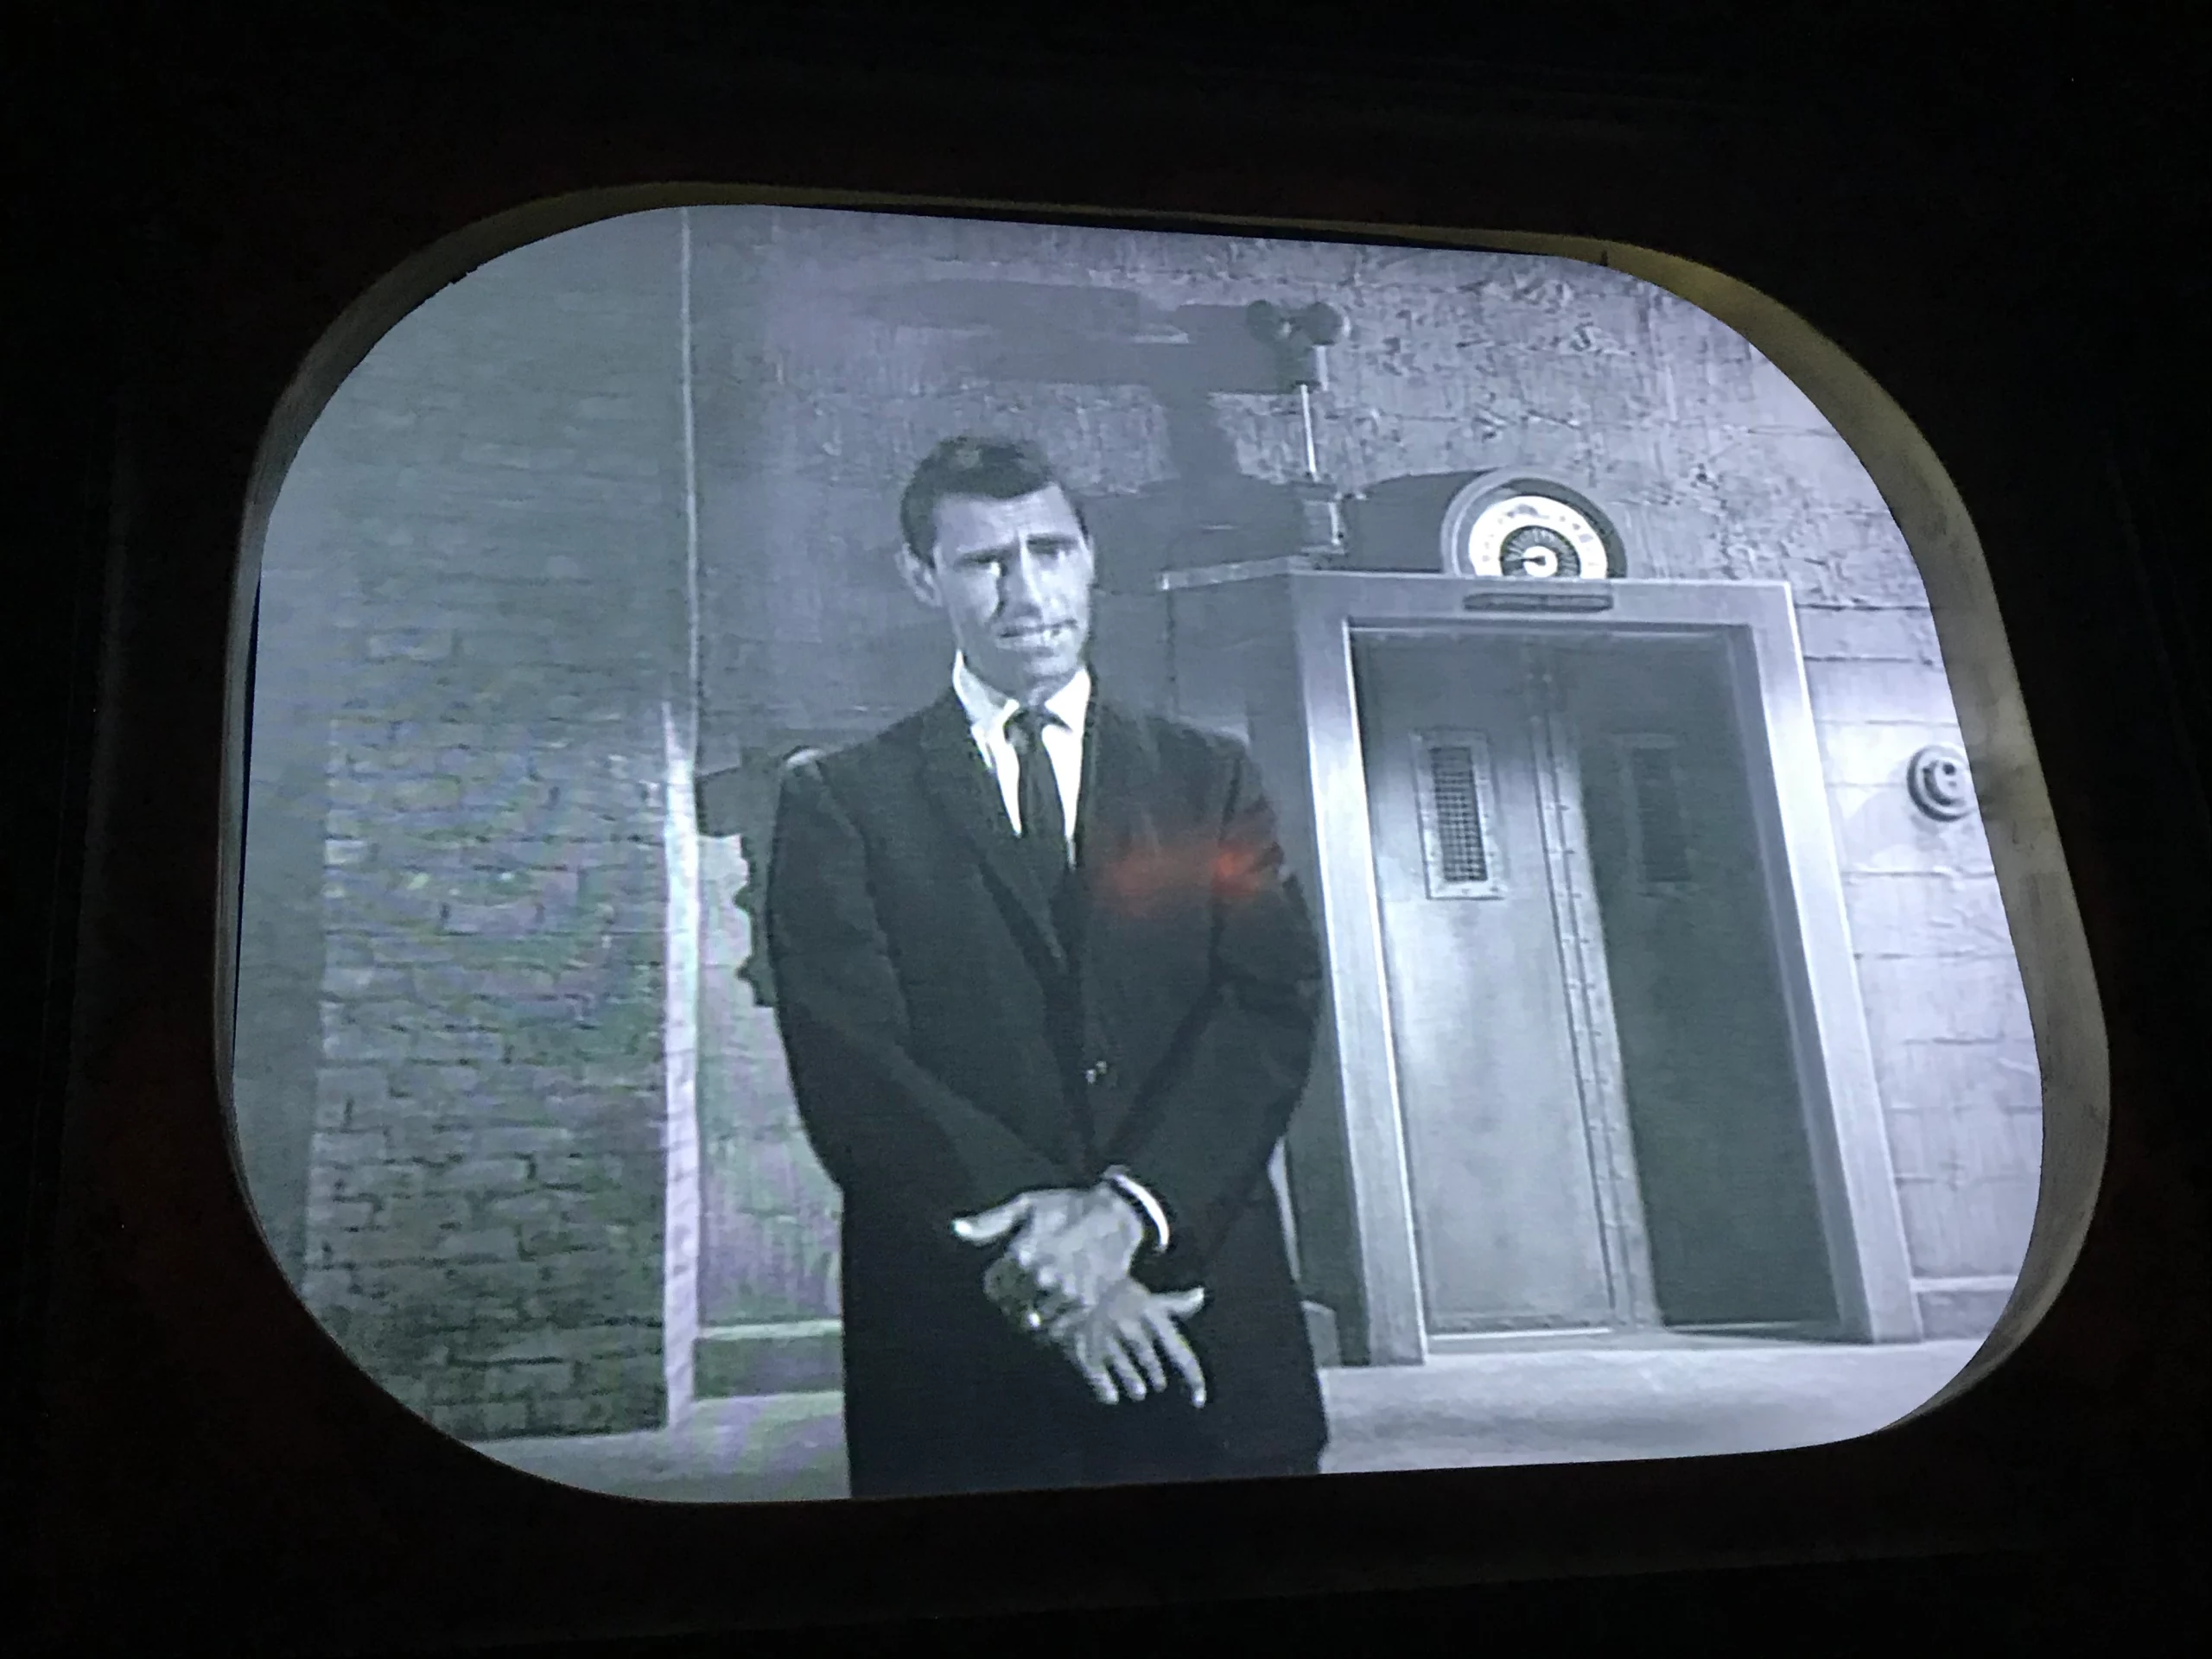
Photo: Orlando Sentinel
No, that’s not your imagination. Every attraction increased its wait time last week except for the typically static Muppet movie.
Based on what I’m seeing from the week before July 4th and the week afterward, people simply skipped the parks with the holiday falling on Tuesday.
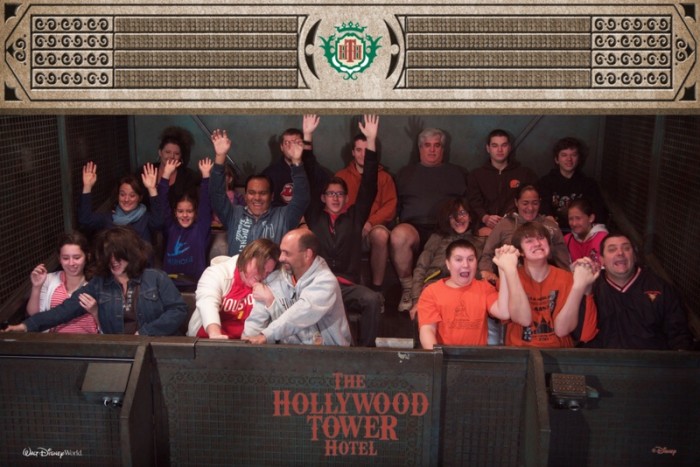
Photo: Touring Plans
To wit, Hollywood Studios attractions averaged a 48-minute wait, which is six minutes more than last time and two minutes higher than the previous week.
Overall, this data indicates that Hollywood Studios is more crowded in July, but it wasn’t during the holidays.
EPCOT
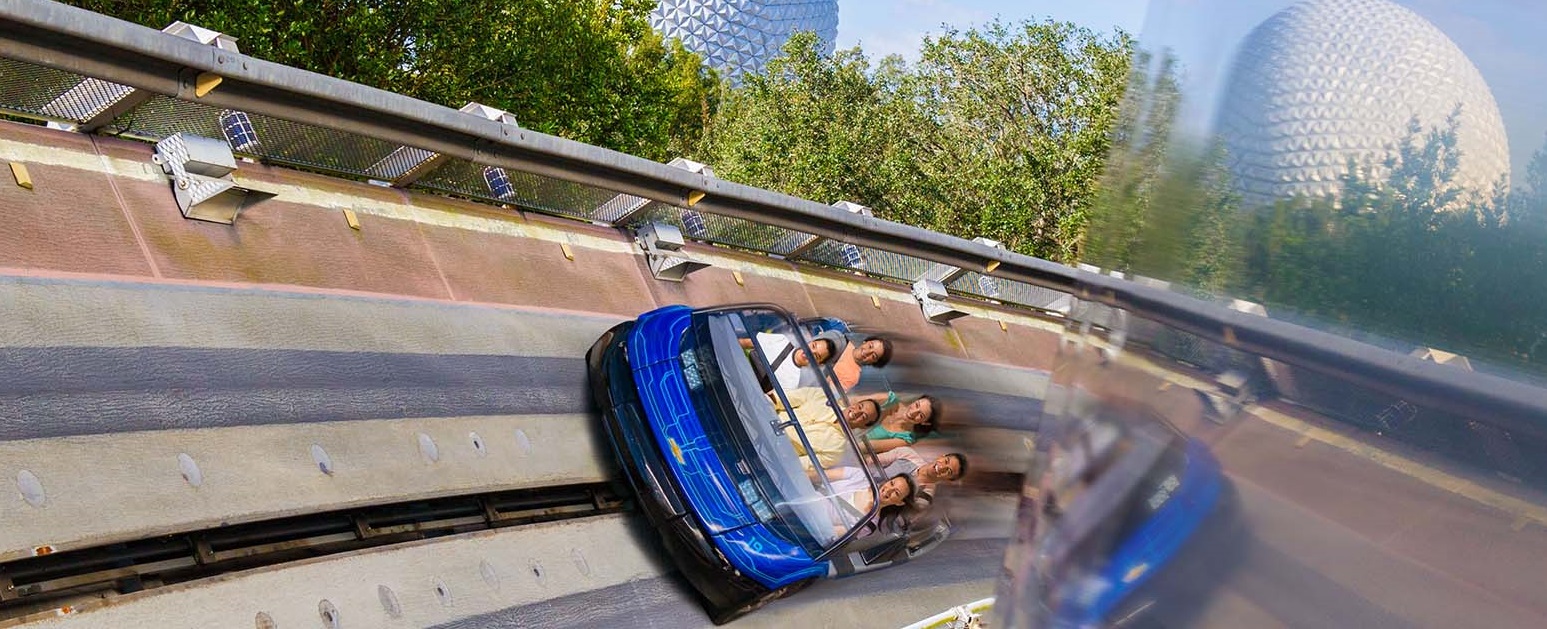
Photo: Disney
I think you’re getting the point that the July 4th oddness was an aberration rather than a trend.
We’ll confirm with EPCOT’s average wait times for the past week:

Photo: Christy Weinberg
- Test Track – 65 minutes, down 1
- Frozen Ever After – 64 minutes, down 4
- Remy’s Ratatouille Adventure – 61 minutes, down 4
- Soarin’ Around the World – 33 minutes, down 1
- Royal Sommerhus – 27 minutes, no change
- Mission: SPACE – 26 minutes, down 4
- Spaceship Earth – 19 minutes, up 1
- Turtle Talk with Crush – 18 minutes, no change
- Journey into Imagination with Figment – 14 minutes, up 1
- The Seas with Nemo & Friends – 14 minutes, up 2
- Living with the Land – 10 minutes, down 1
- Gran Fiesta Tour Starring the Three Caballeros – 9 minutes, down 2
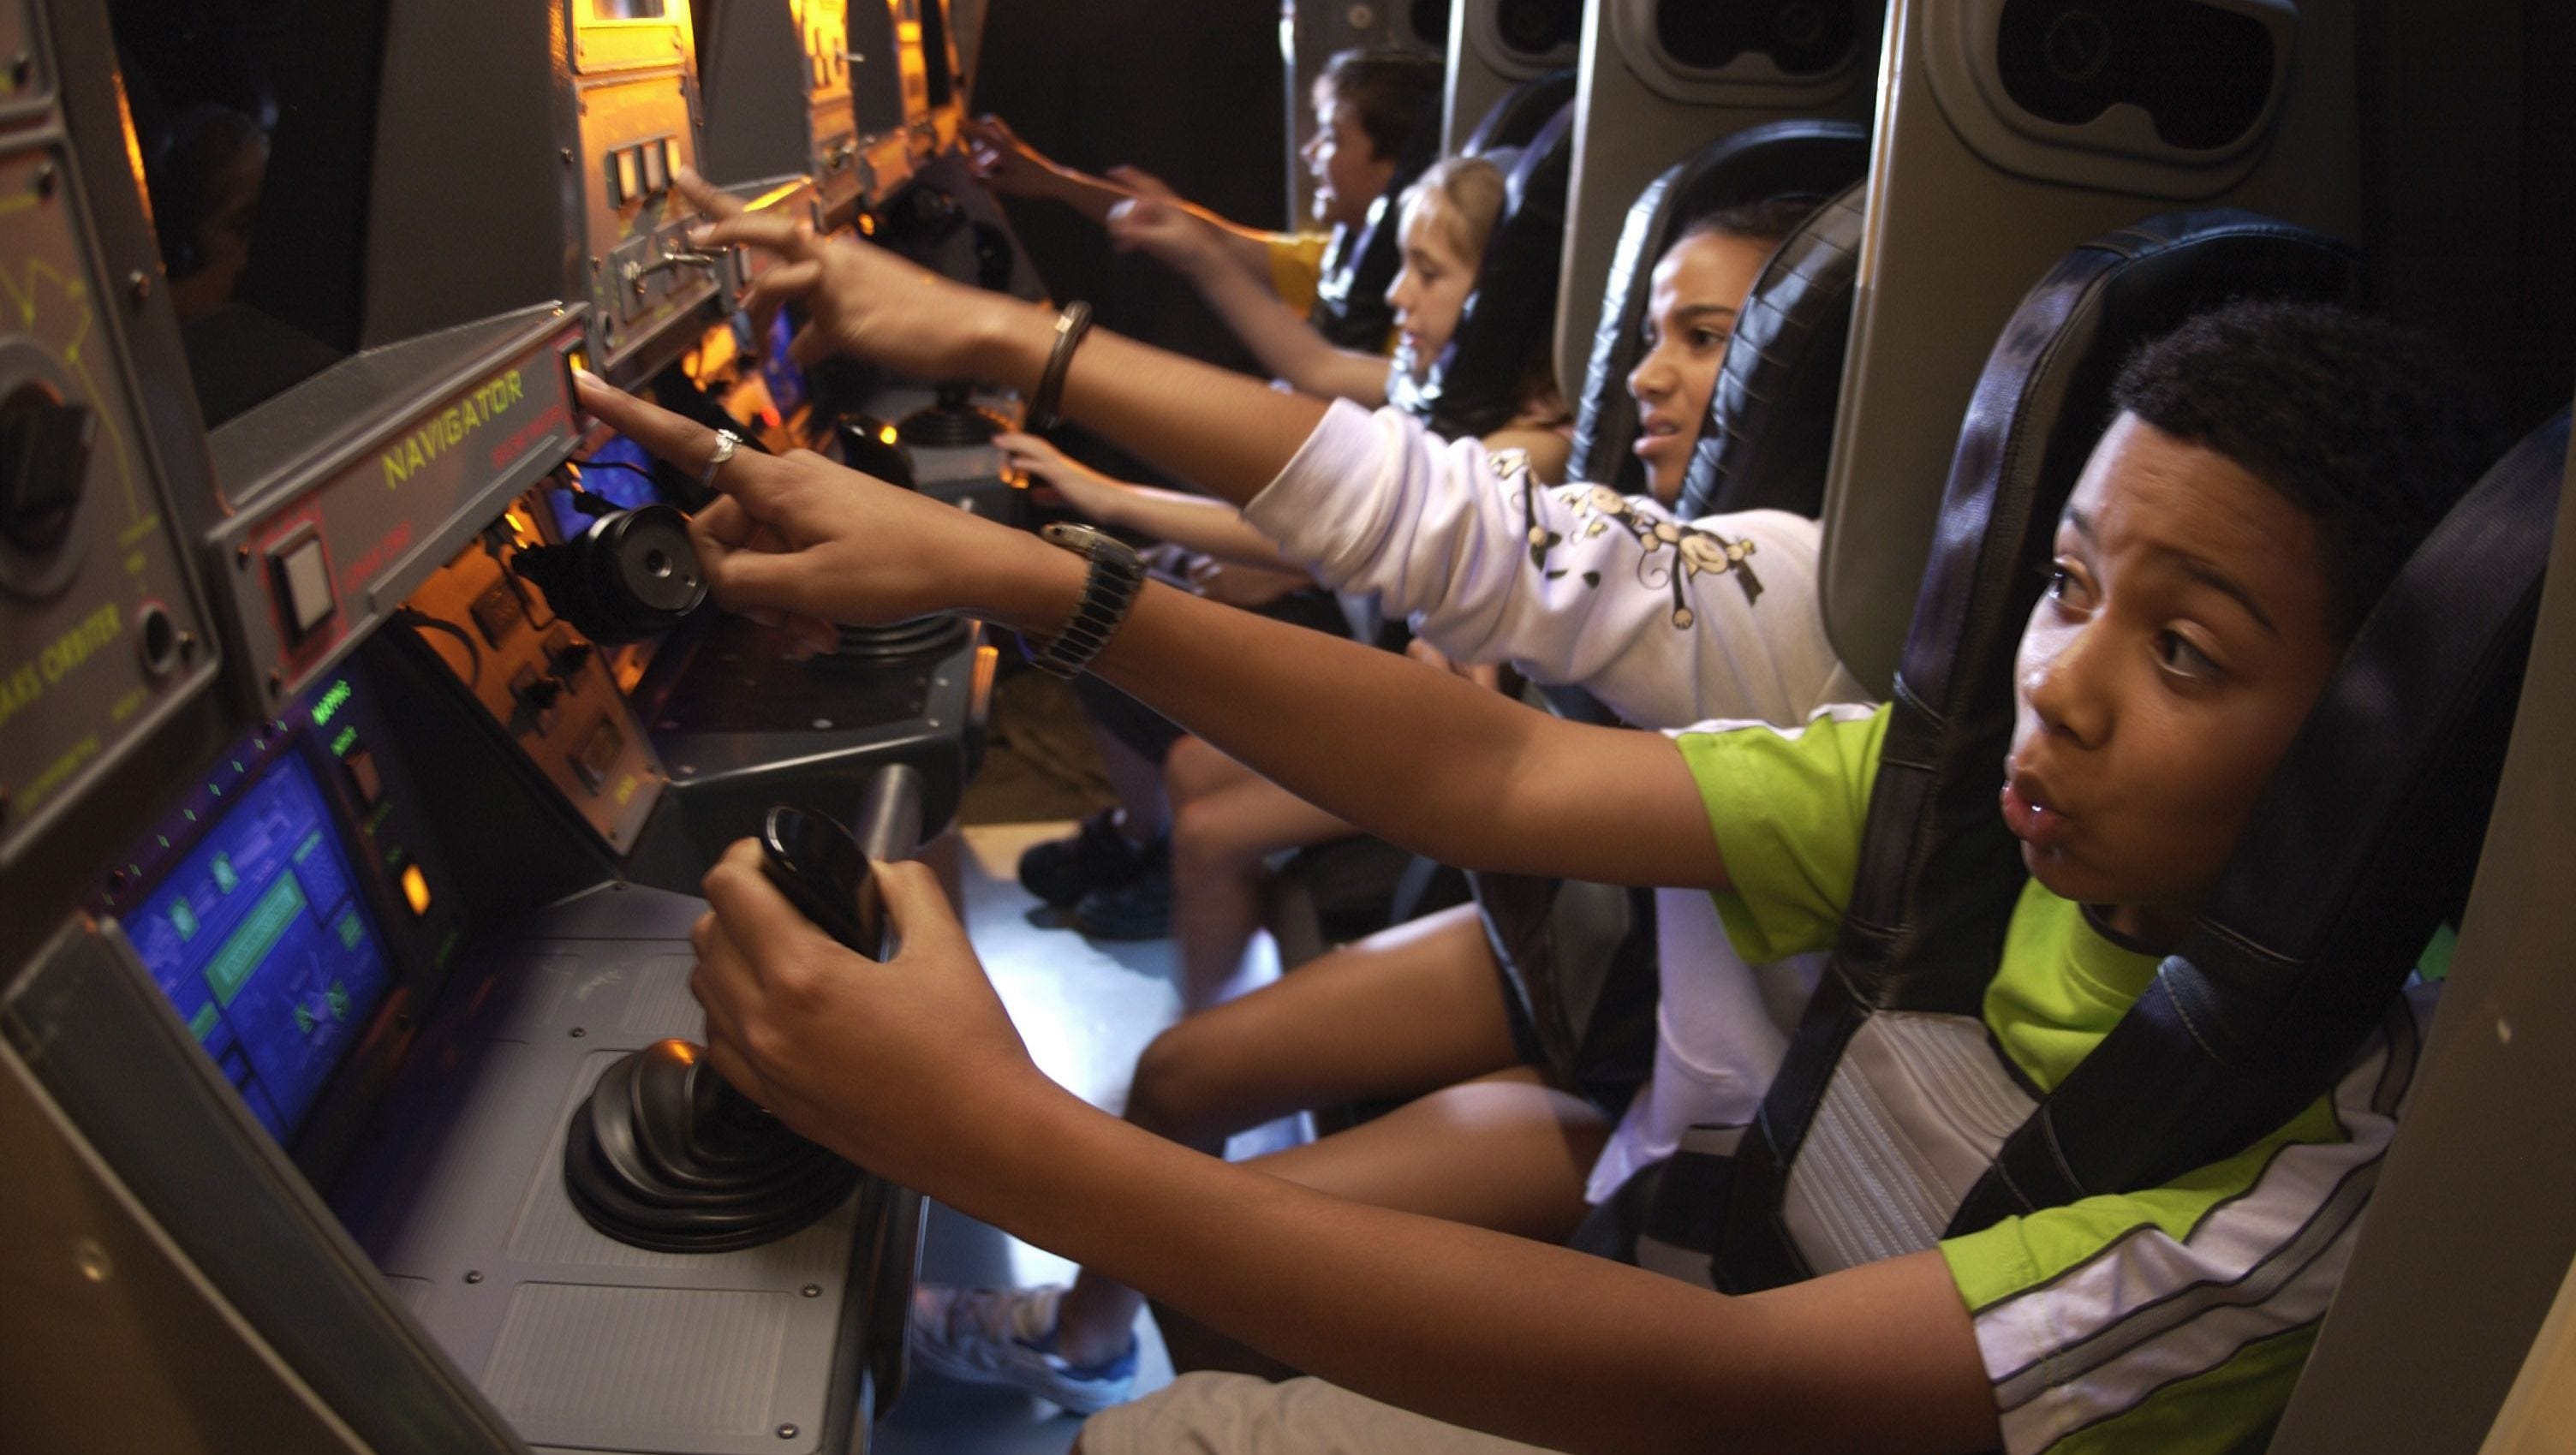
Photo: Disney
Guests at EPCOT stood in line for an average of 29 minutes, which was one minute less than last time.
Obviously, the surprise here is that Test Track won the week, which hadn’t happened in a while.
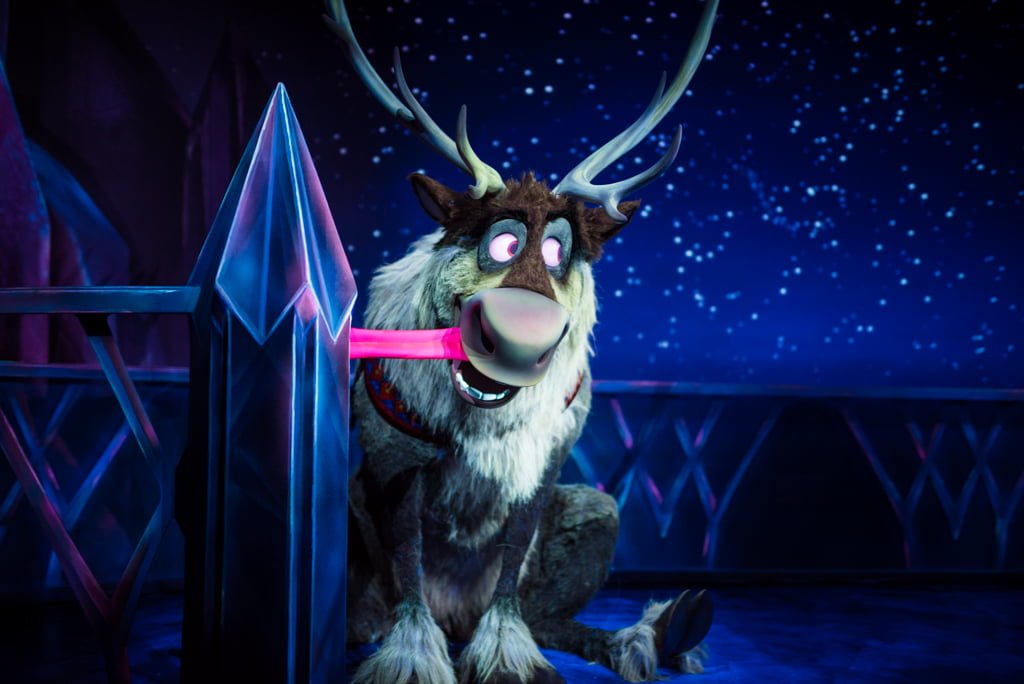
Photo: Disney
In terms of why the park dropped, there’s a simple explanation here. The 2023 EPCOT International Flower & Garden Festival ended on July 5th.
While we’re in between festivals, EPCOT typically suffers a lull, although it is a bit odd for that to happen in July.
Magic Kingdom
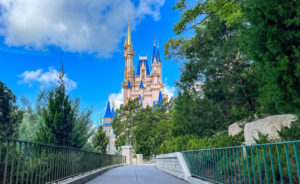
Okay, here are Magic Kingdom’s average wait times for the past week:
- Seven Dwarfs Mine Train – 91 minutes, up 1
- Peter Pan’s Flight – 78 minutes, down 4
- Space Mountain – 72 minutes, up 8
- Jungle Cruise – 54 minutes, no change
- Haunted Mansion – 50 minutes, up 2
- Big Thunder Mountain Railroad – 49 minutes, up 10
- Buzz Lightyear’s Space Ranger Spin – 46 minutes, down 3
- Pirates of the Caribbean – 43 minutes, up 4
- Princess Fairytale Hall – 42 minutes, up 2
- The Many Adventures of Winnie the Pooh – 40 minutes, down 1
- Town Square Theater – 40 minutes, down 1
- Ariel’s Grotto – 38 minutes, no change
- Astro Orbiter – 36 minutes, up 1
- It’s a Small World – 32 minutes, up 1
- Pete’s Silly Sideshow – 32 minutes, no change
- Enchanted Tales with Belle – 30 minutes, up 1
- Under the Sea ~ Journey of the Little Mermaid – 26 minutes, down 4
- Tomorrowland Speedway – 25 minutes, down 2
- The Barnstormer – 23 minutes, up 2
- Dumbo the Flying Elephant – 20 minutes, up 4
- Magic Carpets of Aladdin – 19 minutes, no change
- Mickey’s PhilharMagic – 18 minutes, no change
- Monsters, Inc. Laugh Floor – 17 minutes, no change
- Mad Tea Party – 15 minutes, up 2
- Tomorrowland Transit Authority PeopleMover – 14 minutes, down 1
- Walt Disney World Railroad – 14 minutes, no change
- Prince Charming Regal Carrousel – 11 minutes, no change
- Country Bear Jamboree – 5 minutes, no change
- Walt Disney’s Carousel of Progress – 5 minutes, no change
Final Thoughts
Photo: Disney
Overall, Magic Kingdom guests stood in line for 33 minutes, which is one minute more than last time.
So, I can state that this week was a bit more crowded than last week.
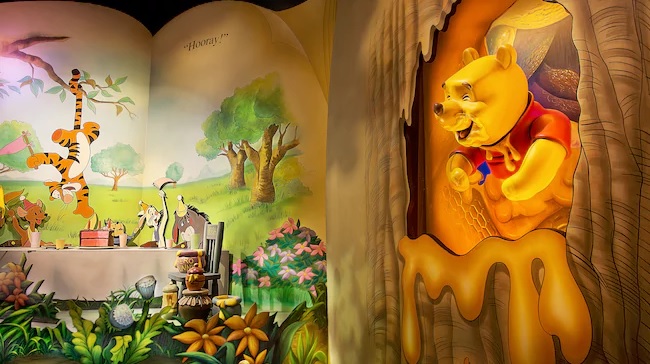
Image Credit: Disney
However, there’s a big-picture element I rarely bring into the conversation. It probably matters right now.
Last year, Walt Disney World’s four parks averaged a composite wait of 45 minutes per attraction.
For the same week in July 2023, that average has dropped to 39 minutes per attraction.
Photo:visitorlando.com
While some factors like higher staffing and more efficient attraction queue maintenance may explain part of him, Occam’s Razor applies.
As Disney officials had expected all along, park attendance has fallen a bit from 2022 to 2023, at least during the first half of July.
Photo: MickeyBlog
Thanks for visiting MickeyBlog.com! Want to go to Disney? For a FREE quote on your next Disney vacation, please fill out the form below, and one of the agents from MickeyTravels, a Diamond Level Authorized Disney Vacation Planner, will be in touch soon!
Feature Photo: Disney