Walt Disney World Wait Times for July 4th Week 2023
What if we threw a holiday, but nobody showed up at a theme park?
That’s the weird question the industry faced during the past week.


Photo: Playbuzz.com
As I discussed in detail here, several theme parks, including Walt Disney World and Universal Orlando Resort, experienced their lowest July 4th attendance in a decade.
I should add that the temperature was scorching, with Orlando’s heat index crossing 110 degrees, and July 4th fell on a Tuesday.

Still, the whole thing was weird, and I’m really looking forward to this deep dive regarding whether that behavior lasted all week.
Here are the average Walt Disney World wait times for the week of July 4th, 2023.
Disney’s Animal Kingdom


Photo: Disney
I’ll start with an odd fact about theme park attendance estimates, especially at Walt Disney World.
Since 2018, Disney really hasn’t experienced anything we’d describe as a typical year.
In 2019, everyone anticipated Star Wars: Galaxy’s Edge, which led to a fascinating phenomenon.


Photo: Matt Stroshane
The time before that themed land’s debut was slow, while the first three months of Galaxy’s Edge were considered underwhelming.
Few guests wanted to visit Disney before the immersive new land opened. Then, they didn’t want to fight the crowds during those first few weeks.
So, Galaxy’s Edge crowds surprised throughout 2019, including a shockingly crowded fall/winter.


Then, we know what happened with the pandemic in 2020 and 2021. By 2022, the old playbook no longer applied.
I’ve somewhat ignored it during previous wait time analysis, probably to my detriment.


Last year, crowds peaked during the middle of June rather than in July. I dismissed that as an aspect of Revenge Travel. It may not have been…
I’ll sprinkle in an explanation as we discuss the first three parks. For now, here are the average waits at Animal Kingdom last week:
- Avatar Flight of Passage – 97 minutes, up 1
- Na’vi River Journey – 69 minutes, up 1
- Kali River Rapids – 46 minutes, up 1
- Adventurers Outpost – 40 minutes, up 1
- DINOSAUR – 38 minutes, down 5
- Expedition Everest – 34 minutes, up 2
- Kilimanjaro Safaris – 30 minutes, down 5
- It’s Tough to Be a Bug! – 10 minutes, down 3
- TriceraTop Spin – 9 minutes, no change


Photo: Disney
Overall, guests at Animal Kingdom waited an average of 44 minutes per attraction, which is one minute more than last time.
You may wonder how that’s possible, but the answer is simple.
Slow for a holiday week is still crowded compared to any other time on the annual calendar.
Disney’s Hollywood Studios
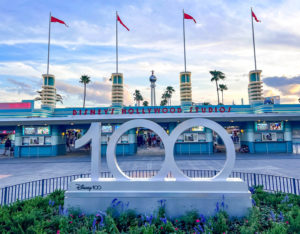

The behavior at Animal Kingdom doesn’t surprise me in that the small number of rides inflates the wait times.
At Hollywood Studios, a different story unfolds. Its show-based attractions provide guests with a welcome respite on a hot day.
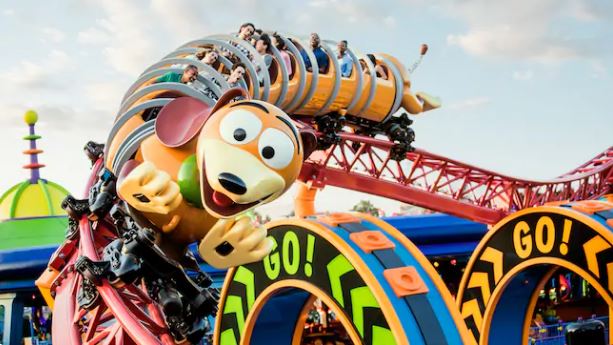

Credit: Disney
Meanwhile, some of the outdoor rides like Slinky Dog Dash grow less appealing. The numbers will bear this out.
- Slinky Dog Dash – 85 minutes, down 15
- Star Wars – Rise of the Resistance – 83 minutes, down 15
- Millennium Falcon: Smugglers Run – 66 minutes, down 2
- Rock ‘n’ Roller Coaster Starring Aerosmith – 66 minutes, down 8
- Mickey & Minnie’s Runaway Railway – 61 minutes, down 2
- Toy Story Mania! – 57 minutes, down 8
- Twilight Zone Tower of Terror – 49 minutes, down 3
- Alien Swirling Saucers – 37 minutes, no change
- Red Carpet Dreams – 37 minutes, down 1
- Star Tours – The Adventures Continue! – 19 minutes, down 4
- Celebrity Spotlight – 18 minutes, up 1
- Lightning McQueen’s Racing Academy – 17 minutes, up 1
- Muppet*Vision 3D – 10 minutes, no change


Toy Story Mania
Overall, guests stood in line for an average of 42 minutes per attraction. That’s four minutes less than the previous week.
I believe Hollywood Studios encapsulates the most recent week at Walt Disney World better than Animal Kingdom did.
EPCOT
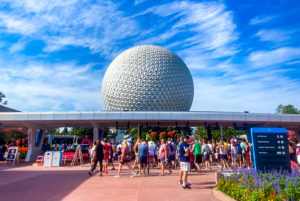

I expect that the other two parks will follow this pattern, although EPCOT may yet surprise me.
Here are this park’s wait times for the week of July 4th:
- Frozen Ever After – 68 minutes, down 3
- Test Track – 66 minutes, down 3
- Remy’s Ratatouille Adventure – 65 minutes, up 1
- Soarin’ Around the World – 34 minutes, down 8
- Mission: SPACE – 30 minutes, up 3
- Royal Sommerhus – 27 minutes, down 3
- Spaceship Earth – 18 minutes, no change
- Turtle Talk with Crush – 18 minutes, down 1
- Journey into Imagination with Figment – 13 minutes, down 1
- The Seas with Nemo & Friends – 12 minutes, down 4
- Living with the Land – 11 minutes, down 2
- Gran Fiesta Tour Starring the Three Caballeros – 11 minutes, down 1


Photo: Disney
So, everything at EPCOT decreased its wait times from the previous week.
Overall, EPCOT guests waited 30 minutes per attraction, which is three minutes less than last time.
Part of this is undeniably the calendar configuration. With the government holiday on Monday, many people returned to work on Wednesday.


Credit: Disney
Also, as I’ve mentioned, some guests have listened to the pro tip to skip Walt Disney World during the week of July 4th.
For this reason, those who ignored the advice experienced a shockingly empty set of parks this past week…thereby negating the value of that pro tip.
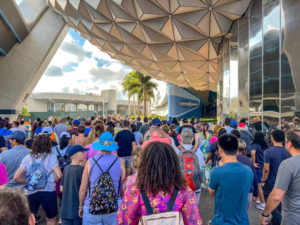

Crowds heading into EPCOT!
Has Disney altered its behavior to the point that June is now the most crowded time of the year?
I don’t have a finite answer to that question yet, but when something happens two straight years, I start to wonder.
Magic Kingdom


Photo: Disney
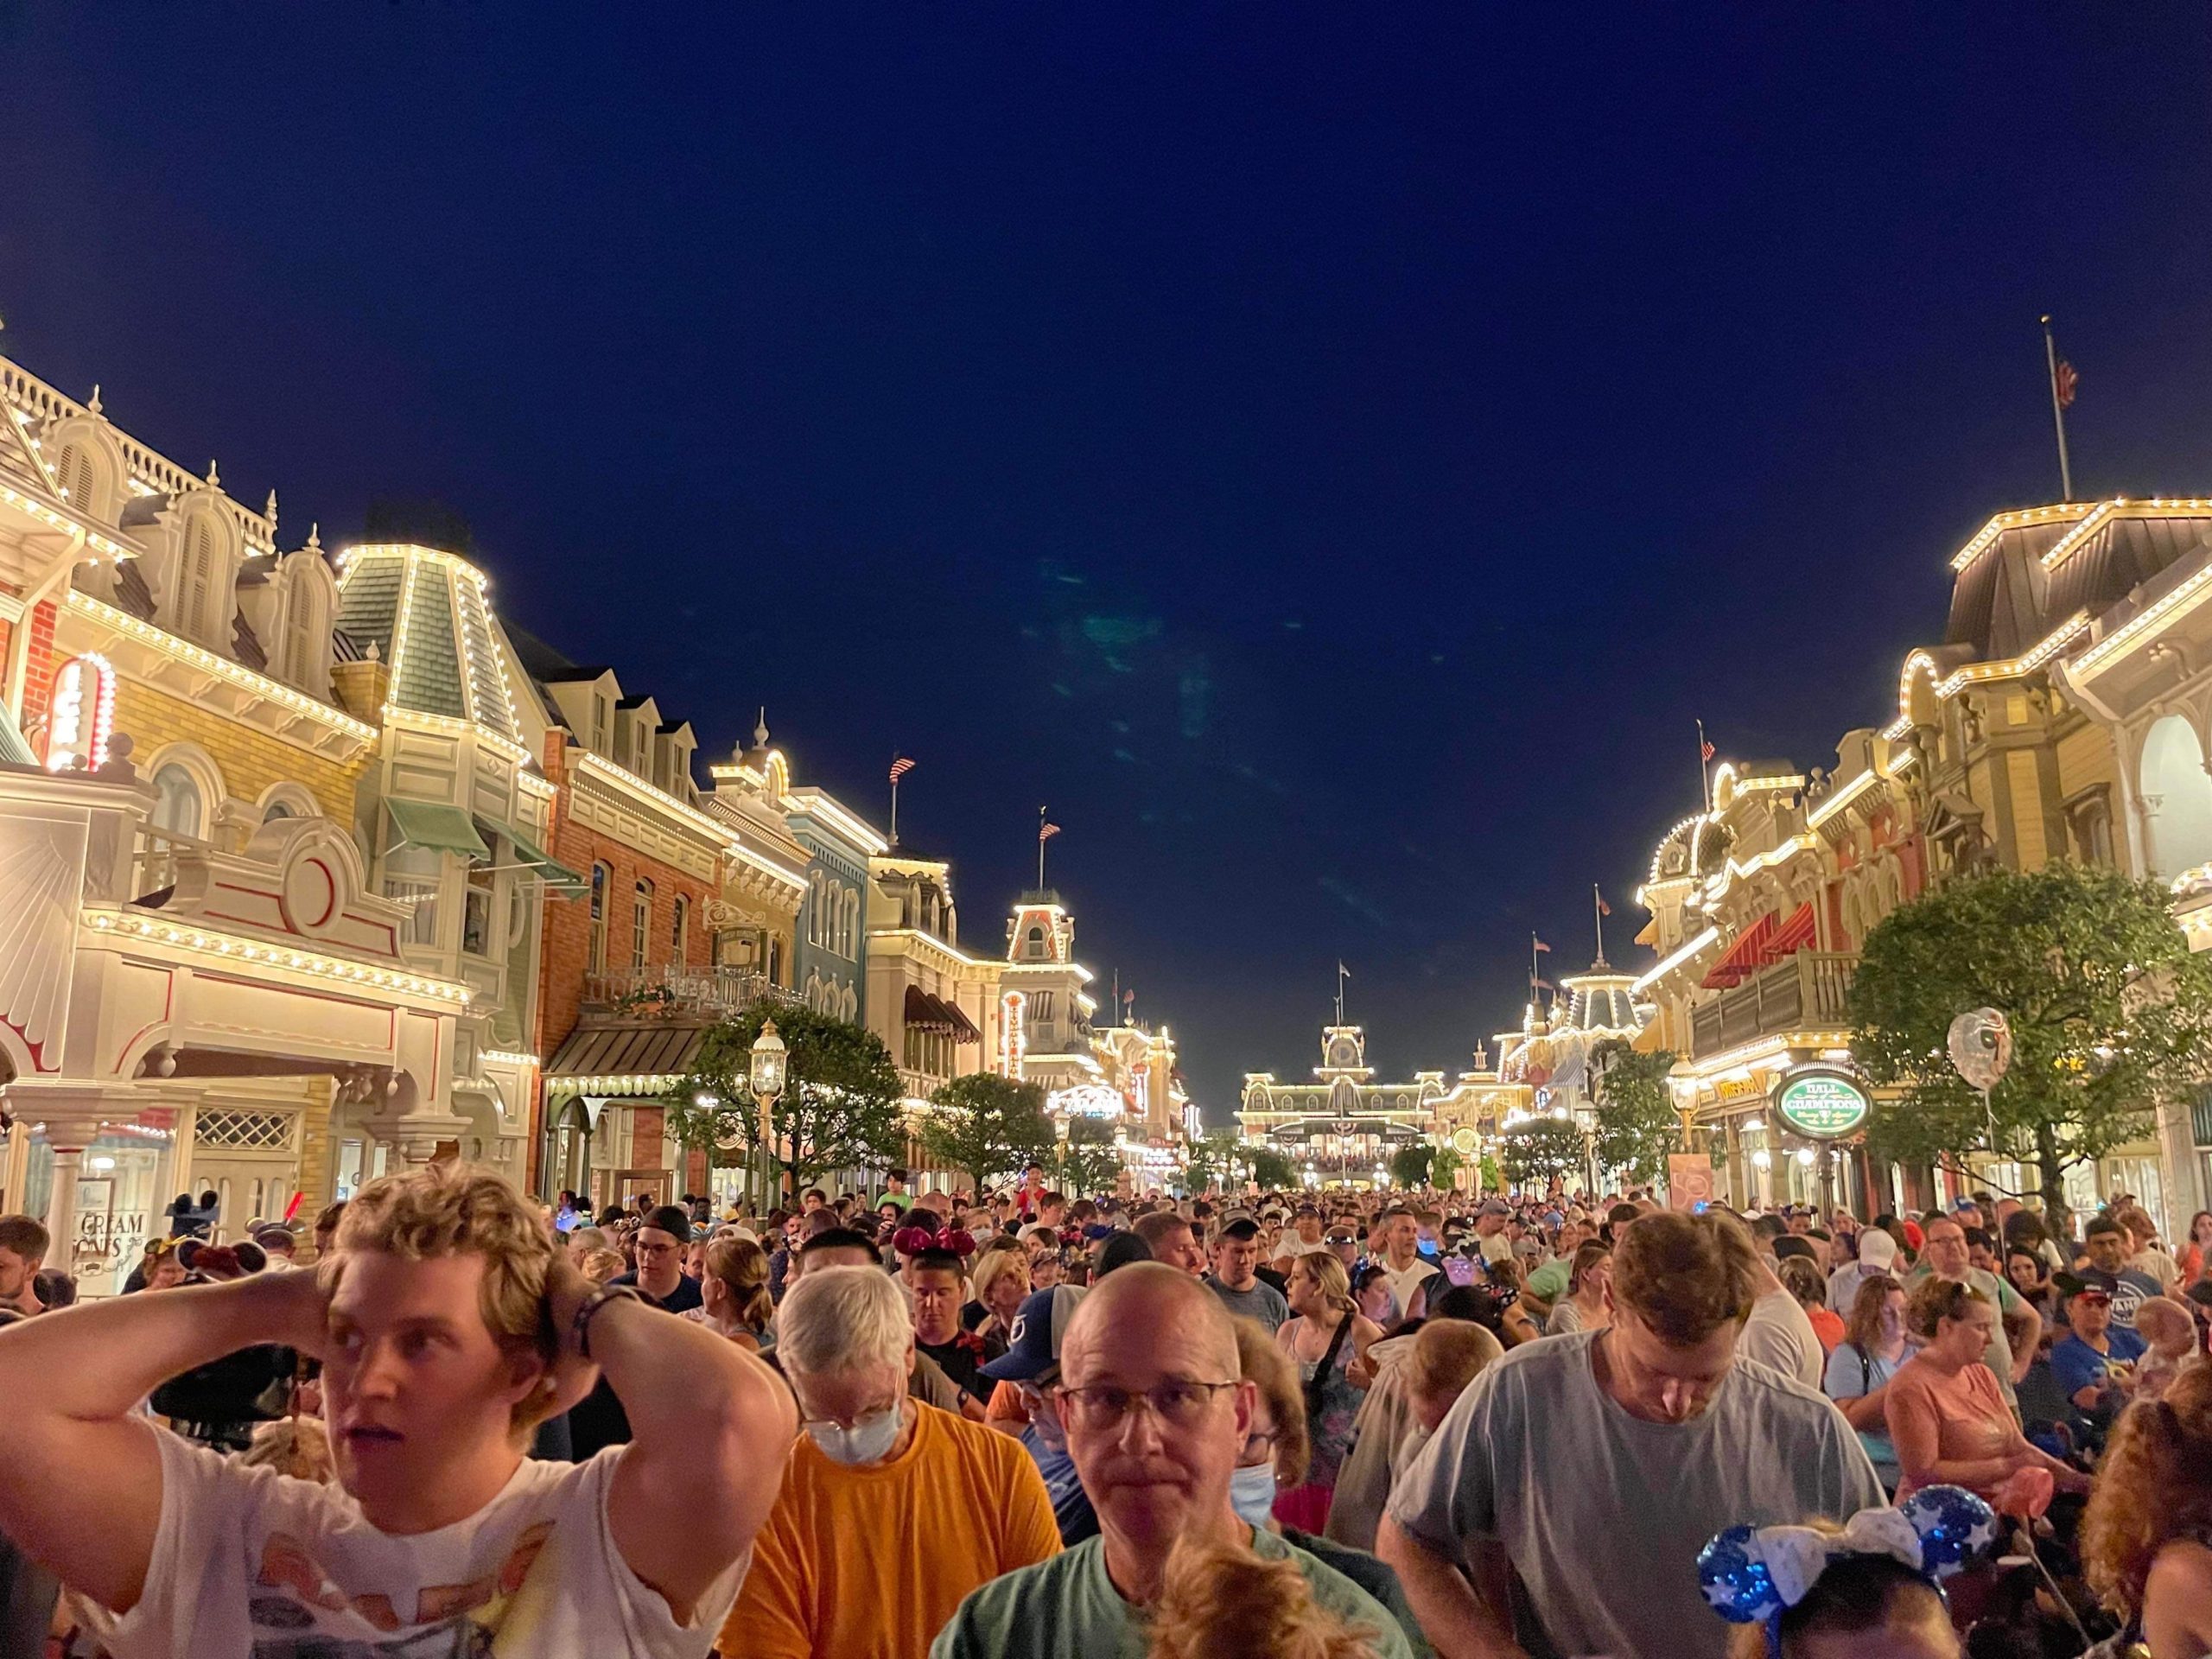
Did the trend continue at Magic Kingdom? Based on the crowd pictures from our wonderful park reporters, that answer is probably yes…but let’s check!
Here are the park’s average wait times for the previous week:
- Seven Dwarfs Mine Train – 90 minutes, down 1
- Peter Pan’s Flight – 82 minutes, up 6
- Space Mountain – 64 minutes, up 4
- Jungle Cruise – 54 minutes, down 4
- Buzz Lightyear’s Space Ranger Spin – 49 minutes, up 3
- Haunted Mansion – 48 minutes, down 1
- The Many Adventures of Winnie the Pooh – 41 minutes, up 2
- Town Square Theater – 41 minutes, up 3
- Princess Fairytale Hall – 40 minutes, down 2
- Big Thunder Mountain Railroad – 39 minutes, down 1
- Pirates of the Caribbean – 39 minutes, down 3
- Ariel’s Grotto – 38 minutes, up 3
- Astro Orbiter – 35 minutes, up 2
- Pete’s Silly Sideshow – 32 minutes, no change
- It’s a Small World – 31 minutes, no change
- Under the Sea ~ Journey of the Little Mermaid – 30 minutes, down 1
- Enchanted Tales with Belle – 29 minutes, up 1
- Tomorrowland Speedway – 27 minutes, up 4
- The Barnstormer – 21 minutes, down 1
- Magic Carpets of Aladdin – 19 minutes, down 2
- Mickey’s PhilharMagic – 18 minutes, up 1
- Monsters, Inc. Laugh Floor – 17 minutes, down 1
- Dumbo the Flying Elephant – 16 minutes, down 1
- Tomorrowland Transit Authority PeopleMover – 15 minutes, up 1
- Walt Disney World Railroad – 14 minutes, up 1
- Mad Tea Party – 13 minutes, down 1
- Prince Charming Regal Carrousel – 11 minutes, no change
- Country Bear Jamboree – 5 minutes, no change
- Walt Disney’s Carousel of Progress – 5 minutes, no change
Final Thoughts
Overall, guests at Magic Kingdom waited an average of 32 minutes per attraction, which is one minute more than last time.


Photo: DIsney
When we combine all four parks, the average wait time fell one minute during a holiday week, which isn’t something I’d expect.
However, this behavior does lend credence to the thought that summer crowds arrive at Walt Disney World around June 15th.

Crowds at Magic Kingdom
From that point until around August 10th, the traffic maintains rather than spikes and dips.
We’ll track this phenomenon during the next five weeks of wait time articles, but that’s what I’m seeing thus far in 2023.
This behavior tracks with what happened last summer as well.


Photo: MickeyBlog
Thanks for visiting MickeyBlog.com! Want to go to Disney? For a FREE quote on your next Disney vacation, please fill out the form below, and one of the agents from MickeyTravels, a Diamond Level Authorized Disney Vacation Planner, will be in touch soon!
Feature Photo: Disney


