Walt Disney World Wait Times for First Week of January 2022
Okay, we have theoretically survived the worst at Disney theme parks.
With the holidays over, crowds should go down quite a bit, as few people travel to the parks in early January.
That’s conventional wisdom anyway. So, did the past week prove it right? Here are the Walt Disney World wait times for the first week of January 2022.
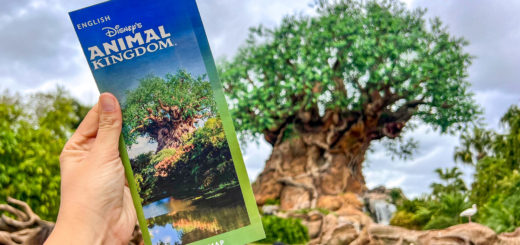
Disney’s Animal Kingdom
My suspicion for Disney this week is that the most crowded attractions will stay that way. Everything else should decline dramatically.
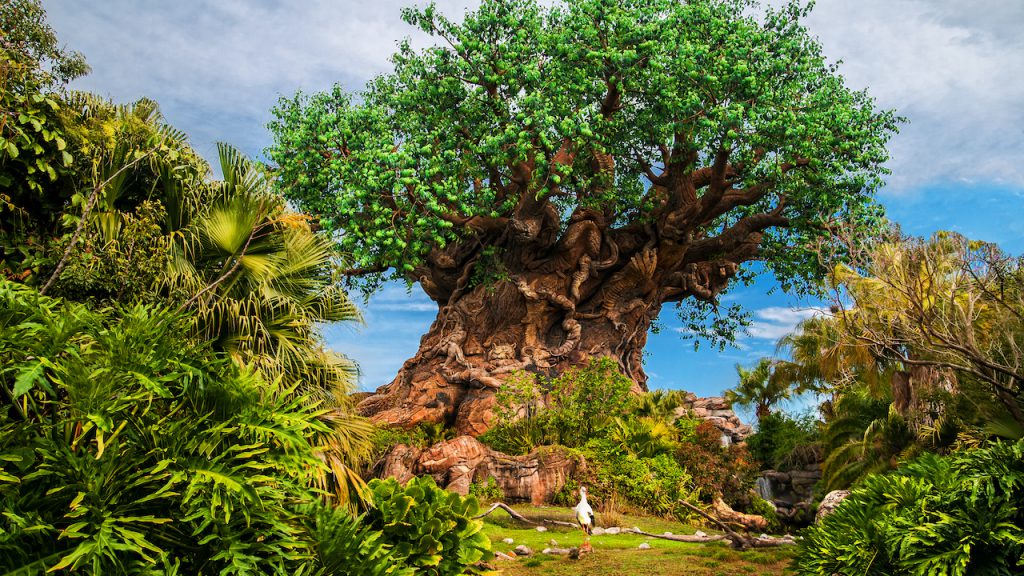
Photo: Disney
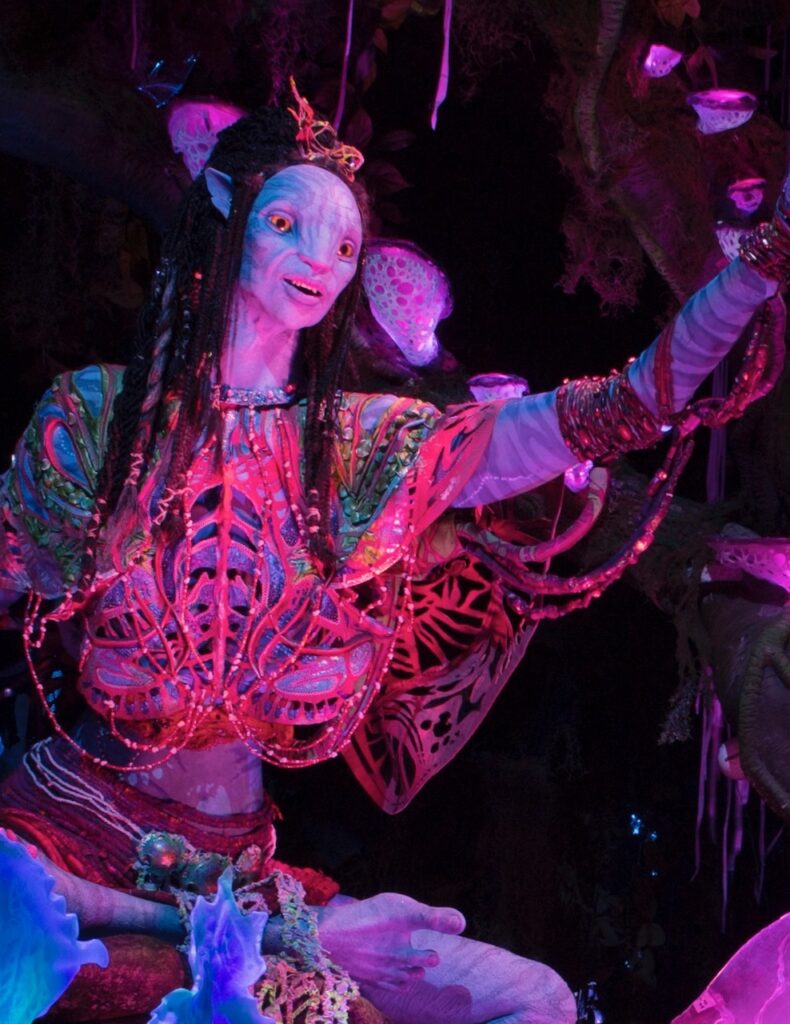
We can test that theory right off the bat with Avatar Flight of Passage. The most popular attraction at Animal Kingdom averaged a wait of 89 minutes.
While an hour and a half in line is never great, that is a drop of 55 minutes. So, we’ve improved by nearly an hour.
(Kent Phillips, photographer)
At Na’vi River Journey, you needed 60 minutes in line to ride. That’s down 18 minutes from last week.
So, we’re definitely witnessing signs of lower crowds. But did that hold true for the rest of the park? In the immortal words of Professor Farnsworth, “Oh my yes.”
Image: Futurama
Take a gander at these waits:
- Kilimanjaro Safaris – 45 minutes, down 39 (!)
- DINOSAUR – 34 minutes, down 26
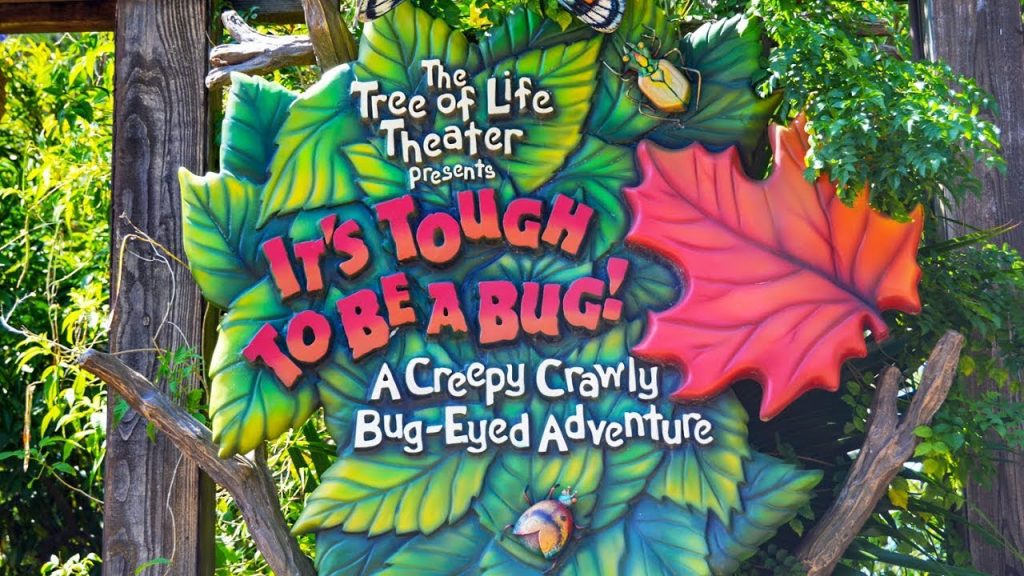
- It’s Tough to Be a Bug! – 12 minutes, down 6
- TriceraTop Spin – 8 minutes, down 15 (!)
- Kali River Rapids – 7 minutes, down 8
Have I mentioned it’s cold in Florida right now? Yeah, if you’re riding Kali River Rapids, you’re a diehard fan!
Anyway, the average Animal Kingdom attraction came with a wait of 35 minutes, down 24 minutes from New Year’s week!
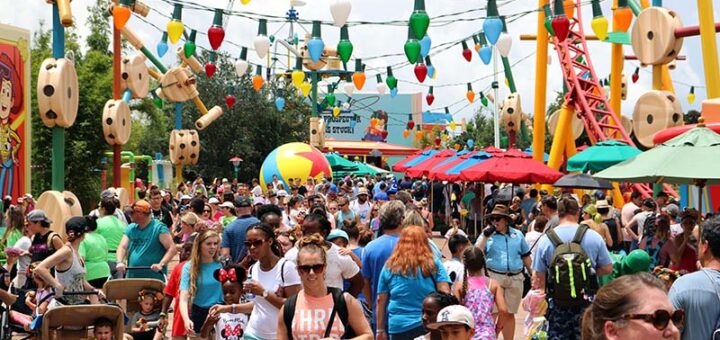
Disney’s Hollywood Studios
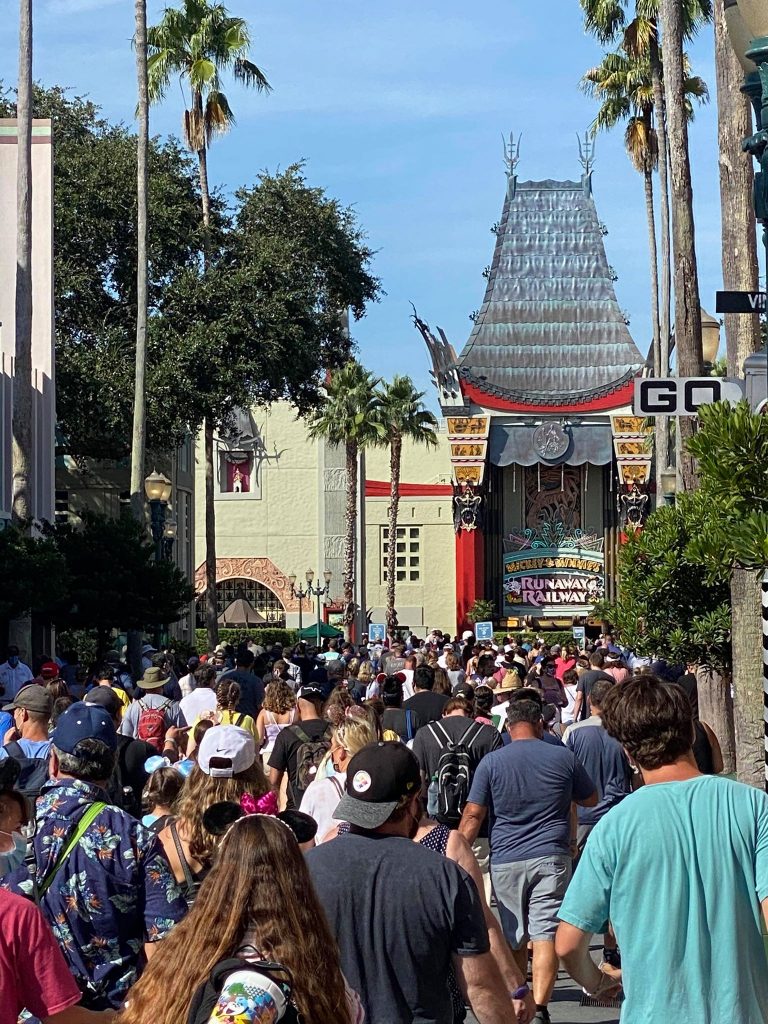
The one park that could wreck everything is Hollywood Studios, the place with the most new E-ticket attractions.
As usual, Star Wars: Rise of the Resistance had the longest lines. However, the 115-minute wait last week indicates a drop of 47 minutes!
Meanwhile, Slinky Dog Dash came with an 81-minute wait, down 26 minutes.
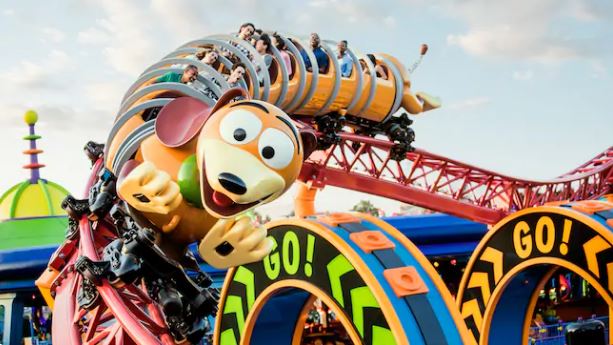
Credit: Disney
Thus far, the supposition appears accurate. The popular rides maintained long lines, but the waits weren’t as long as during the holidays.
Here’s everything else at Hollywood Studios:
- Mickey & Minnie’s Runaway Railway – 70 minutes, down 9
- Rock ‘n’ Roller Coaster Starring Aerosmith – 65 minutes…when it worked
- Toy Story Mania! – 60 minutes, down 11
- Millennium Falcon: Smugglers Run – 58 minutes, down 33
- Twilight Zone Tower of Terror – 50 minutes, down 26
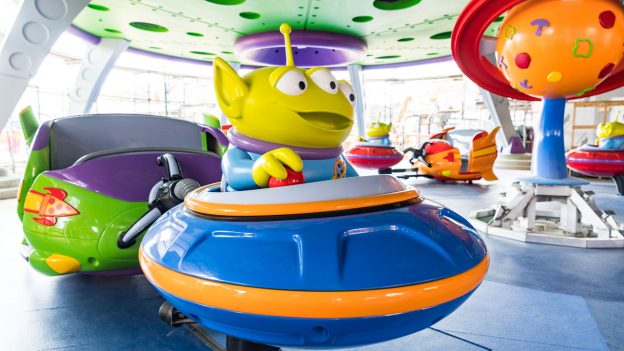
- Alien Swirling Saucers – 44 minutes, no change
- Star Tours – The Adventures Continue – 25 minutes, down 12
- Lightning McQueen’s Racing Academy – 15 minutes, no change
- Muppet*Vision 3D – 10 minutes, down 2
The average Hollywood Studios attraction required a wait of 45 minutes, down 14 minutes from last time.
By the way, I joked about Rock ‘n’ Roller Coaster, but I’m also serious. The ride’s uptime was so sporadic this past week that I almost excluded it.
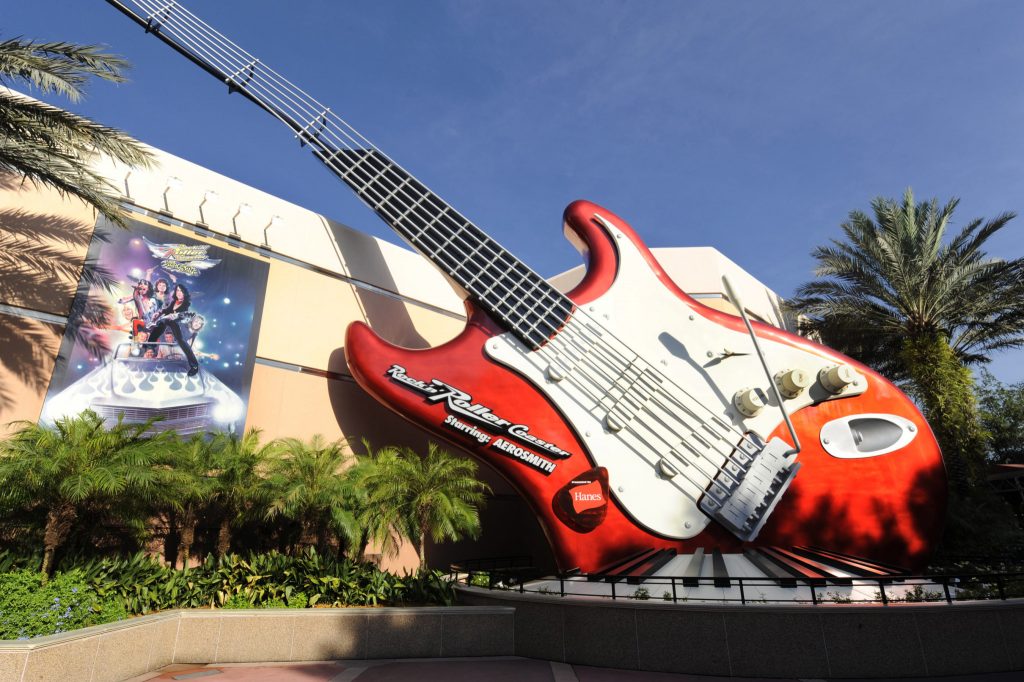
Photo: Disney
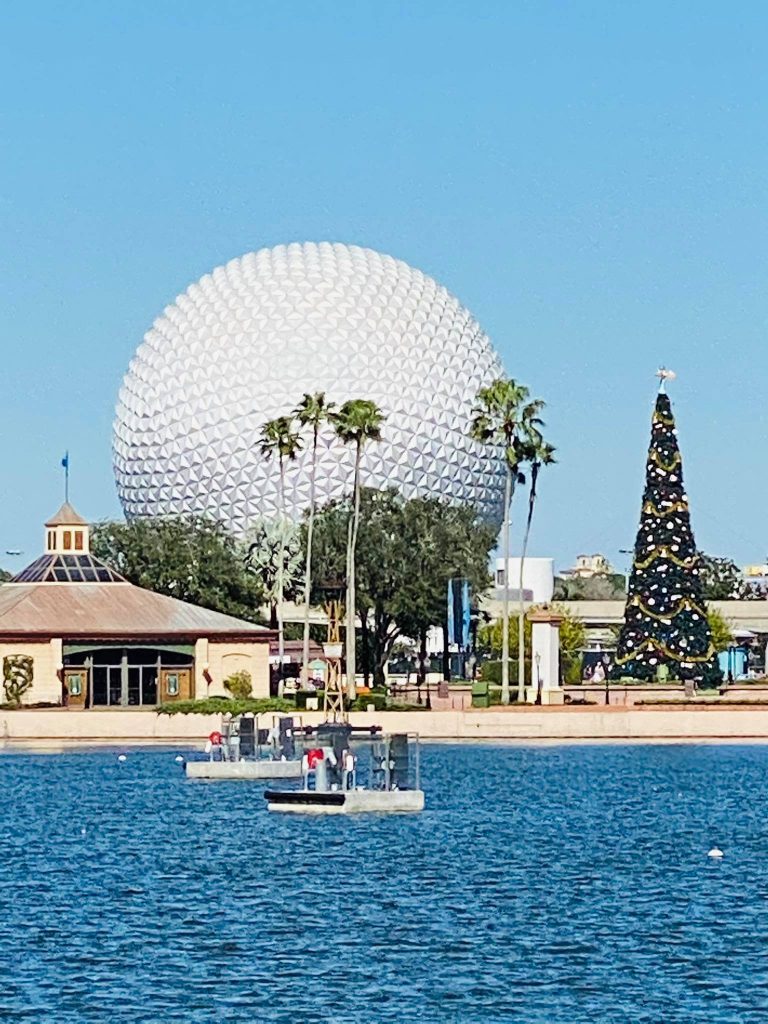
EPCOT
Okay, something significant has changed at EPCOT, and it’s going to force me to change my vernacular.
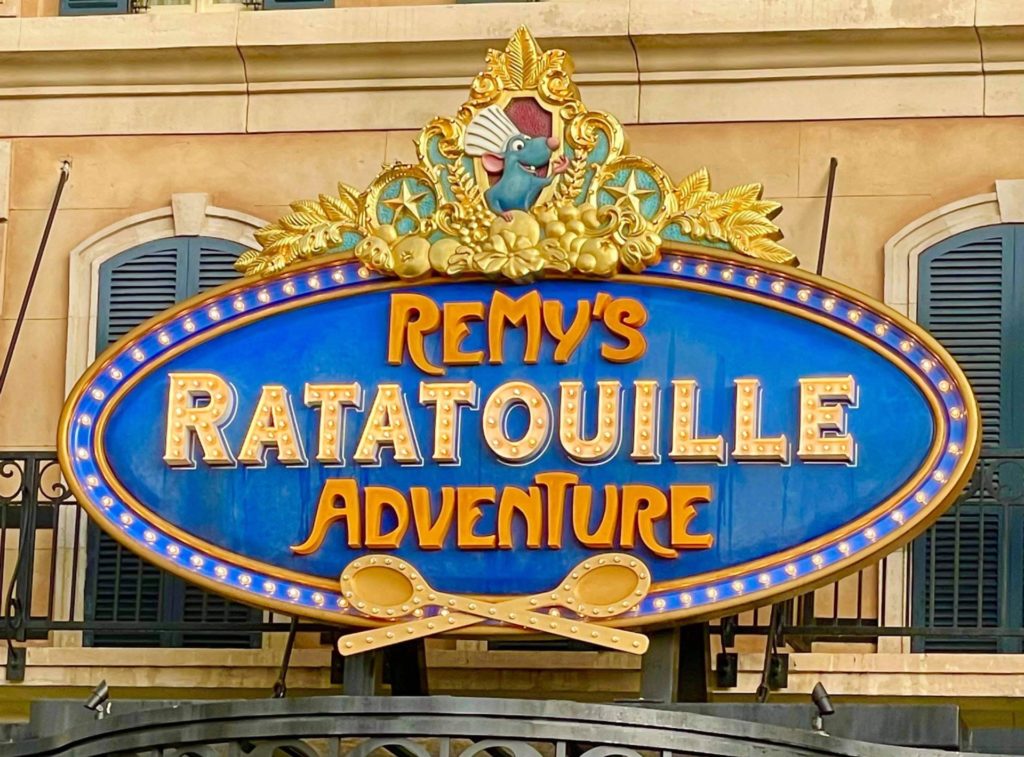
EPCOT no longer uses virtual queuing for Remy’s Ratatouille Adventure. Instead, it employs a standby queue, just like everything else at the park.
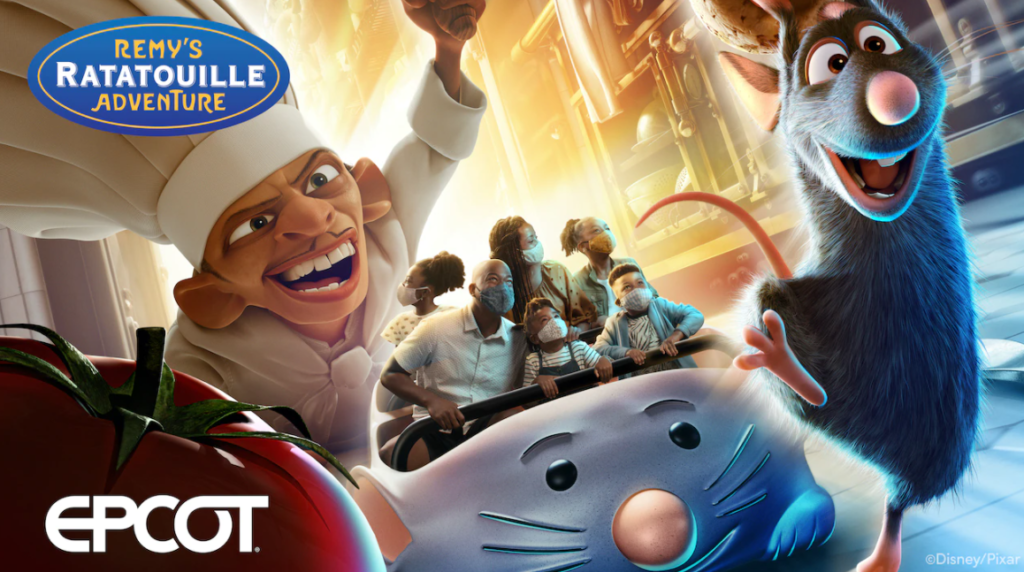
However, this process only started on January 10th, which means our data is for…just one day.
So, please consider this a placeholder for now. Next week, we will fill in the blanks about average wait times on Walt Disney World’s newest ride.
I will add that when I checked earlier today, the wait was only…40 minutes. Now, that was in the late afternoon on a Tuesday.
I’m optimistic that the numbers here won’t be substantially worse than what we expect at the top EPCOT rides.
Image Credit: Disney
Speaking of which, Frozen Ever After averaged a 63-minute wait last week, a 25-minute drop.
Meanwhile, Test Track hovered at 44 minutes, down 25 minutes from last time.
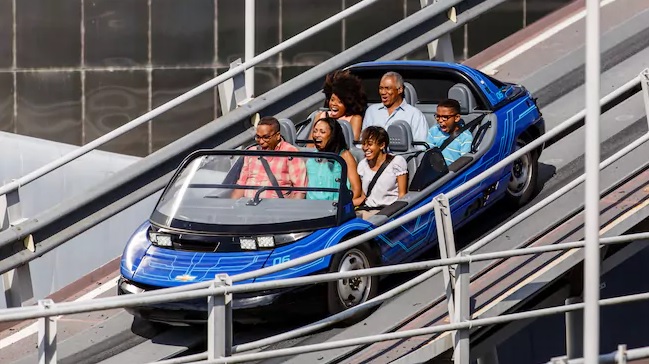
Image Credit: Disney
Here are the rest of EPCOT’s attractions:
- Soarin’ – 28 minutes, down 22
- The Seas with Nemo & Friends – 12 minutes, down 13
- Mission: SPACE – 10 minutes, down 25
- Turtle Talk with Crush – 10 minutes, no change
- Gran Fiesta Tour Starring the Three Caballeros – 9 minutes, down 6
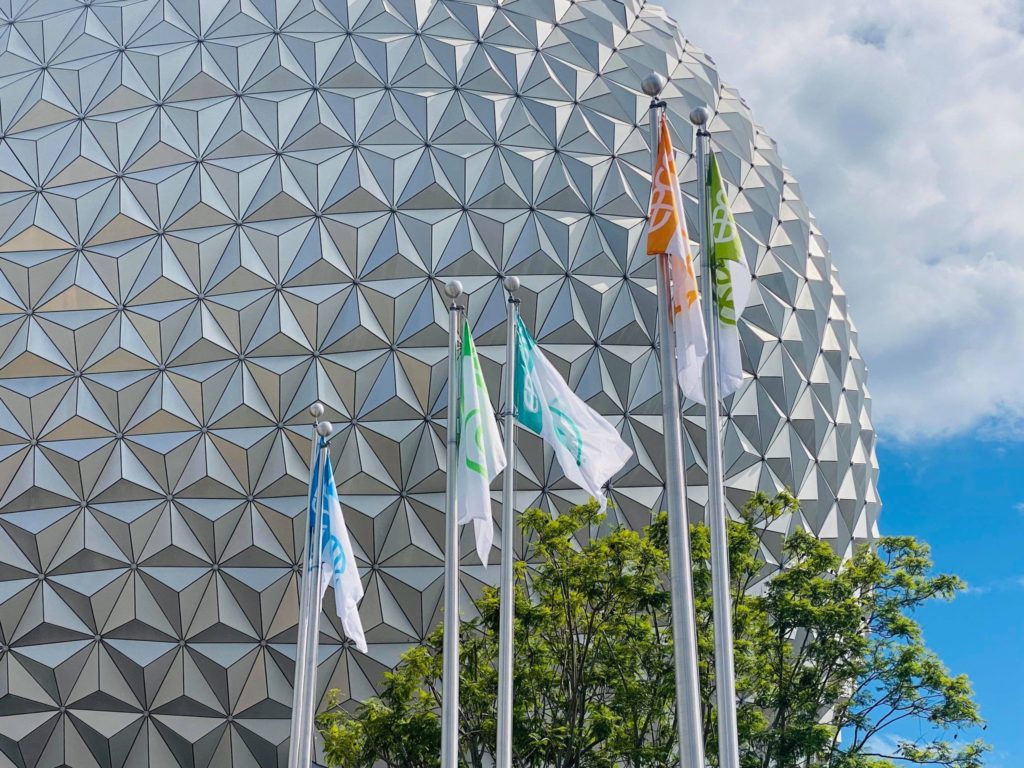
- Spaceship Earth – 9 minutes, down 22 (!)
- Living with the Land – 8 minutes, down 8
- Journey into Imagination with Figment – 7 minutes, down 9
Overall, EPCOT attractions averaged a 22-minute wait. That’s down 14 minutes from only a week ago.
You’ll have a lot of fun at EPCOT right now, my friends.
Magic Kingdom
Okay, we’ve only got one park to go. Here are the average wait times at Magic Kingdom for the past week:
- Seven Dwarfs Mine Train – 95 minutes, down 16
- Jungle Cruise – 82 minutes, down 7
- Peter Pan’s Flight – 78 minutes, down 19
- Space Mountain – 67 minutes, down 6
- Haunted Mansion – 55 minutes, down 8
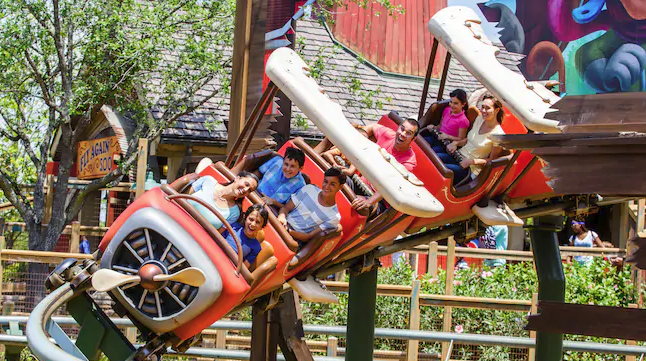
- Big Thunder Mountain Railroad – 52 minutes, down 11
- Pirates of the Caribbean – 45 minutes, down 10
- Buzz Lightyear’s Space Ranger Spin – 43 minutes, down 14
- The Many Adventures of Winnie the Pooh – 43 minutes, down 4
- Astro Orbiter – 42 minutes, down 7
- It’s a Small World – 40 minutes, down 5
- Under the Sea ~ Journey of the Little Mermaid – 36 minutes, down 6
- The Barnstormer – 30 minutes, down 10
- Dumbo the Flying Elephant – 29 minutes, down 9
- The Magic Carpets of Aladdin – 29 minutes, down 7
- Tomorrowland Speedway – 27 minutes, down 15
- Tomorrowland Transit Authority PeopleMover – 23 minutes, down 6
- Princess Fairytale Hall – 22 minutes, down 8
- Prince Charming Regal Carrousel – 21 minutes, no change
- Mad Tea Party – 20 minutes, down 6
- Monsters, Inc. Laugh Floor – 18 minutes, down 6
- Mickey’s PhilharMagic – 17 minutes, down 6
- Town Square Theatre – 12 minutes, down 2
- Walt Disney’s Carousel of Progress – 5 minutes, down 2
The average Magic Kingdom ride came with a wait of 38 minutes, down nine minutes from last time.
To a larger point, every ride at Walt Disney World either held its previous wait or dropped from last time.
The holidays are over, my friends! Disney’s back to normal!
Next week may skew the data a bit, though. Ratatouille will count for the first time, and it’s the opening week of the EPCOT International Festival of the Arts.
FEATURE IMAGE: PassportToTheParks.com