Walt Disney World Wait Times for Pre-Spring Break 2023
Who’s ready for story time with David?
A buddy of mine asked me when to visit Walt Disney World, and I told him, “Not Spring Break.”
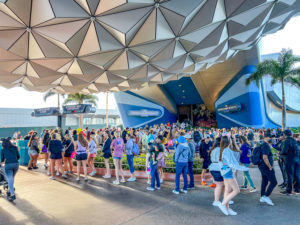
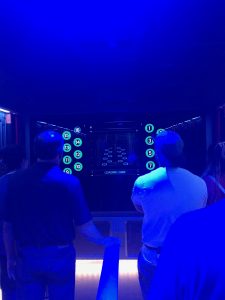
Spaceship Earth
This week is widely accepted as Spring Break across North America…and yes, he took his family anyway.
As a Canadian, he needed a connecting flight to reach Orlando.

Credit: Breeze Airways
The instant his family touched down from its first flight, the flight board showed that the second flight had been canceled.
As you might imagine, about 100 people from that flight were on their way to Walt Disney World.
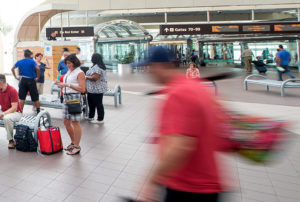
Image: OrlandoAirports.net
So, no matter how bad a week you ever have, remember this.
Some poor airline employee had to tell dozens of families they’d need to wait another day to reach Orlando. You can guess how well those conversations went.

Image: OrlandoAirports.net
Meanwhile, a bunch of parents of small children got stuck in a strange town with some VERY disgruntled kids. And they’re not even to Disney yet!
Once they arrive, these folks will discover some of the longest theme park lines of the first half of 2023.
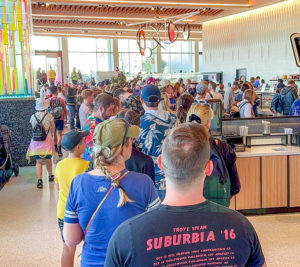
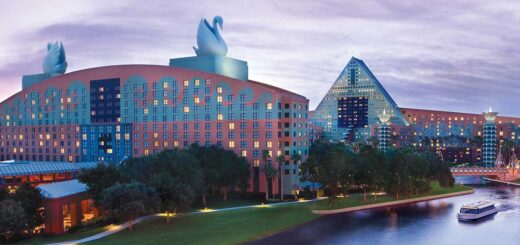
Maybe grab a cup of Joe at your resort before you get to the parks!
We’ll show that to an extent this week and probably more so next time.
Here are the Walt Disney World wait times for the start of Spring Break 2023!
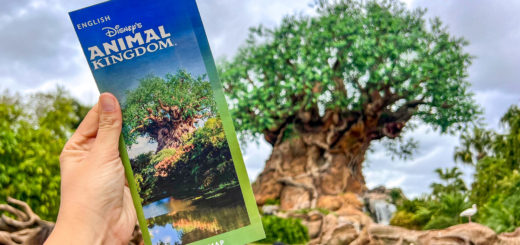
Disney’s Animal Kingdom
I expect wait times to increase some this week.
However, only two days we’re covering include that Spring Break impact. So, we shouldn’t track massive changes this week. If we do, UH OH!
Flight of Passage
Thankfully, Avatar Flight of Passage “only” increased by 12 minutes from the last time. During the start of Spring Break, guests waited an average of 82 minutes.
At Na’vi River Journey, the growth is insignificant. People stood in line for 63 minutes, which is only three minutes more than last time.

Photo: Disney
Here are the other wait times for Animal Kingdom this past week:
- Kilimanjaro Safaris – 44 minutes, up 4
- Adventurers Outpost – 41 minutes, up 2
- Expedition Everest – 33 minutes, up 11
- Kali River Rapids – 25 minutes, up 7
- DINOSAUR – 24 minutes, up 3
- It’s Tough to Be a Bug! – 10 minutes, no change
- TriceraTop Spin – 9 minutes, no change
Photo: Disney
Overall, guests waited for an average of 38 minutes per attraction. That’s five minutes or 15 percent more. We’ll track this trend at the other three parks.
Disney’s Hollywood Studios
Photo credit: DisneyWorldVacationGuide.com
I mentioned last week that a friend had timed his Hollywood Studios trip perfectly.
He did everything at the park in a day, which is tough to manage in 2023.
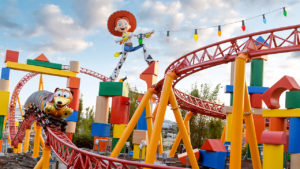
Image Credit: Disney
Guests this past week weren’t as fortunate, as you’re about to see. Here are the average waits at Hollywood Studios:
- Slinky Dog Dash – 96 minutes, up 15
- Star Wars: Rise of the Resistance – 93 minutes, up 13
- Millennium Falcon: Smugglers Run – 75 minutes, up 19
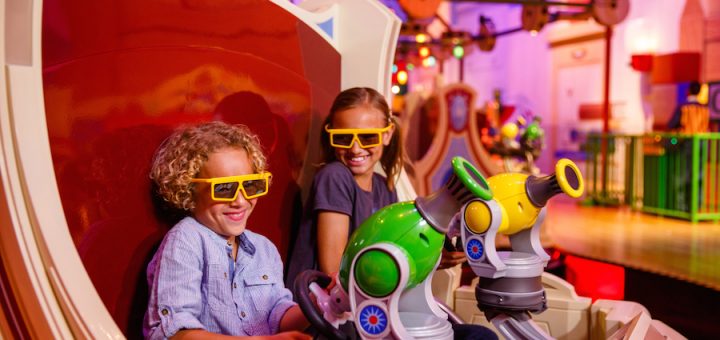
- Toy Story Mania! – 68 minutes, up 13
- Mickey & Minnie’s Runaway Railway – 66 minutes, up 4
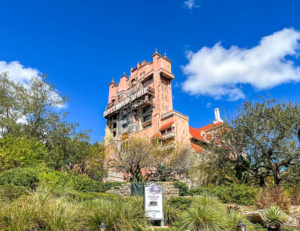
- Twilight Zone Tower of Terror – 65 minutes, up 20
- Alien Swirling Saucers – 40 minutes, up 5
- Red Carpet Dreams – 38 minutes, down 2
- Meet Sulley at Walt Disney Presents – 30 minutes, down 1
- Star Tours – The Adventures Continue! – 22 minutes, up 8
- Celebrity Spotlight – 20 minutes, no change
- Lightning McQueen’s Racing Academy – 15 minutes, no change
- Muppet*Vision 3D – 10 minutes, no change
At Hollywood Studios, guests stood in line for an average of 45 minutes per attraction. That’s five minutes or 12.5 percent more than last time.
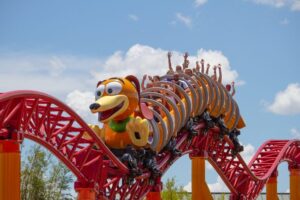
Photo: TheCoasterKings.com
Notably, Slinky Dog Dash has required the longest wait for two straight weeks.
Also, Tower of Terror operating at full capacity has reduced its wait times…but not by as much as I would have hoped.
Across the two parks, only one attraction, the character interaction at Red Carpet Dreams, has lowered its average wait from last week.
So, yes, Spring Break is definitely having an impact.
EPCOT
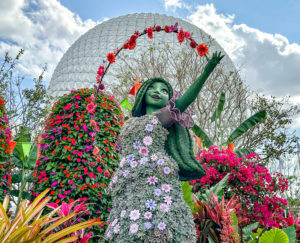
We’re also barely a week into the EPCOT International Flower & Garden Festival.
For this reason, EPCOT crowds should be larger than usual. Were they? Let’s check in on the average wait times:
- Remy’s Ratatouille Adventure – 75 minutes, up 10
- Frozen Ever After – 73 minutes, up 3
- Test Track – 63 minutes, up 9
- Soarin’ Around the World – 45 minutes, up 11
- Royal Sommerhus – 33 minutes, down 5
- Mission: SPACE – 24 minutes, up 4
- Spaceship Earth – 19 minutes, up 5
- Turtle Talk with Crush – 16 minutes, up 1
- The Seas with Nemo & Friends – 14 minutes, up 2
- Gran Fiesta Tour Starring the Three Caballeros – 13 minutes, up 1
- Living with the Land – 12 minutes, up 1
- Journey into Imagination with Figment – 11 minutes, up 1
Overall, EPCOT attractions required an average wait of 33 minutes, which is three minutes or 10 percent more than last week. Honestly, that’s not bad at all.
Magic Kingdom

Ariel’s Grotto
Lately, Magic Kingdom’s depth of high-quality attractions has helped its wait times remain reasonable relative to the rest of Walt Disney World.
Was that the cast this past week? Well, here are Magic Kingdom’s average waits:
- Seven Dwarfs Mine Train – 90 minutes, up 15
- Peter Pan’s Flight – 75 minutes, up 5
- Space Mountain – 65 minutes, up 18
- Jungle Cruise – 64 minutes, up 3
- Haunted Mansion – 55 minutes, up 7
- Big Thunder Mountain Railroad – 48 minutes, up 10
- Buzz Lightyear’s Space Ranger Spin – 45 minutes, up 7
- Pirates of the Caribbean – 43 minutes, up 4
- Ariel’s Grotto – 42 minutes, no change
- The Many Adventures of Winnie the Pooh – 40 minutes, up 2
- Princess Fairytale Hall – 35 minutes, down 3
- It’s a Small World – 34 minutes, up 3
- Astro Orbiter – 33 minutes, up 2
- Town Square Theater – 32 minutes, no change
- Pete’s Silly Sideshow – 31 minutes, down 3
- Under the Sea ~ Journey of the Little Mermaid – 30 minutes, up 3
- Enchanted Tales with Belle – 29 minutes, up 2
- The Magic Carpets of Aladdin – 29 minutes, up 3
- Dumbo the Flying Elephant – 28 minutes, up 7
- The Barnstormer – 27 minutes, up 5
- Tomorrowland Speedway – 24 minutes, up 6
- Mad Tea Party – 17 minutes, up 5
- Mickey’s PhilharMagic – 17 minutes, no change
- Walt Disney World Railroad – 15 minutes, up 10
- Prince Charming Regal Carrousel – 13 minutes, no change
- Monsters, Inc. Laugh Floor – 12 minutes, down 3
- Country Bear Jamboree – 5 minutes, no change
- Walt Disney’s Carousel of Progress – 5 minutes, no change
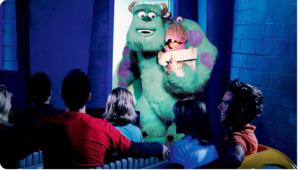
Photo: Disney
Overall, Magic Kingdom guests waited for an average of 35 minutes, which is four minutes or 13 percent more than the previous week.
I think the trend here is readily apparent. Walt Disney World crowds have increased by 10-15 percent across the parks.
Interestingly, the only Disney experiences that decreased this past week were character interactions and the Monsters, Inc. improv show.
Everything else required an additional wait, which makes me wonder whether more casual Disney fans are more enthusiastic about rides than characters.