Walt Disney World Wait Times for the Third Week of January 2022
The EPCOT International Festival of the Arts is fully underway. Historically, festivals have driven traffic to Disney theme parks.
This year, we have the strangest x-factor imaginable, though. People wanted a popcorn bucket.
Did this impact the waits at attractions any? Good lord, I hope not. Still, let’s check in this week’s Walt Disney World wait times.
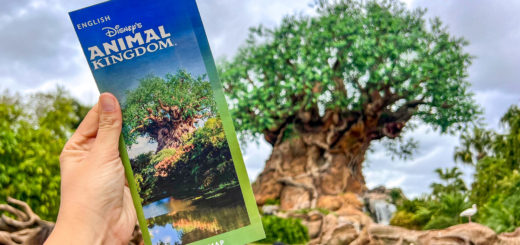
Disney’s Animal Kingdom
Generally, crowds thin out as we get deeper into January. The festival is only in its sixth year, and the last two have come during a pandemic.
(David Roark, photographer)
So, I struggle to decide which factor matters more, the festival returning at full strength in 2022 or the standard January slowdown.
What I can tell you is that the average Avatar Flight of Passage wait dropped from 112 minutes to 87 minutes. So, we’re trending toward smaller crowds.
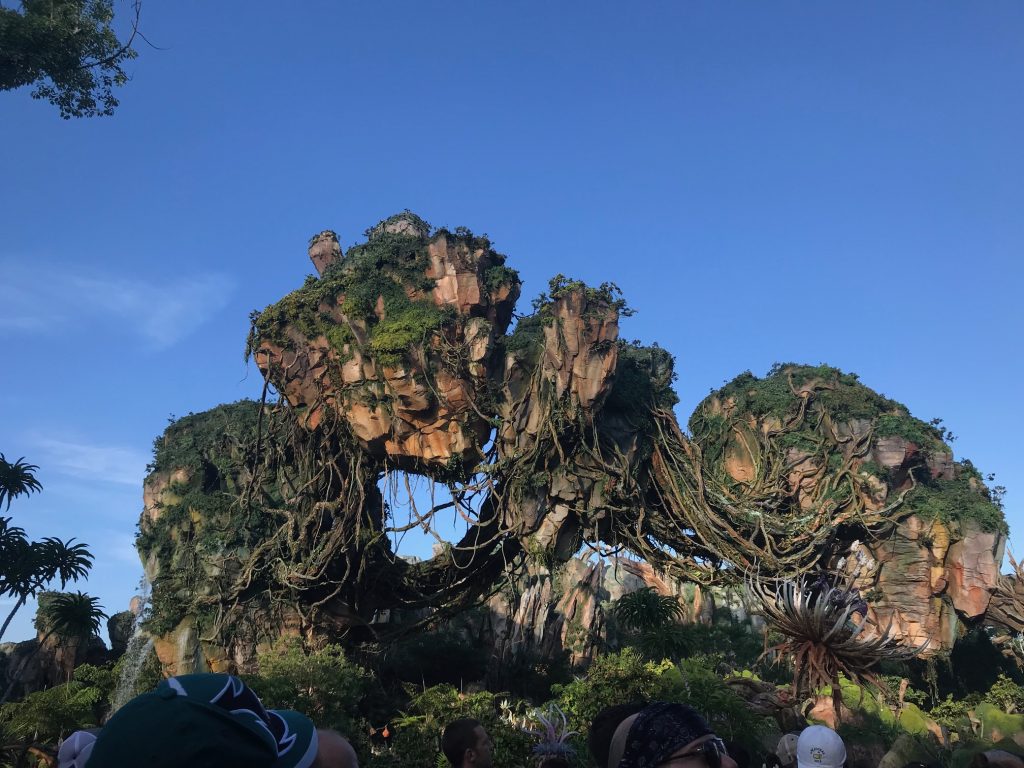
Na’vi River Journey also fell from 73 minutes to 60 minutes. So, at a minimum, it appears that Animal Kingdom claimed fewer guests last week.
Here’s the rest of the data to confirm:
- Kilimanjaro Safaris – 33 minutes, down 30 (!)
- DINOSAUR – 30 minutes, down 15
- TriceraTop Spin – 15 minutes, down 9
- It’s Tough to Be a Bug! – 11 minutes, down 4
- Kali River Rapids – 6 minutes, down 1
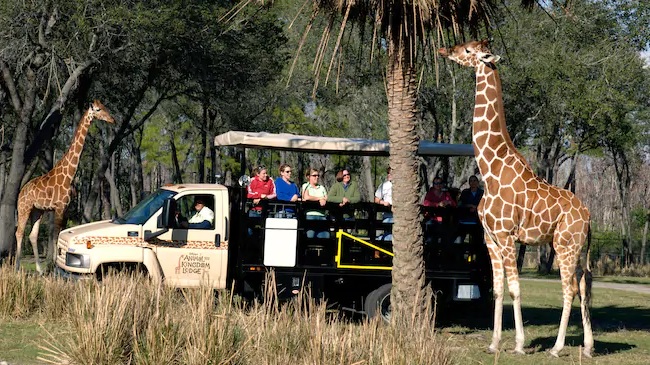
Photo: Disney
Overall, Animal Kingdom attractions required an average wait of 34 minutes, down 14 minutes from last time.
Based on this data, last week seemed like a good time to visit Walt Disney World.
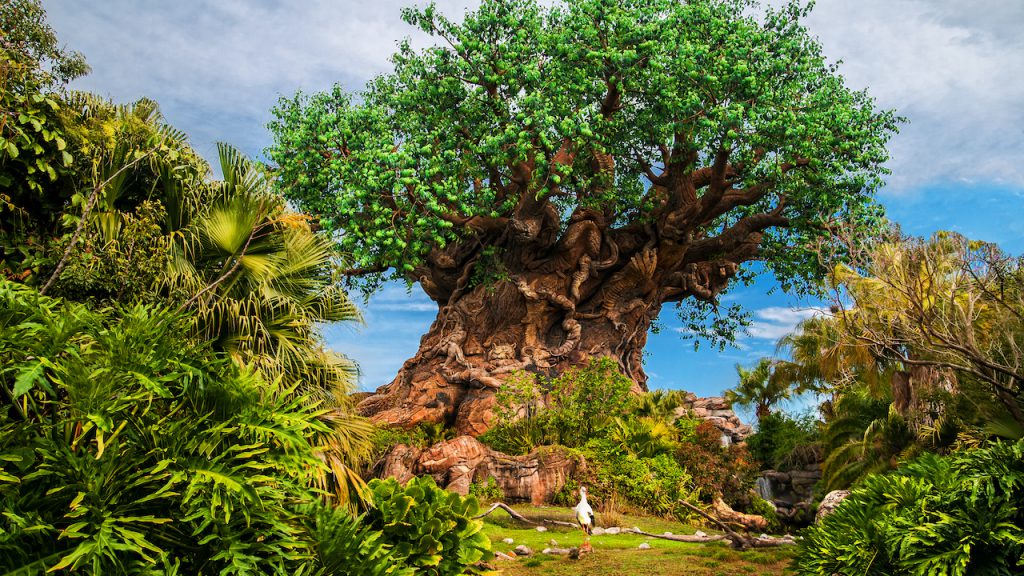
Photo: Disney
Disney’s Hollywood Studios
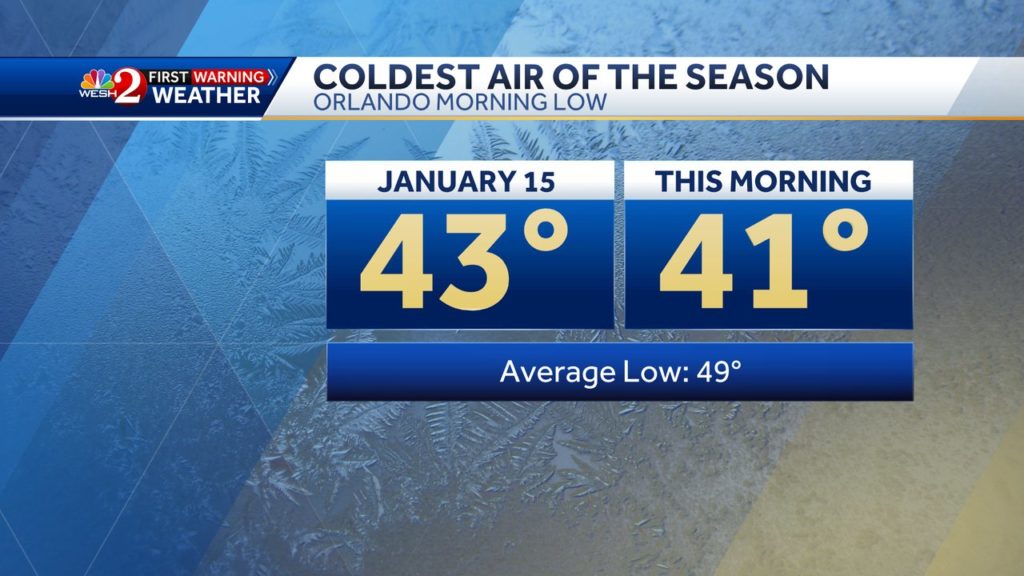
Of course, the previous statement comes with a giant asterisk. If you didn’t read about it on MickeyBlog, Florida suffered through a cold spell last week.
I’m not even talking about cold for Florida. It was frigid by the standards of any southern state. That’s likely factoring into wait times.
Did the weather impact Hollywood Studios? Here are the stats:
- Star Wars: Rise of the Resistance – 135 minutes, down 37
- Slinky Dog Dash – 92 minutes, up 2
- Millennium Falcon: Smugglers Run – 72 minutes, down 6
- Mickey & Minnie’s Runaway Railway – 70 minutes, up 3
- Toy Story Mania! – 65 minutes, no change
- Rock ‘n’ Roller Coaster Starring Aerosmith – 60 minutes, down 12
- Twilight Zone Tower of Terror – 55 minutes, down 21
- Alien Swirling Saucers – 42 minutes, up 2
- Star Tours – The Adventures Continue – 30 minutes, down 1
- Lightning McQueen’s Racing Academy – 15 minutes down 5
- Muppet*Vision 3D – 10 minutes, no change
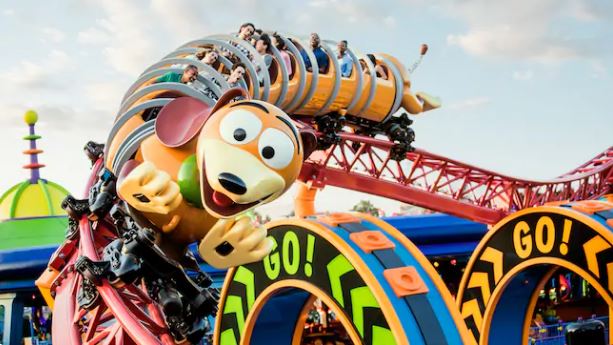
Credit: Disney
Overall, Hollywood Studios attractions averaged a wait of 45 minutes, down 8 minutes from last time.
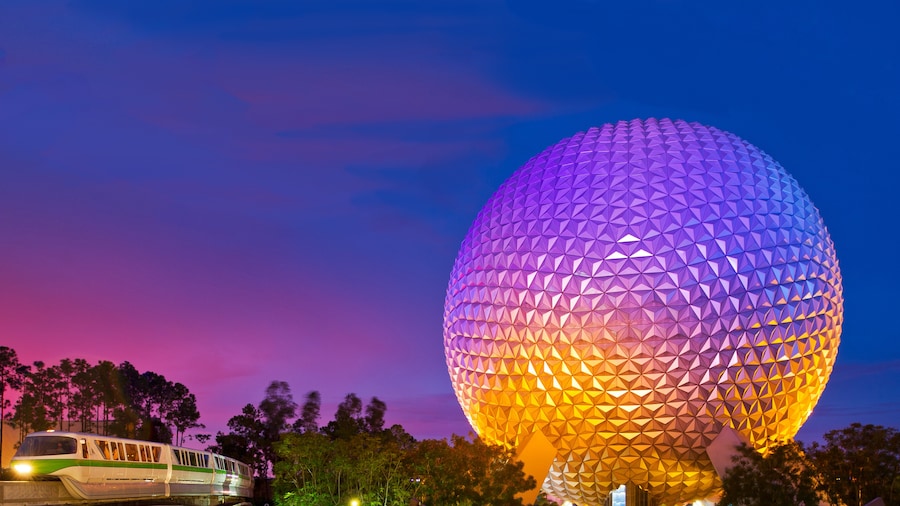
EPCOT
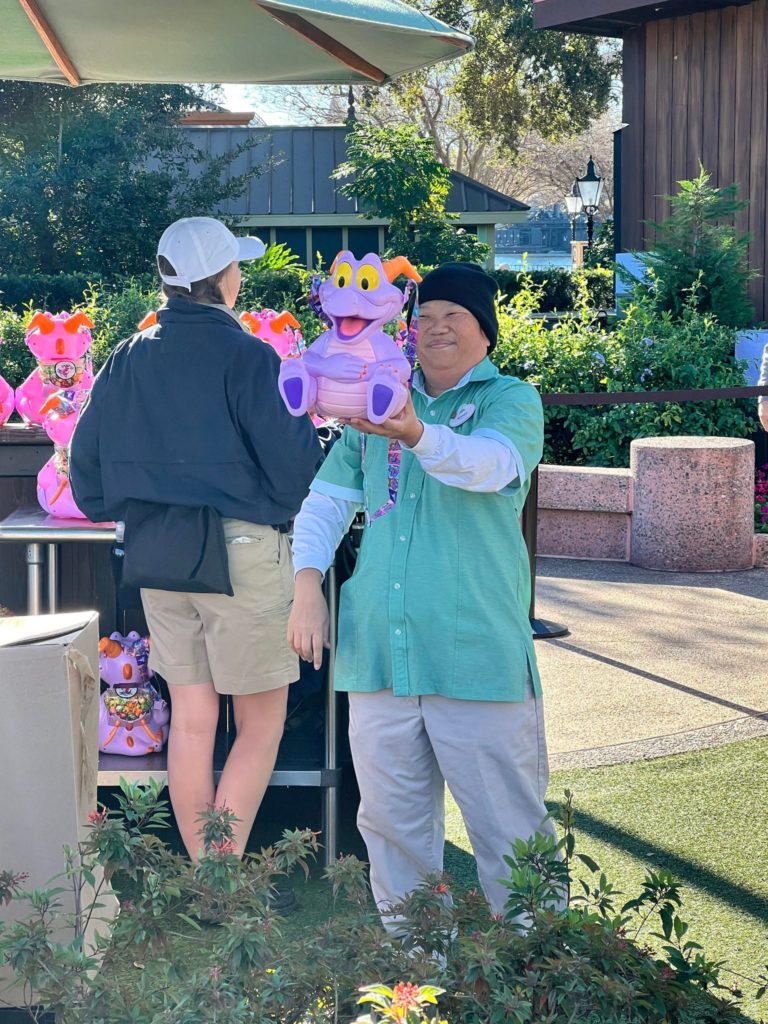
These other parks weren’t fighting the Figment phenomenon the way that EPCOT did.
I was morbidly curious about this one because it’s such a weird story. If people wait in line for a popcorn bucket for hours on end, they can’t be on rides, right?
Theoretically, Figment should have pulsed traffic away from the attractions. But then again, the demand for Figment undeniably led to larger crowds overall.
How did the situation play out? Here are the average wait times:
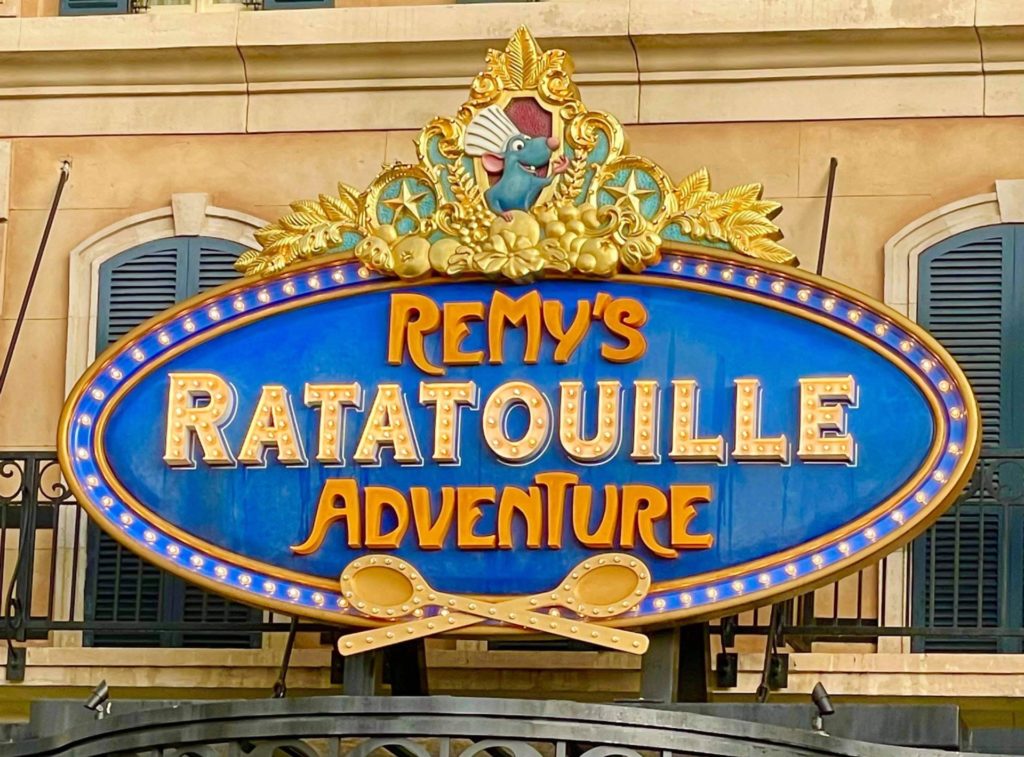
- Remy’s Ratatouille Adventure – 86 minutes, up 1 minute
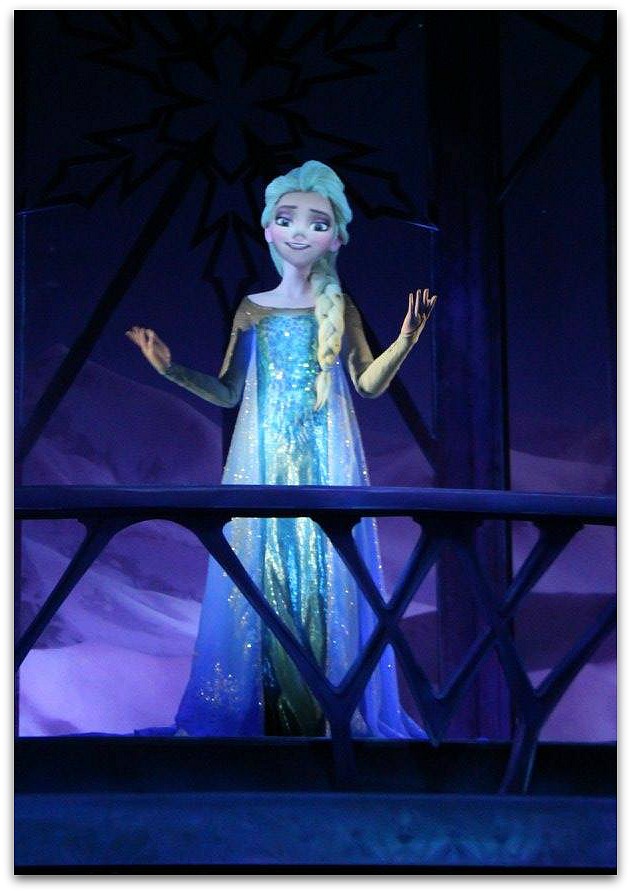
- Frozen Ever After – 85 minutes, up 7
- Test Track – 64 minutes, up 2
- Soarin’ Around the World – 40 minutes, down 4
- Journey into Imagination with Figment – 20 minutes, down 1
- Living with the Land – 18 minutes, up 5
- The Seas with Nemo & Friends – 15 minutes, down 1
- Spaceship Earth – 14 minutes, down 2
- Mission: SPACE – 12 minutes, down 10
- Gran Fiesta Tour Starring the Three Caballeros – 11 minutes, down 3
- Turtle Talk with Crush – 10 minutes, no change
Overall, EPCOT attractions averaged a 35-minute wait, down two minutes from last time.
So, the Figment popcorn bucket really didn’t impact much. Also, Ratatouille lines have already grown reasonable.
Frozen Ever After appears likely to become the longest line at EPCOT again within a month.
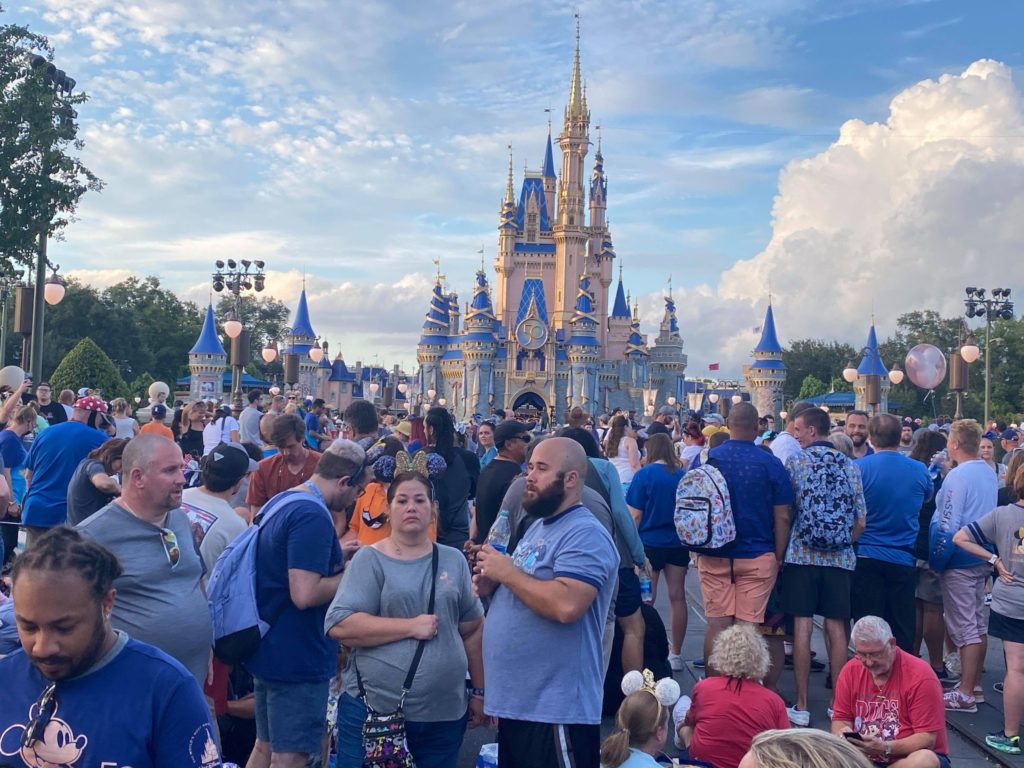
Magic Kingdom
Overall, we’re trending down at Walt Disney World, albeit by less than in past years. That’s pretty much what I’d expected.
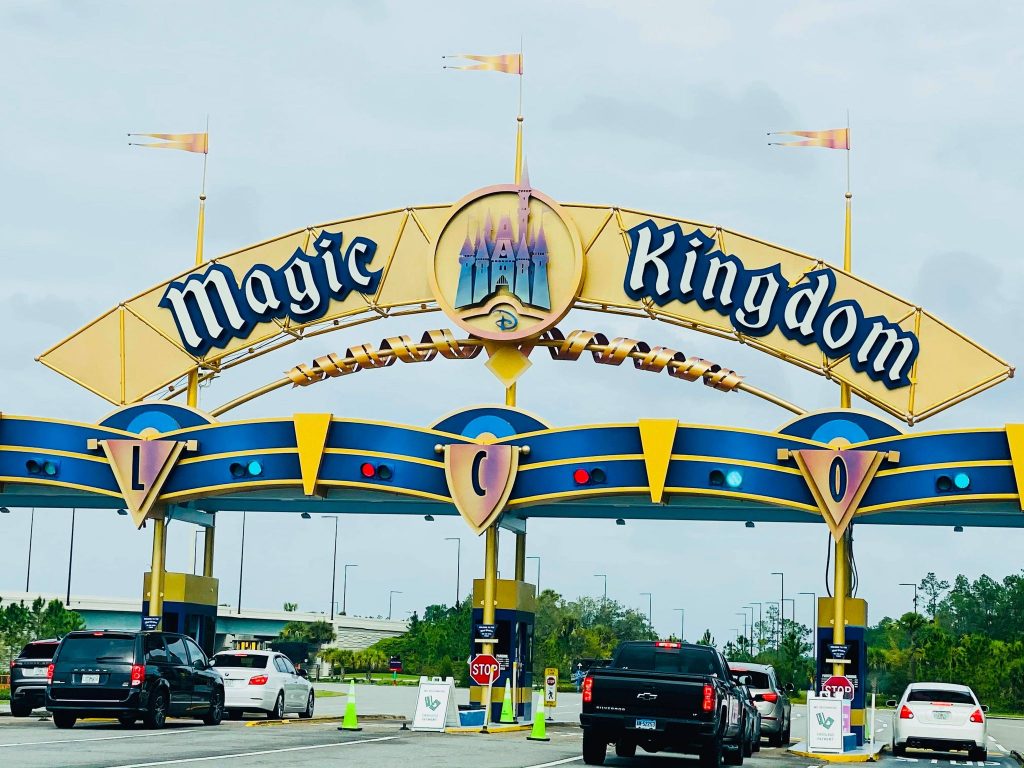
Still, we won’t know for sure without Magic Kingdom’s wait times. So, here they are:
- Seven Dwarfs Mine Train – 125 minutes, up 25
- Peter Pan’s Flight – 100 minutes, up 20
- Jungle Cruise – 95 minutes, up 28
- Space Mountain – 80 minutes, up 18
- Haunted Mansion – 65 minutes, up 17
- Big Thunder Mountain Railroad – 64 minutes, up 5
- Pirates of the Caribbean – 62 minutes, up 22
- Buzz Lightyear’s Space Ranger Spin – 60 minutes, up 15
- Under the Sea ~ Journey of the Little Mermaid – 55 minutes, up 23
- The Many Adventures of Winnie the Pooh – 53 minutes, up 13
- It’s a Small World – 52 minutes, up 16
- Astro Orbiter – 50 minutes, up 4
- The Barnstormer – 50 minutes, up 15
- Dumbo the Flying Elephant – 48 minutes, up 15
- The Magic Carpets of Aladdin – 45 minutes, up 14
- Tomorrowland Speedway – 42 minutes, up 16
- Princess Fairytale Hall – 31 minutes, up 6
- Prince Charming Regal Carrousel – 30 minutes, up 11
- Mad Tea Party – 28 minutes, up 8
- Tomorrowland Transit Authority PeopleMover – 28 minutes, up 6
- Monsters, Inc. Laugh Floor – 27 minutes, up 9
- Town Square Theatre – 21 minutes, up 11
- Country Bear Jamboree – 15 minutes, no change
- Walt Disney’s Carousel of Progress – 8 minutes, up 3
Okay, that’s…thoroughly confusing. I don’t have a solid explanation here, either.
Usually, the four parks line up with their behavior. However, Magic Kingdom’s behavior is wildly out of line with the other three gates this time.
All I can say is that the average Magic Kingdom attraction required a 50-minute wait, up 14 minutes. And I cannot explain it. They didn’t even have a Figment popcorn bucket!