Walt Disney World Wait Times for the Last Week of July 2021
August has finally arrived, which means brighter days are ahead for Walt Disney World fans. Of course, I mean that figuratively, but it’s literally true as well.
In August, crowds should decline, but we’re not there yet. Instead, we’re still discussing July, and FastPasses still aren’t a thing.
As such, we knew that wait times would remain high, something I mentioned to a friend who was taking his annual trip to Orlando at the time.
Don’t worry! It’s Disney, so he had the most incredible vacation anyway. Lines were long, though.
Here are the average Walt Disney World wait times for the last week of July of 2021.
Disney’s Animal Kingdom
We will start with the bellwether that hints at the overall status of the parks. And it’s not the news you want to hear.
Image Credit: Disney
Avatar Flight of Passage came with an average wait of 131 minutes, up three minutes from last week.
So, the Pandora attraction isn’t just hovering around two hours. It’s increasing a bit each week.

Now, I expect these numbers to peak in another few days and then start to decline gradually. That may prove optimistic, though.
Kilimanjaro Safaris remains the only other ride over 60 minutes, albeit just barely…both ways.
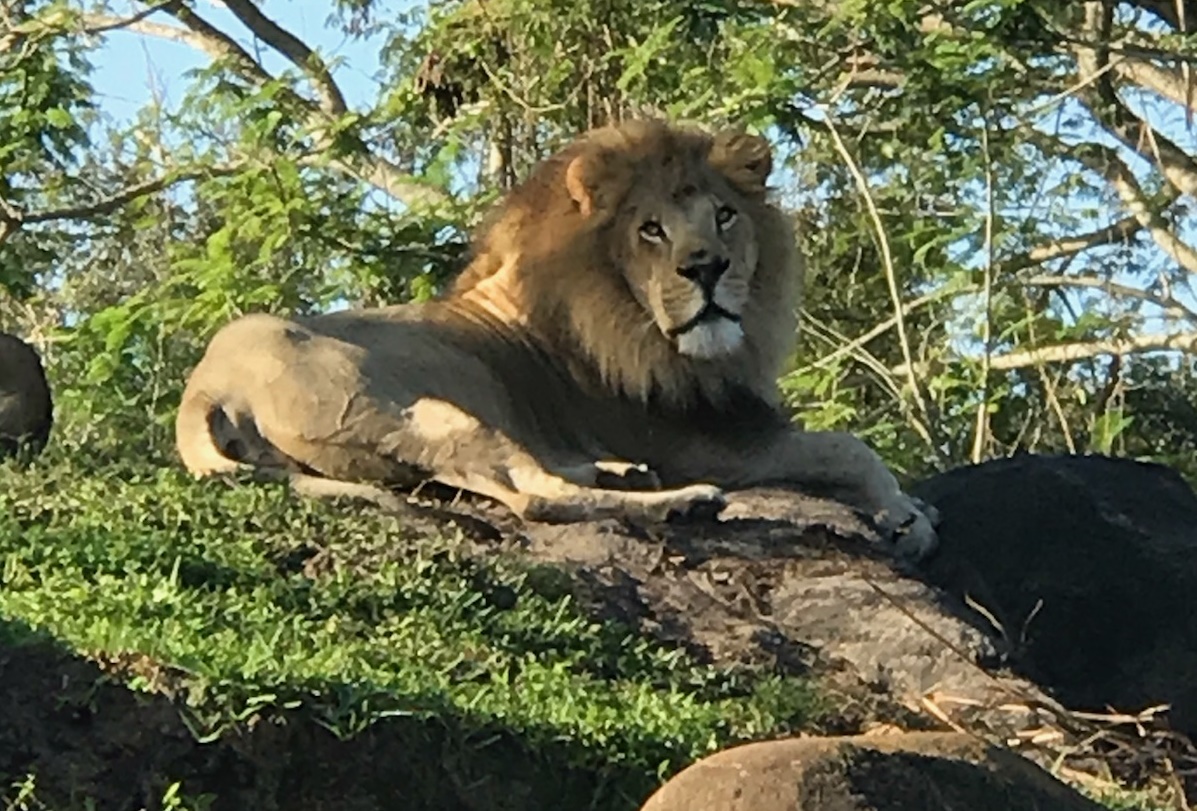
The jeep ride through Animal Kingdom’s savannas required an average wait of 62 minutes, up two from last time.
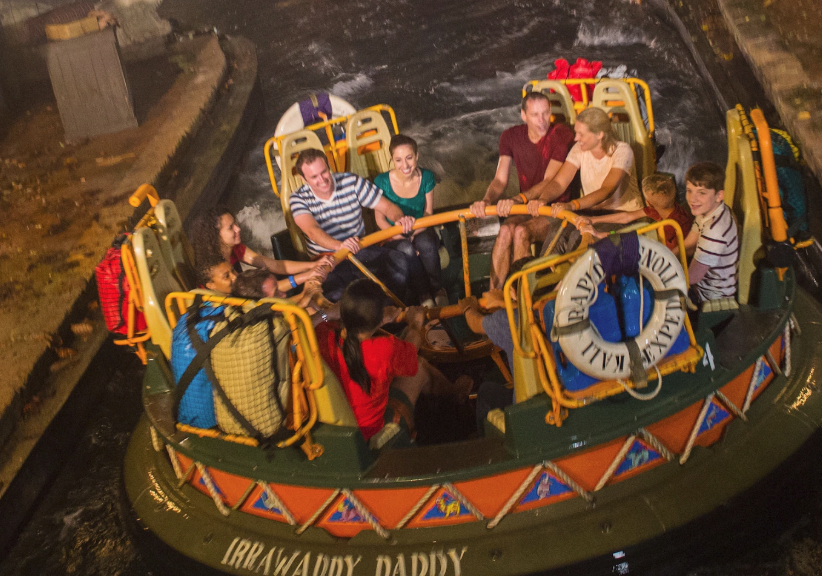
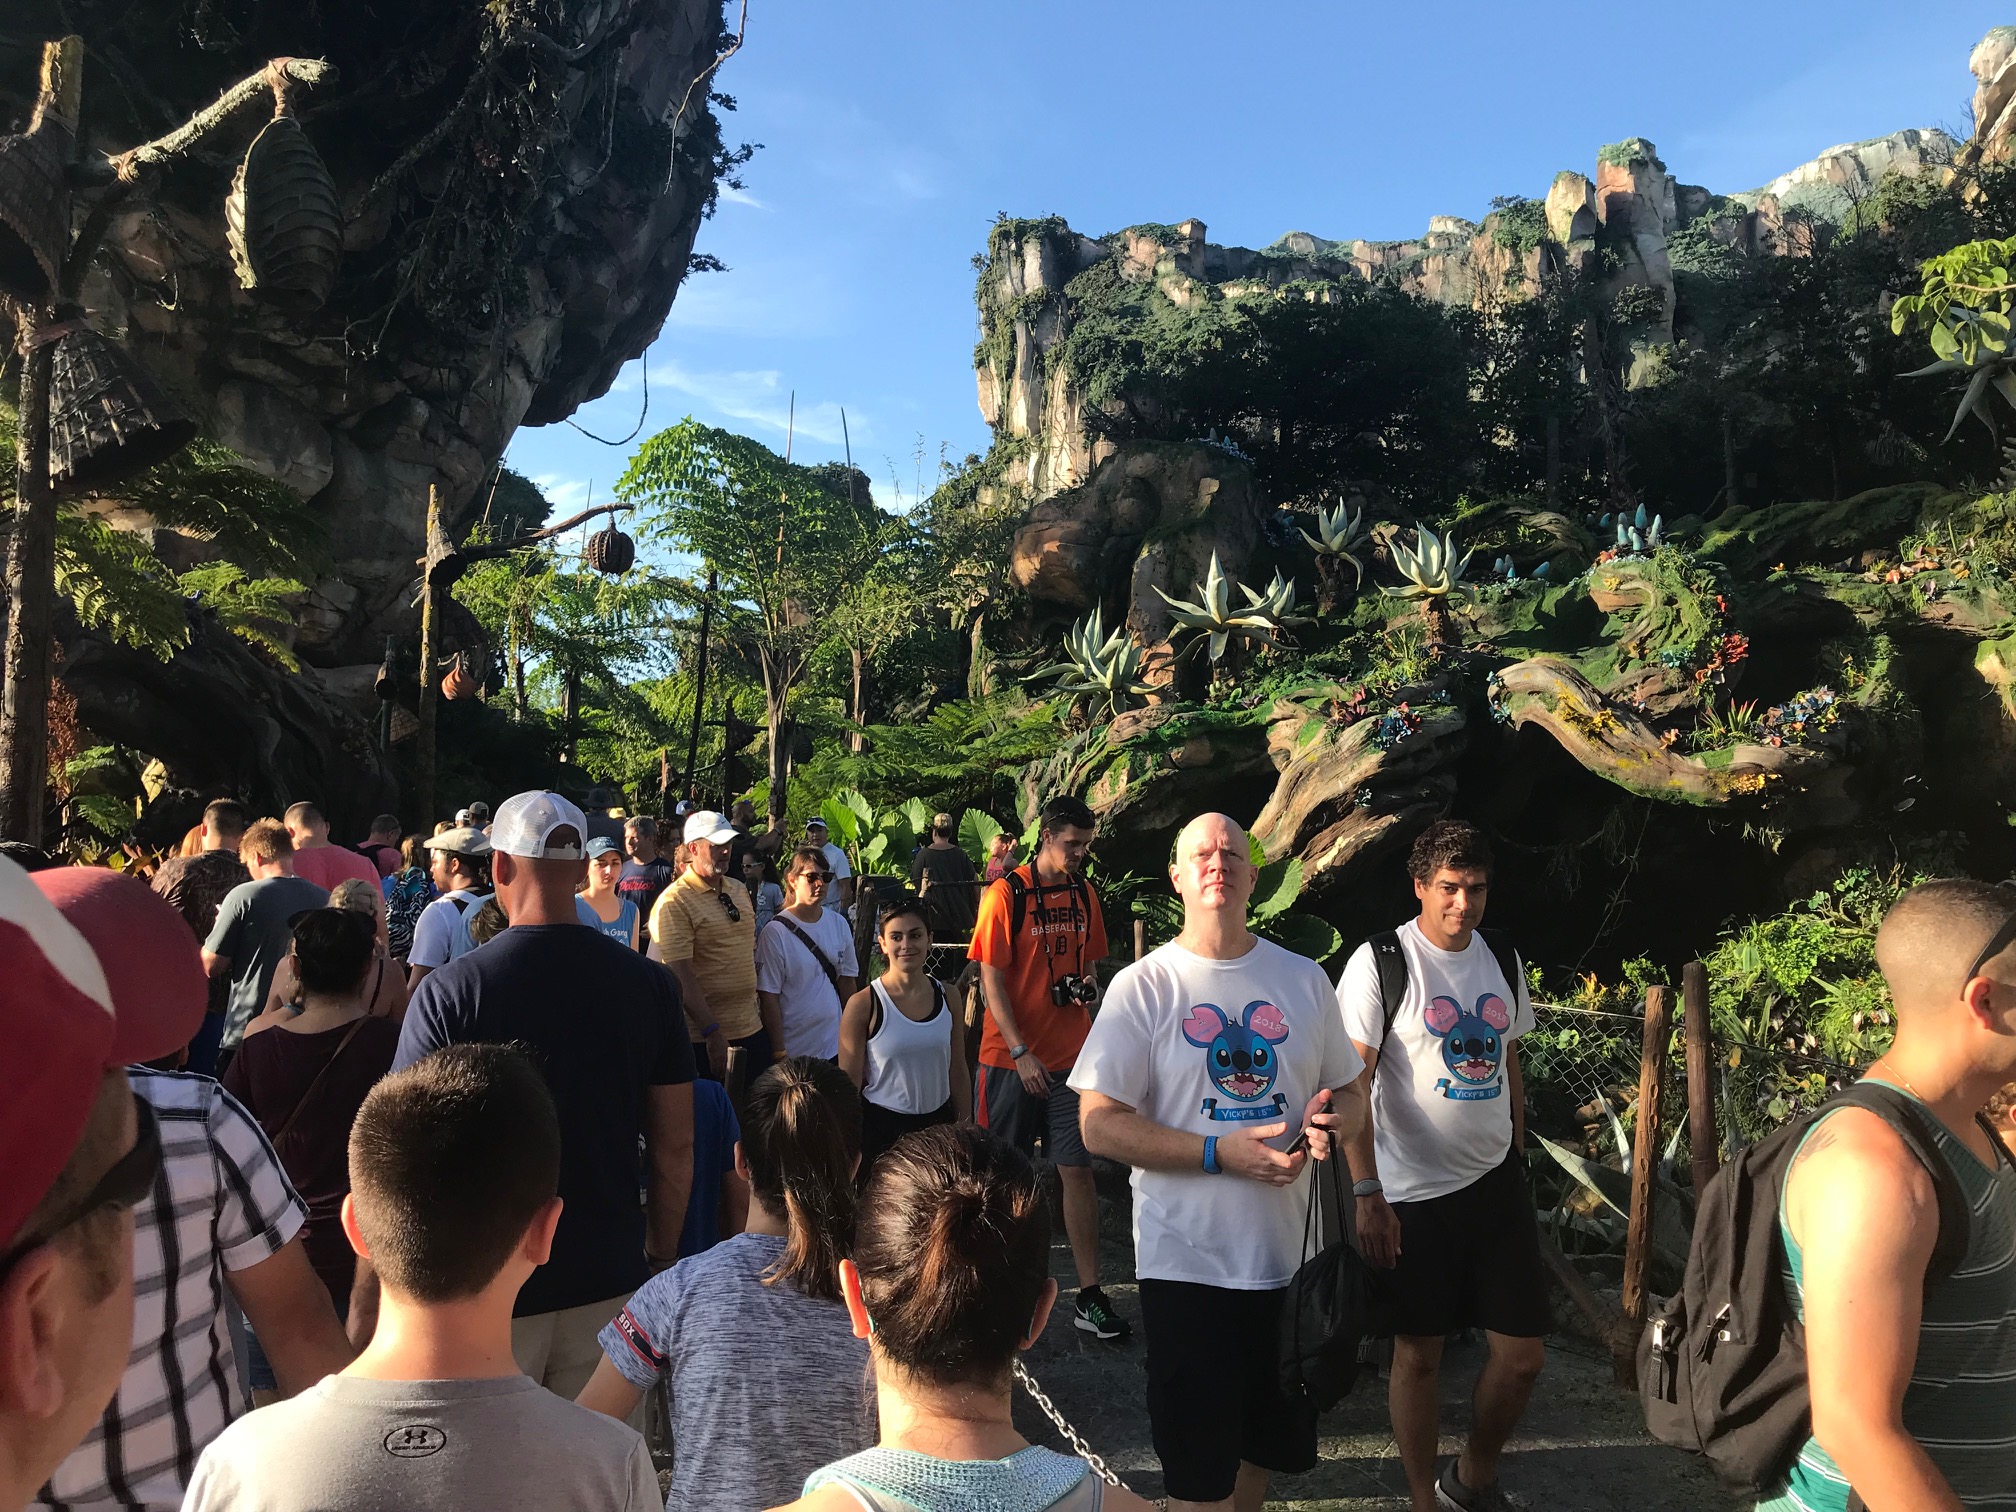
Meanwhile, Na’vi River Journey and Kali River Rapids fall just below this threshold.
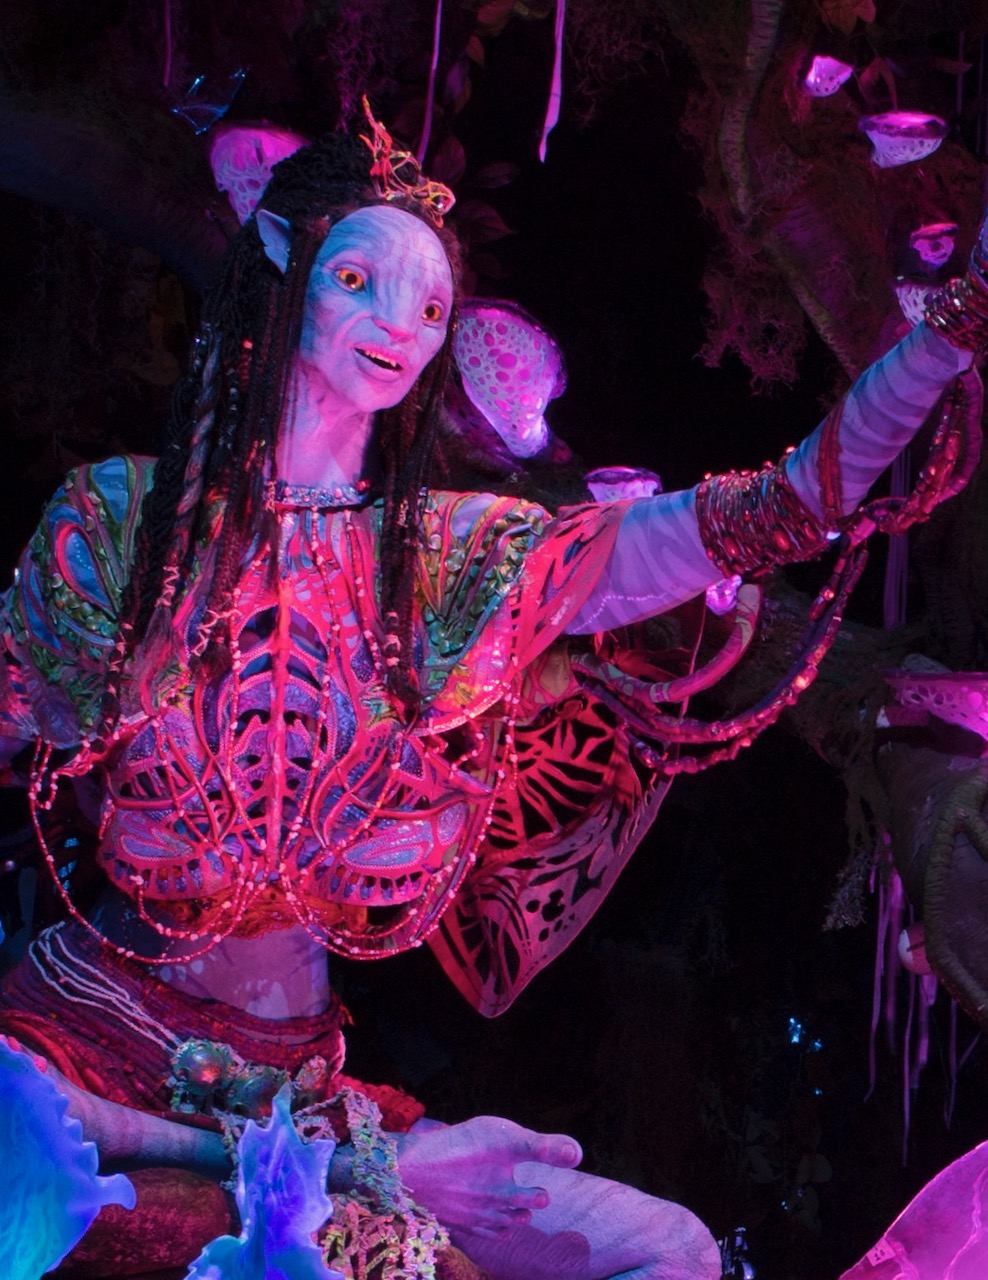
(Kent Phillips, photographer)
The other Pandora attraction averaged a 58-minute wait, the same as last week. Meanwhile, Kali River Rapids crept up from 55 to 57 minutes.
Yes, guests had to wait at least an hour for the big four at the park.
Now probably isn’t the best time to mention that I rode everything at Animal Kingdom in one day a couple of months ago.
Anyway, here are the other average wait times at the park:
- Expedition Everest – 44 minutes, up 3
- DINOSAUR – 39 minutes, no change
- It’s Tough to Be a Bug! – 18 minutes, no change
- TriceraTop Spin – 15 minutes, no change
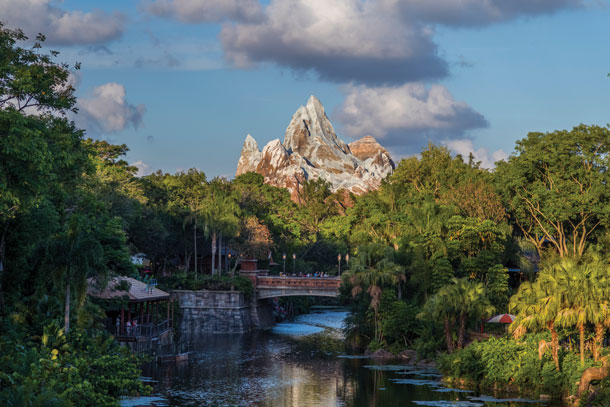
Photo: Disney
Overall, the average wait time at Animal Kingdom was 55 minutes, up three from last week.
As an aside, the same park’s lines were only 28 minutes five weeks ago. That’s how big a difference there is with July crowds.
Disney’s Hollywood Studios
I noticed some hostile comments about the lines at Hollywood Studios last week. But, if it helps, your waits weren’t abnormally long compared to the previous frame.
For example, Slinky Dog Dash came with a 104-minute wait on average, up four minutes from two weeks ago.
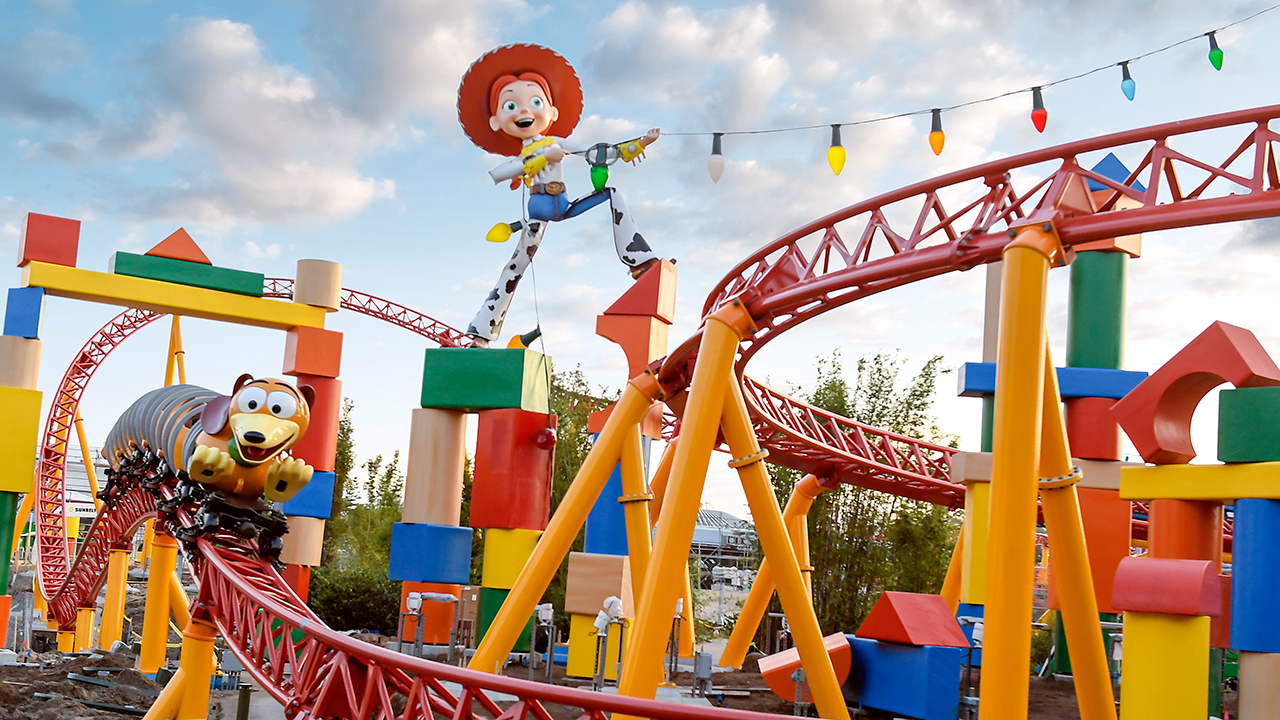
Image Credit: Disney
Millennium Falcon: Smugglers Run has surged slightly in recent weeks and just reached 100 minutes after being at 93 minutes before that.
The other noticeably long lines were at Rock ‘n’ Roller Coaster Starring Aerosmith. The limousine roller coaster required an 81-minute wait, up six.
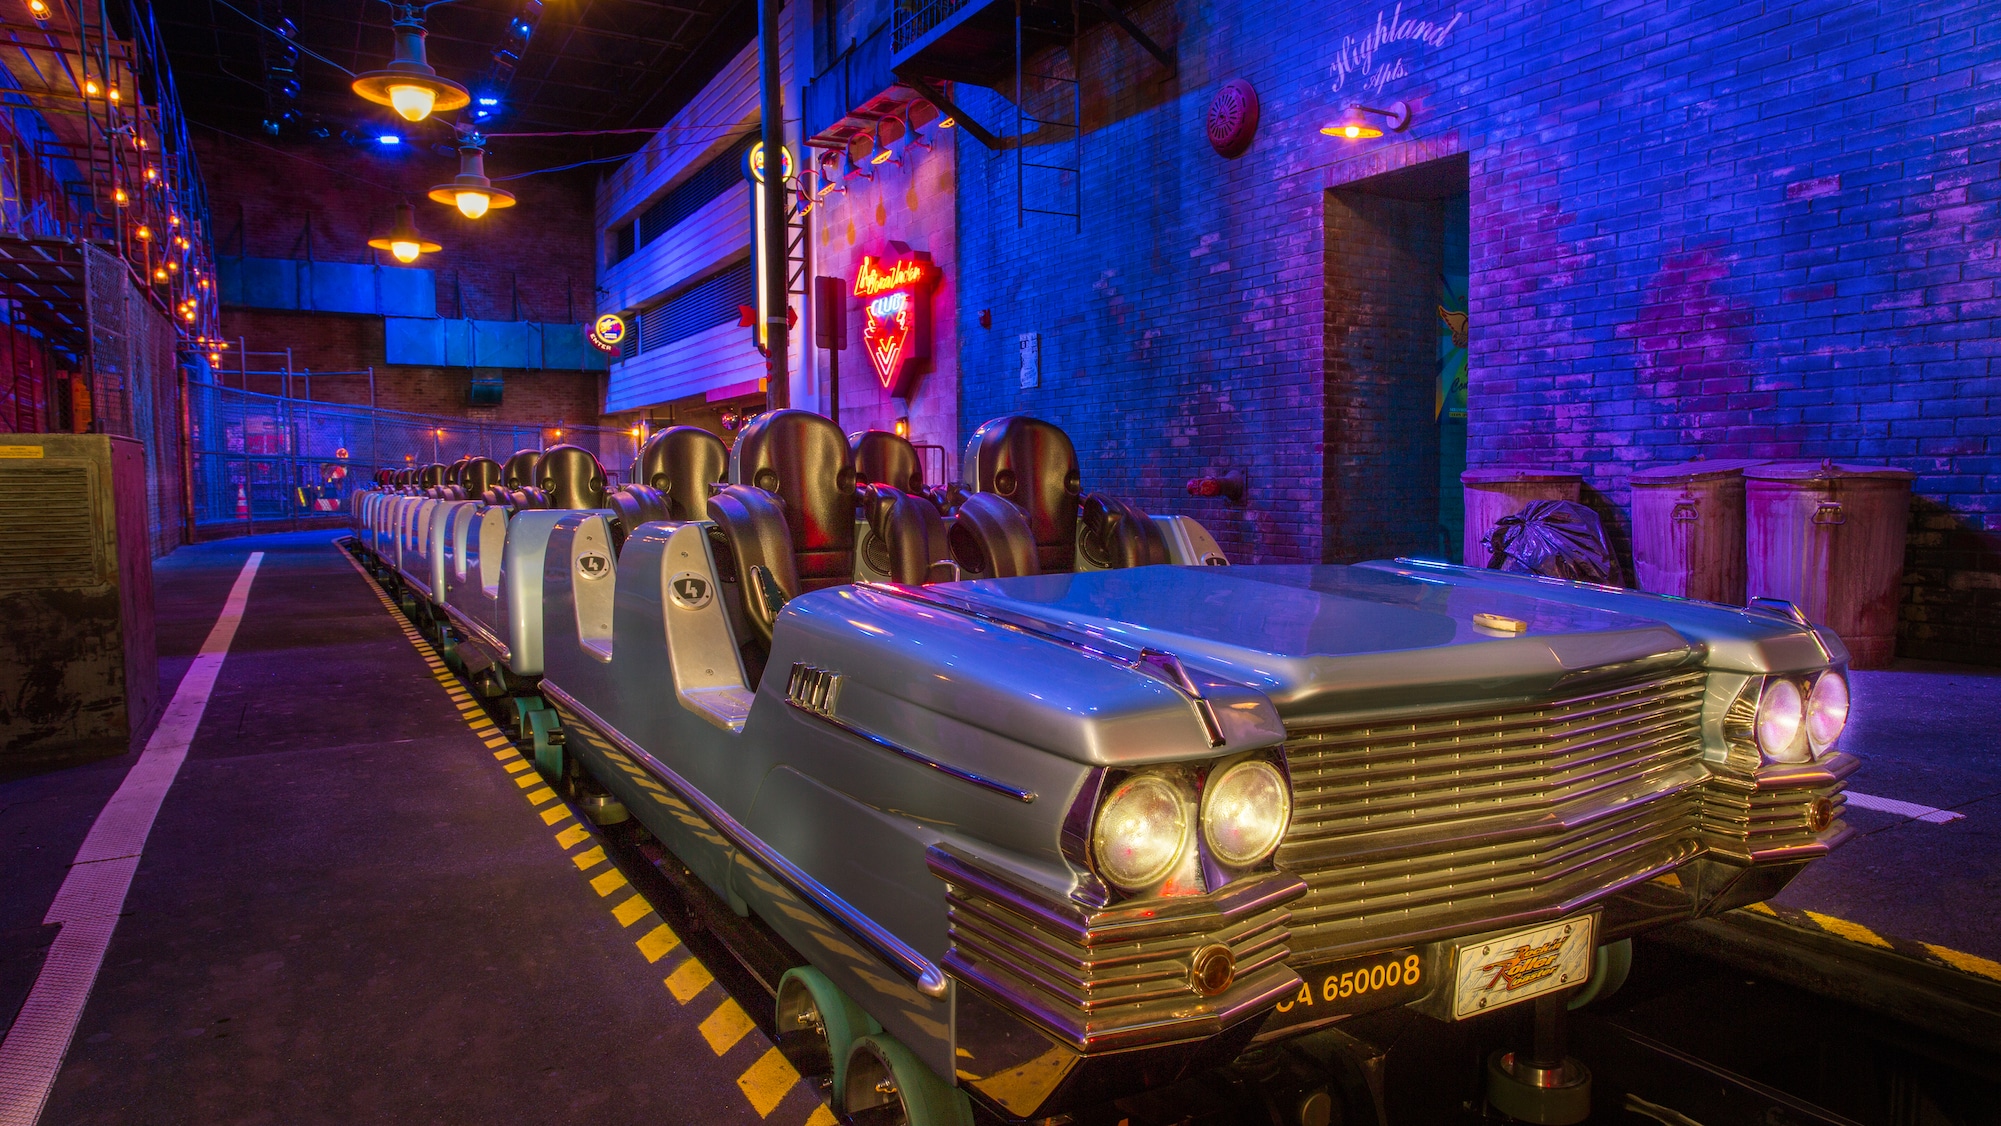
Image Credit: Disney
Here are the other Hollywood Studios wait times:
- Mickey & Minnie’s Runaway Railway – 74 minutes, up 4
- Twilight Zone Tower of Terror – 68 minutes, down 2
- Toy Story Mania! – 55 minutes, no change
- Alien Swirling Saucers – 44 minutes, up 2
- Star Tours – The Adventures Continue – 35 minutes, up 2
- Muppet*Vision 3D – 15 minutes, down 2
- Lightning McQueen’s Racing Academy – 13 minutes, down 2
Overall, Hollywood Studios attractions averaged a 51-minute wait, the same as last week.
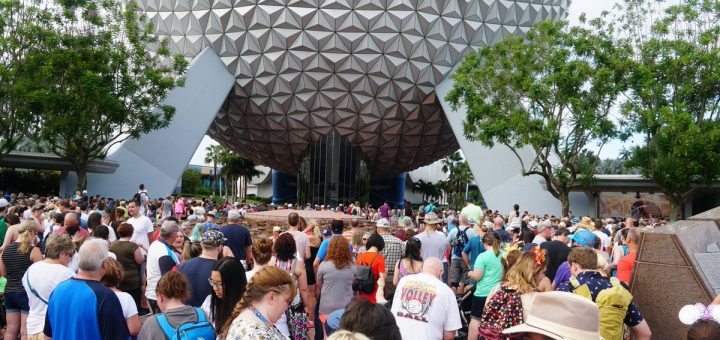
EPCOT
Let’s just pull off the bandage. Test Track possessed a 78-minute wait last week, up four minutes from the previous week.
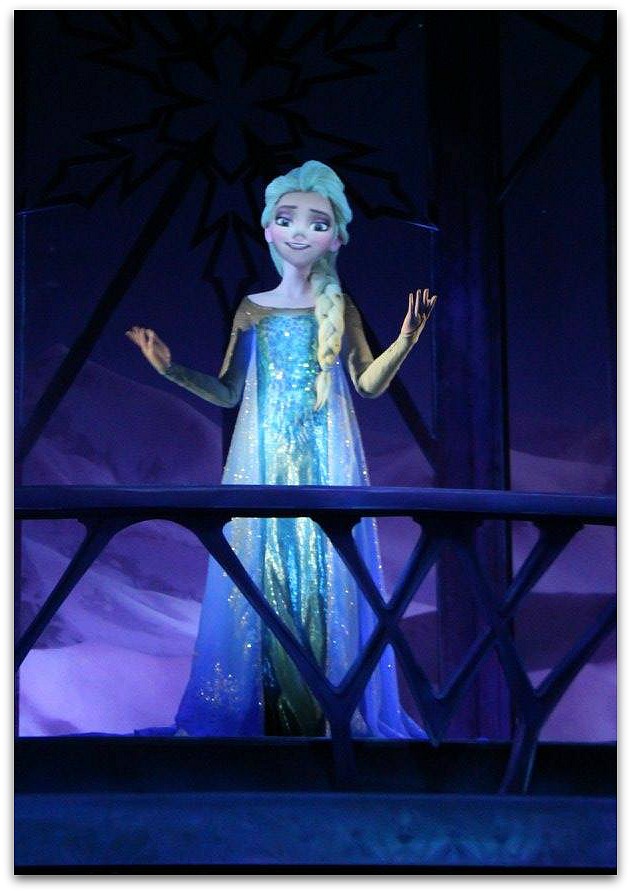
Frozen Ever After spiked from 50 to 58 minutes, which is one of the biggest numbers I’ve seen for it over the past 18 months.
 Soarin’ Around the World increased from 34 to 38 minutes, but that’s not troubling for it. The ride was often around 40 minutes before the pandemic.
Mission: SPACE shot up (get it?) ten minutes from 27 to 37 minutes. And yes, it maintains the weird skew between the Orange and Green versions.
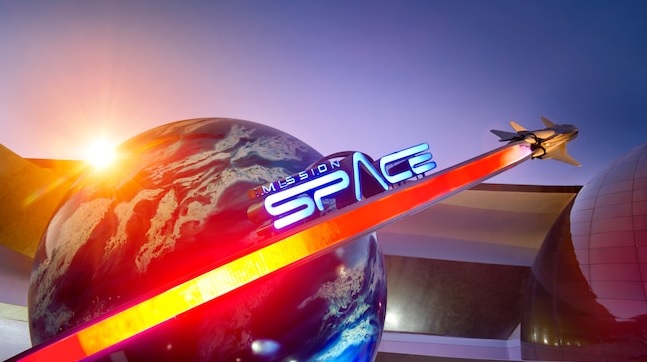
So, pick the Green side if you want a quick E-ticket ride at EPCOT. Otherwise, you’re going to wait at least 38 minutes.
Here’s the rest of EPCOT:
- Gran Fiesta Tour Starring the Three Caballeros – 32 minutes, up 10
- Spaceship Earth – 30 minutes, up 4
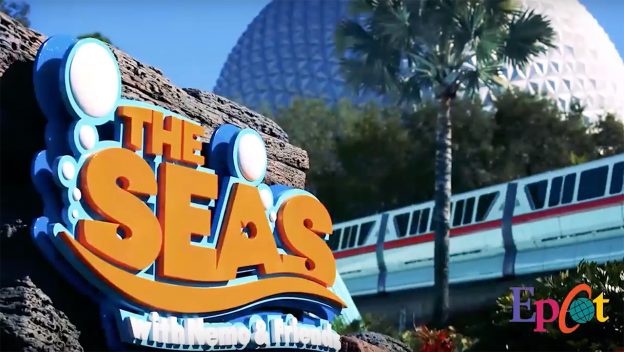
- The Seas with Nemo & Friends – 23 minutes, up 7
- Journey into Imagination with Figment – 18 minutes, up 5
- Living with the Land – 15 minutes, up 1
The average EPCOT ride came with a wait of 33 minutes, up four. Coincidentally, last week’s average EPCOT wait matched the one from five weeks ago.
I stress that EPCOT makes the most sense when you want to ride a lot of stuff in July. Its waits are much more reasonable than the other three parks.
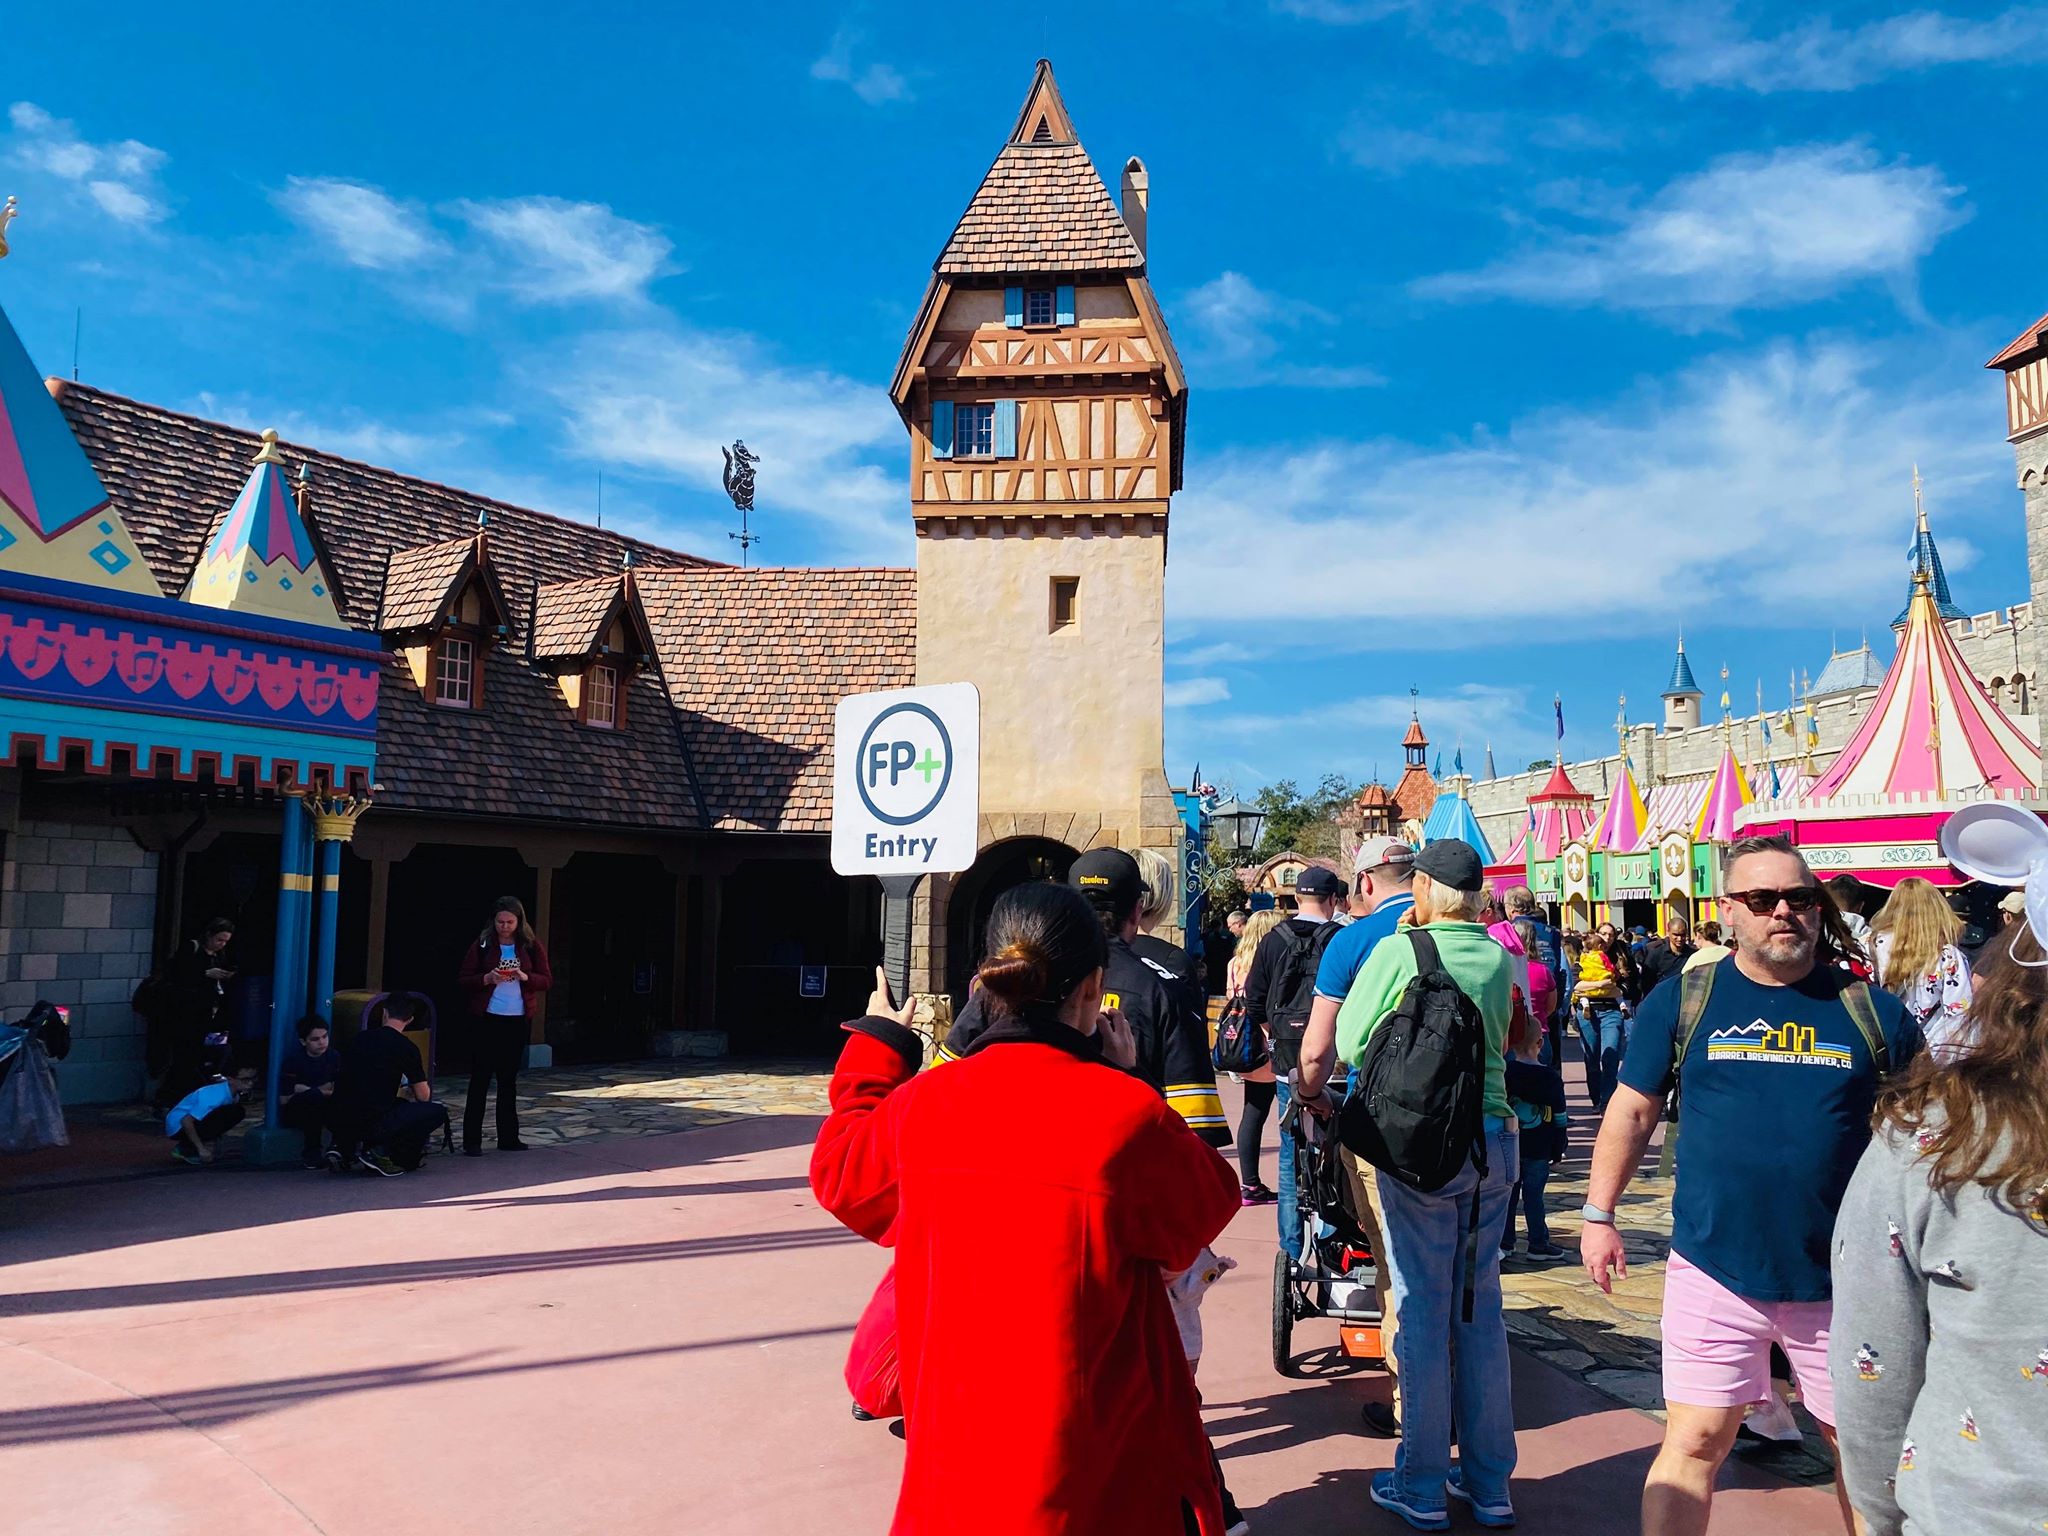
Magic Kingdom
Here are Magic Kingdom’s average wait times, along with a few thoughts at the end:
- Seven Dwarfs Mine Train – 97 minutes, up 11
- Splash Mountain – 85 minutes, down 4
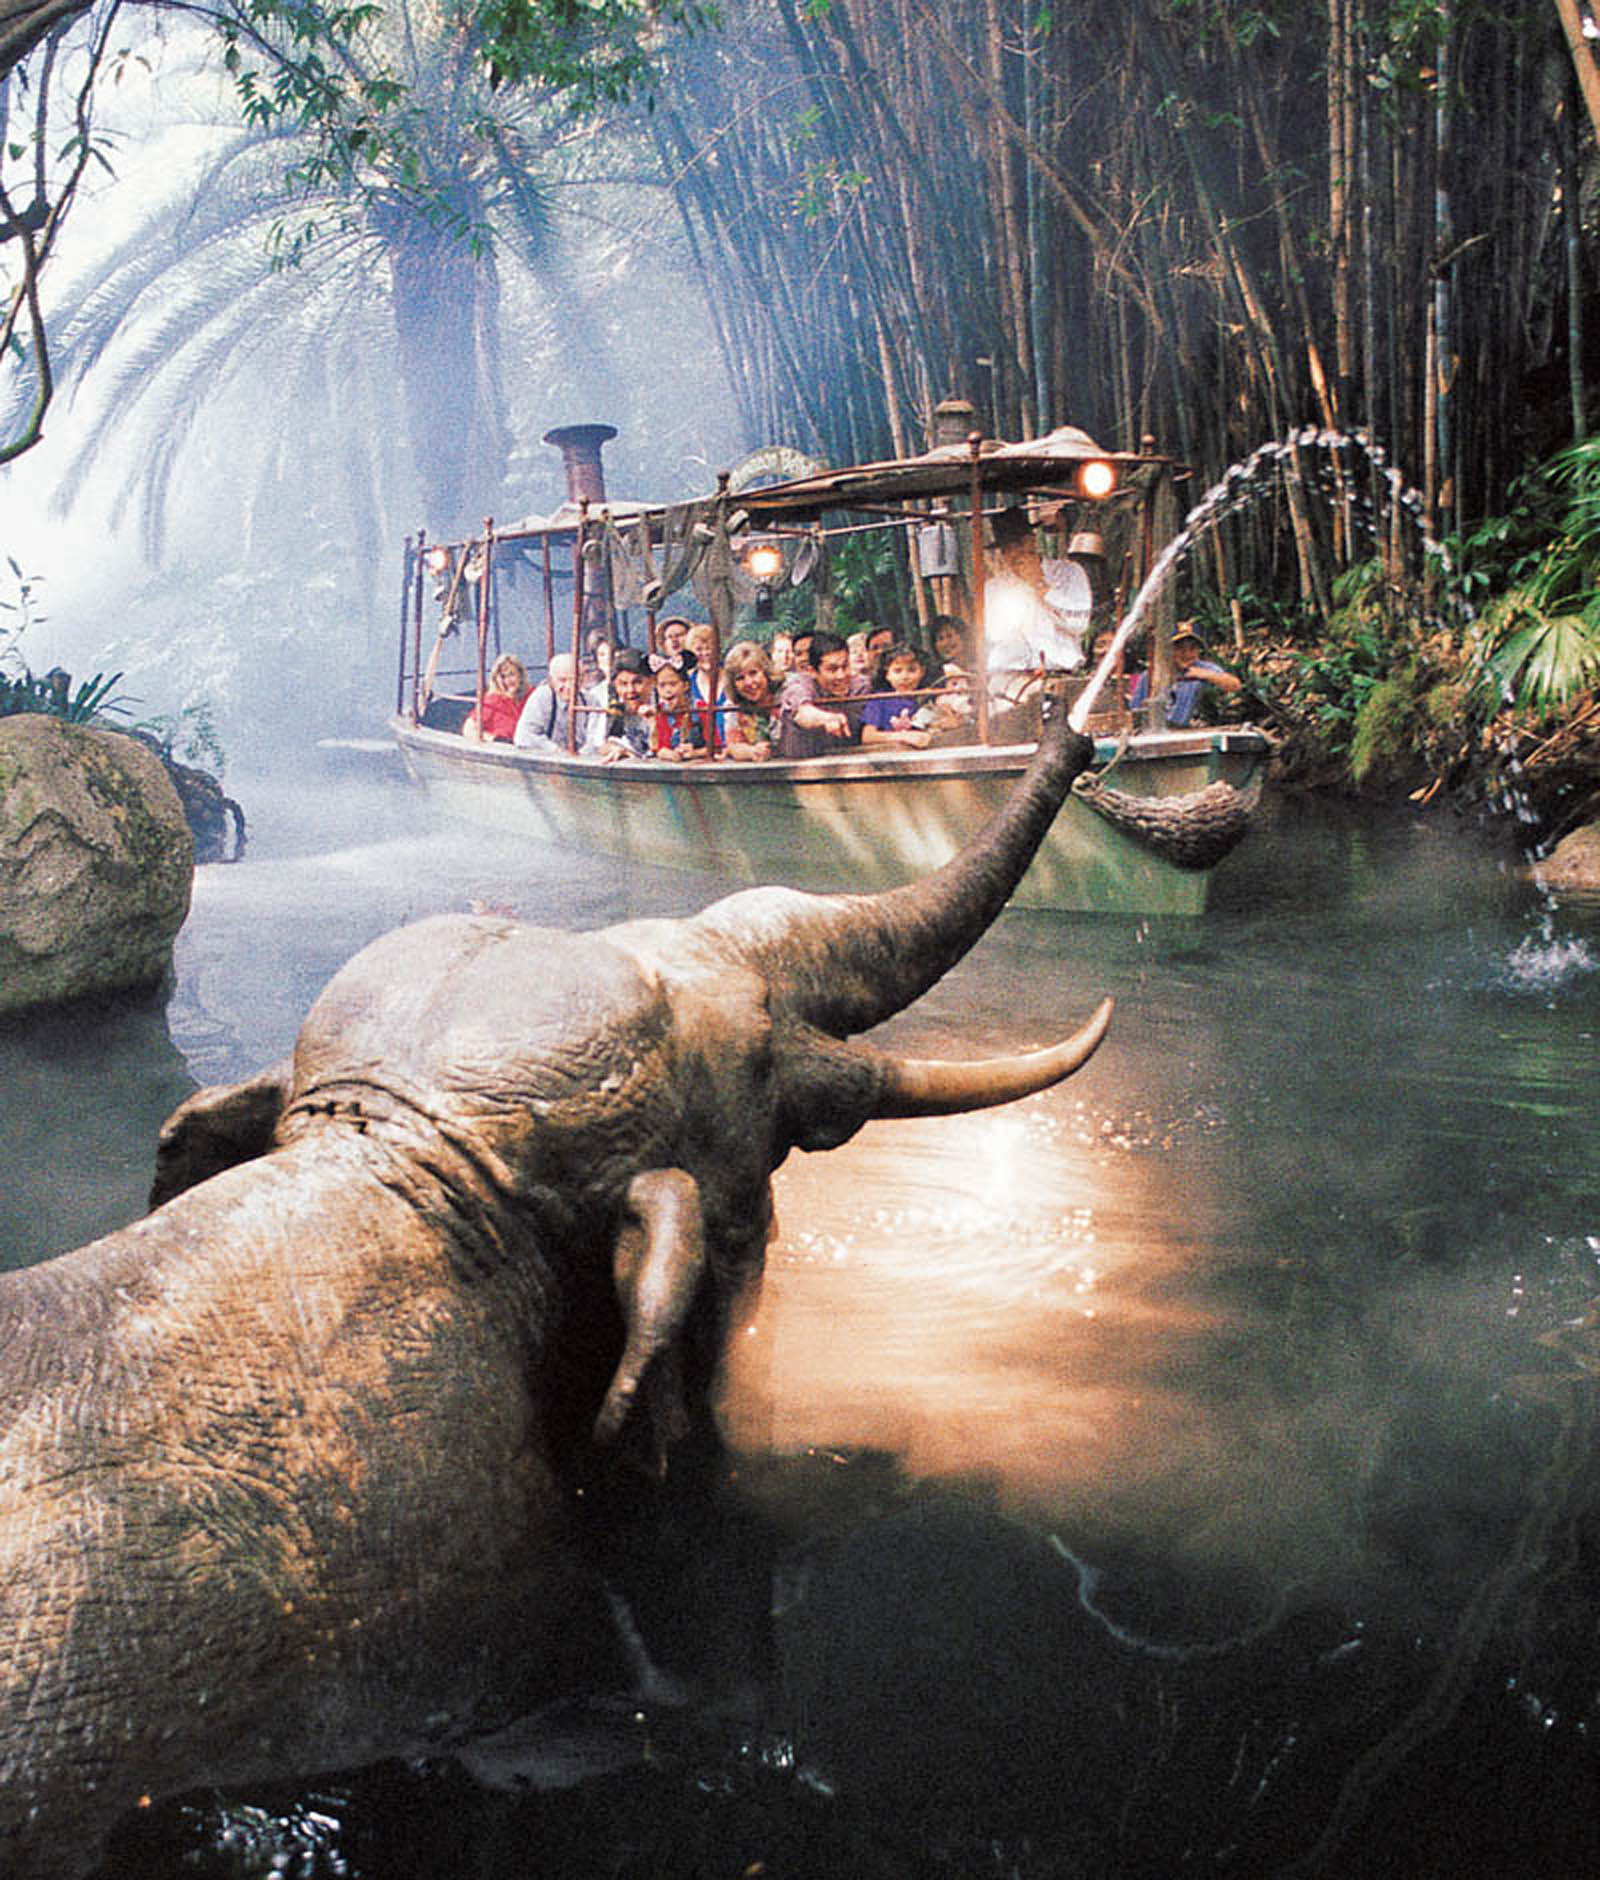
- Jungle Cruise – 82 minutes, up 16
- Space Mountain – 79 minutes, up 9
- Peter Pan’s Flight – 66 minutes, up 6
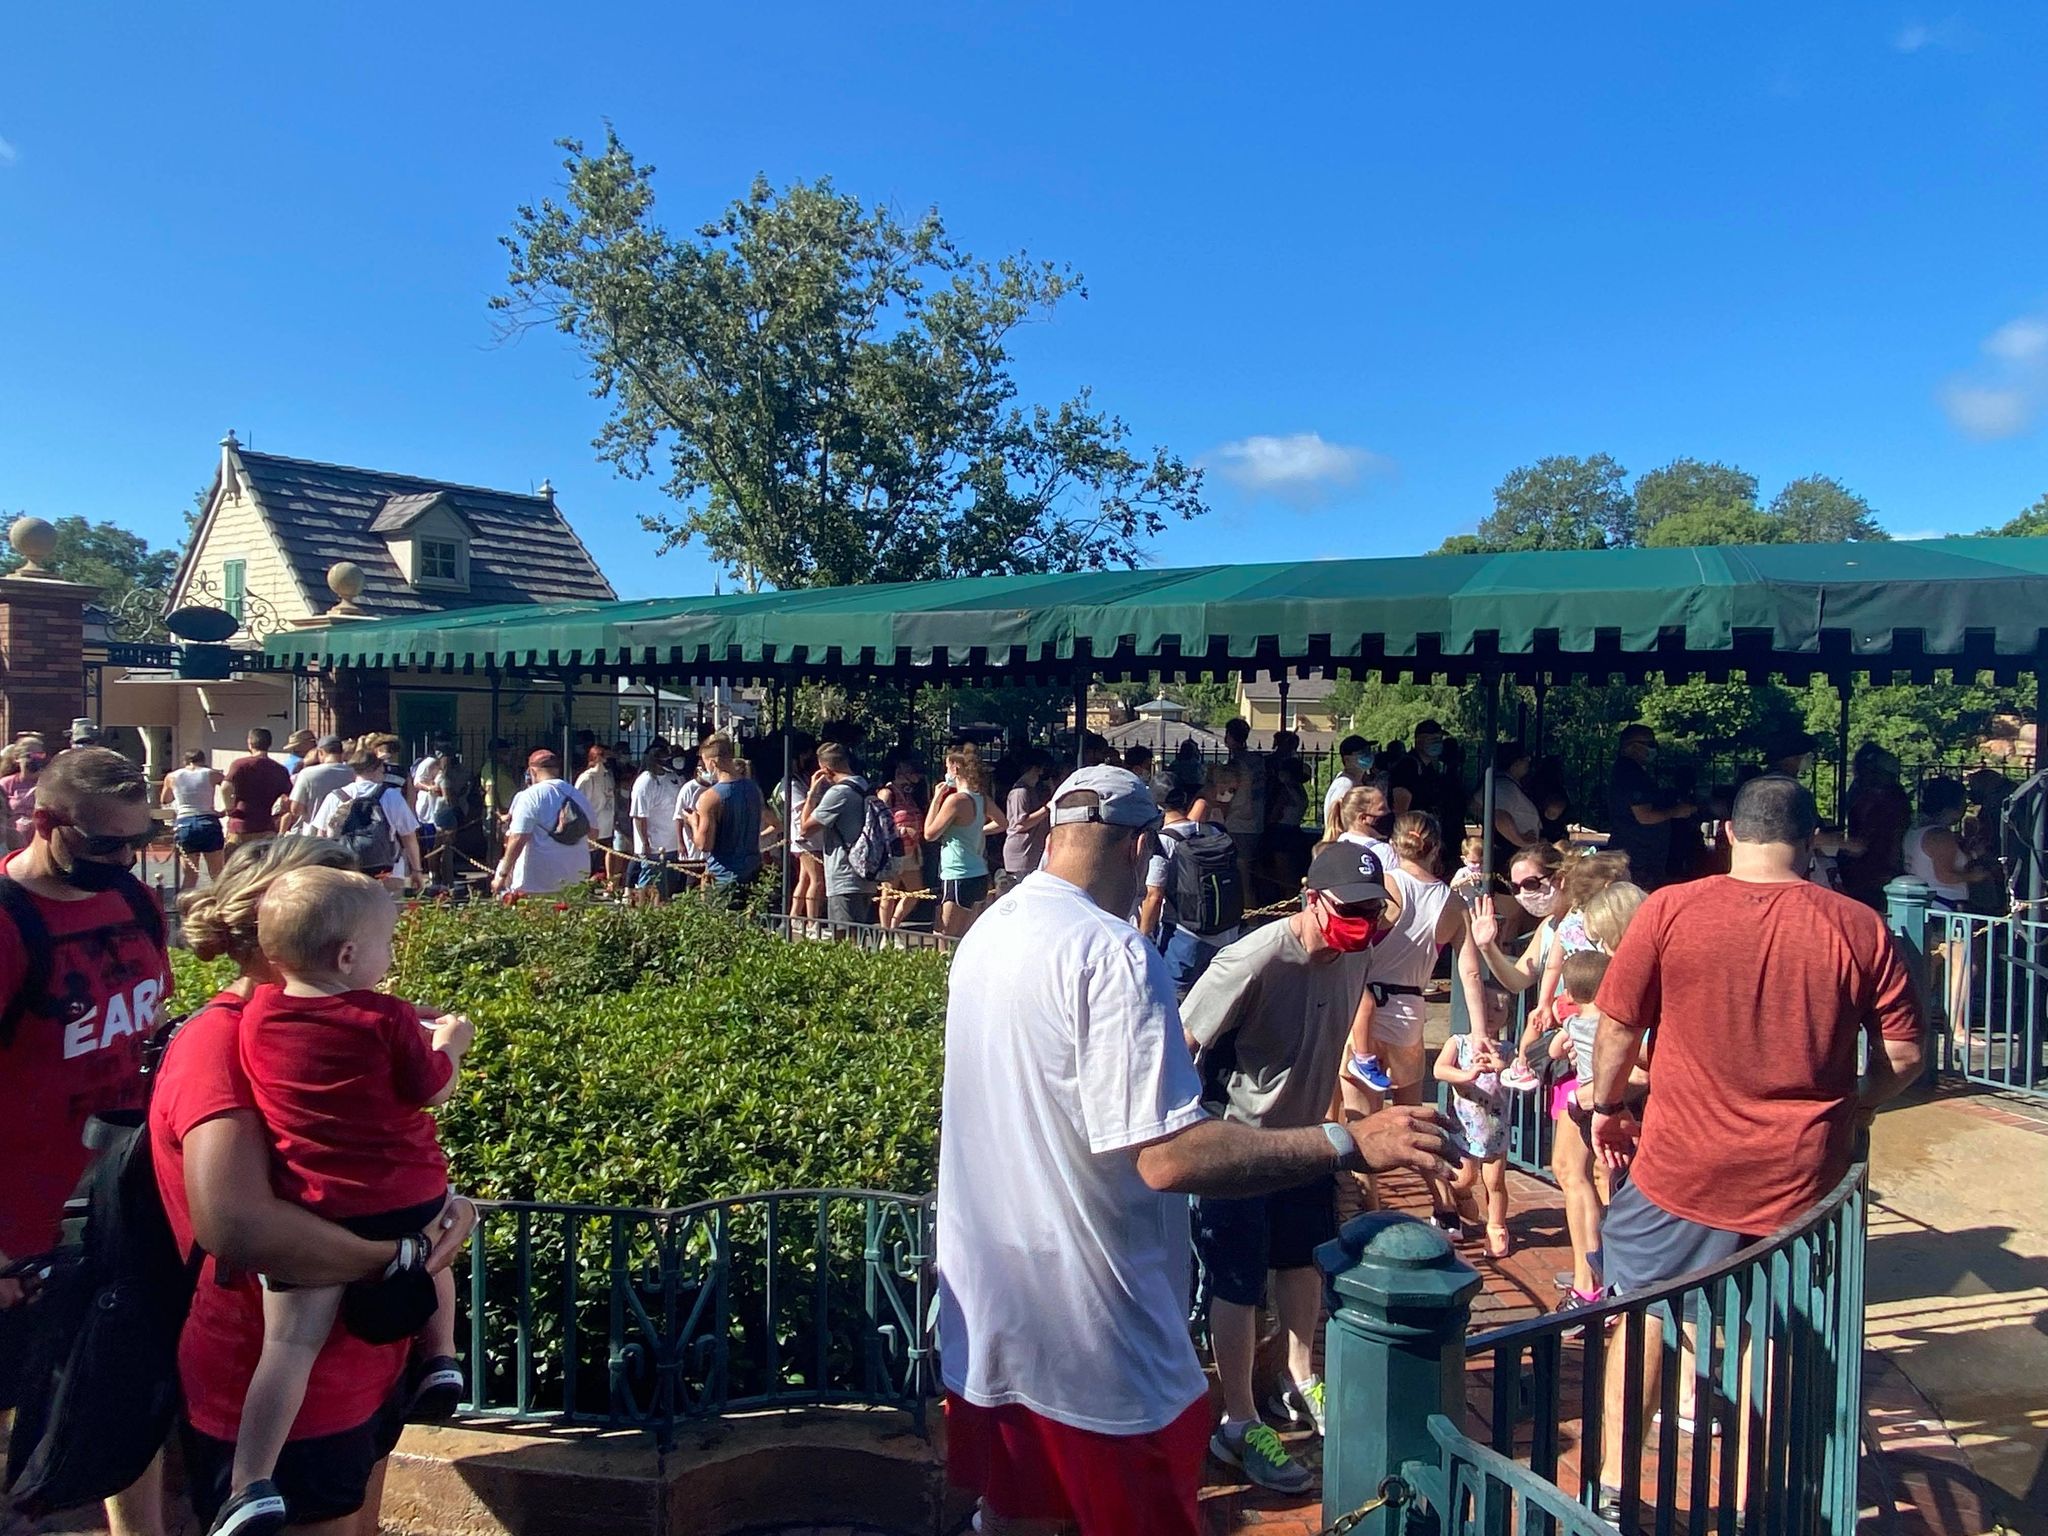
- Haunted Mansion – 65 minutes, up 7
- Pirates of the Caribbean – 60 minutes, up 8
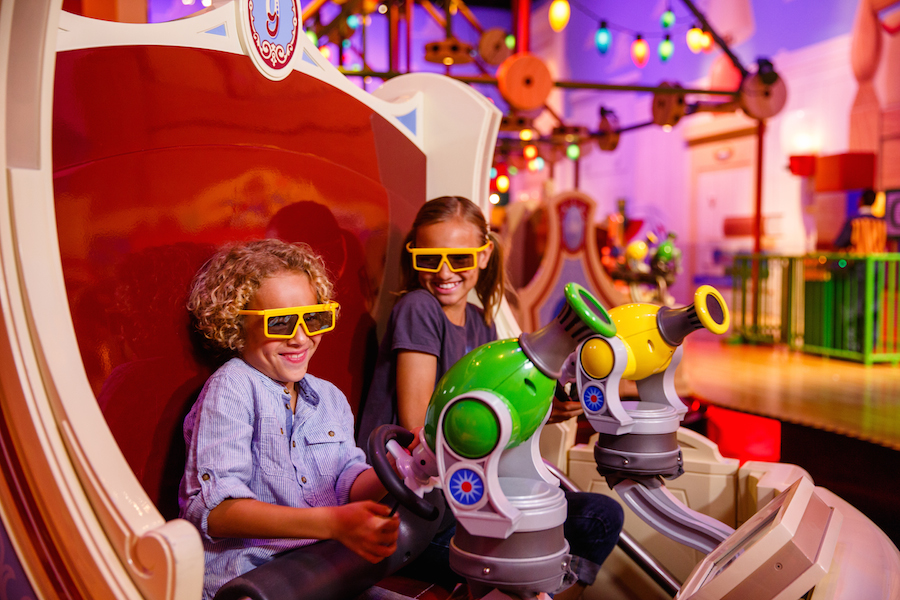
- Buzz Lightyear’s Space Ranger Spin – 55 minutes, up 6
- It’s a Small World – 47 minutes, no change
- Astro Orbiter – 46 minutes, down 4
- The Many Adventures of Winnie the Pooh – 46 minutes, up 5
- Under the Sea ~ Journey of the Little Mermaid – 44 minutes, up 6
- Big Thunder Mountain Railroad – 41 minutes, down 2
- Dumbo the Flying Elephant – 39 minutes, up 2
- Tomorrowland Speedway – 35 minutes, up 5
- The Magic Carpets of Aladdin – 30 minutes, up 4
- Prince Charming Regal Carrousel – 28 minutes, up 7
- Mickey’s PhilharMagic – 26 minutes, up 4
- Mad Tea Party – 20 minutes, no change
- Country Bear Jamboree – 7 minutes, no change
- Walt Disney’s Carousel of Progress – 7 minutes, up 1
So, the Jungle Cruise theory I had last week is correct. The movie has renewed interest in the attraction.
Otherwise, this is a horror show, as Magic Kingdom rides averaged a 48-minute wait, which is up five minutes from last week.
Also, Magic Kingdom’s overall wait times have increased by nearly 20 minutes in five weeks.
Walt Disney World trended up overall with its wait times. However, they should peak in August and then decline.
Everything would look much more reasonable if FastPasses came back, though.
Feature Image: @bioreconstruct on Twitter