Disneyland Wait Times for April 2024
We have officially survived the winter and made it into spring.
Then again, the beauty of Southern California is that it’s usually sunny and warm, even in the winter.
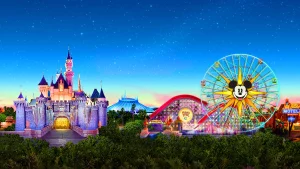
Photo: Disney Parks
So, guests love to escape to The Happiest Place on Earth, which explains a lot about what we’re about to discuss.
Here are the Disneyland wait times for April 2024.
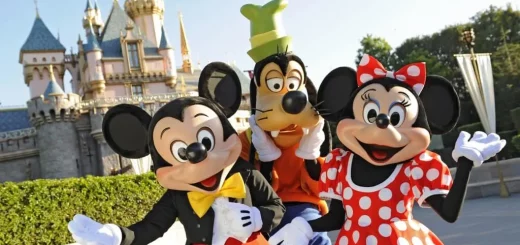
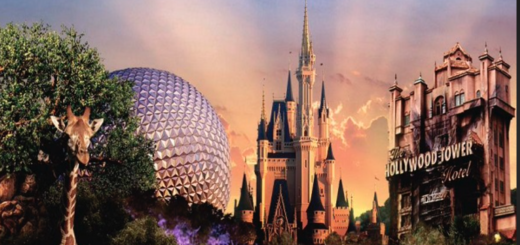
About Disneyland Resort
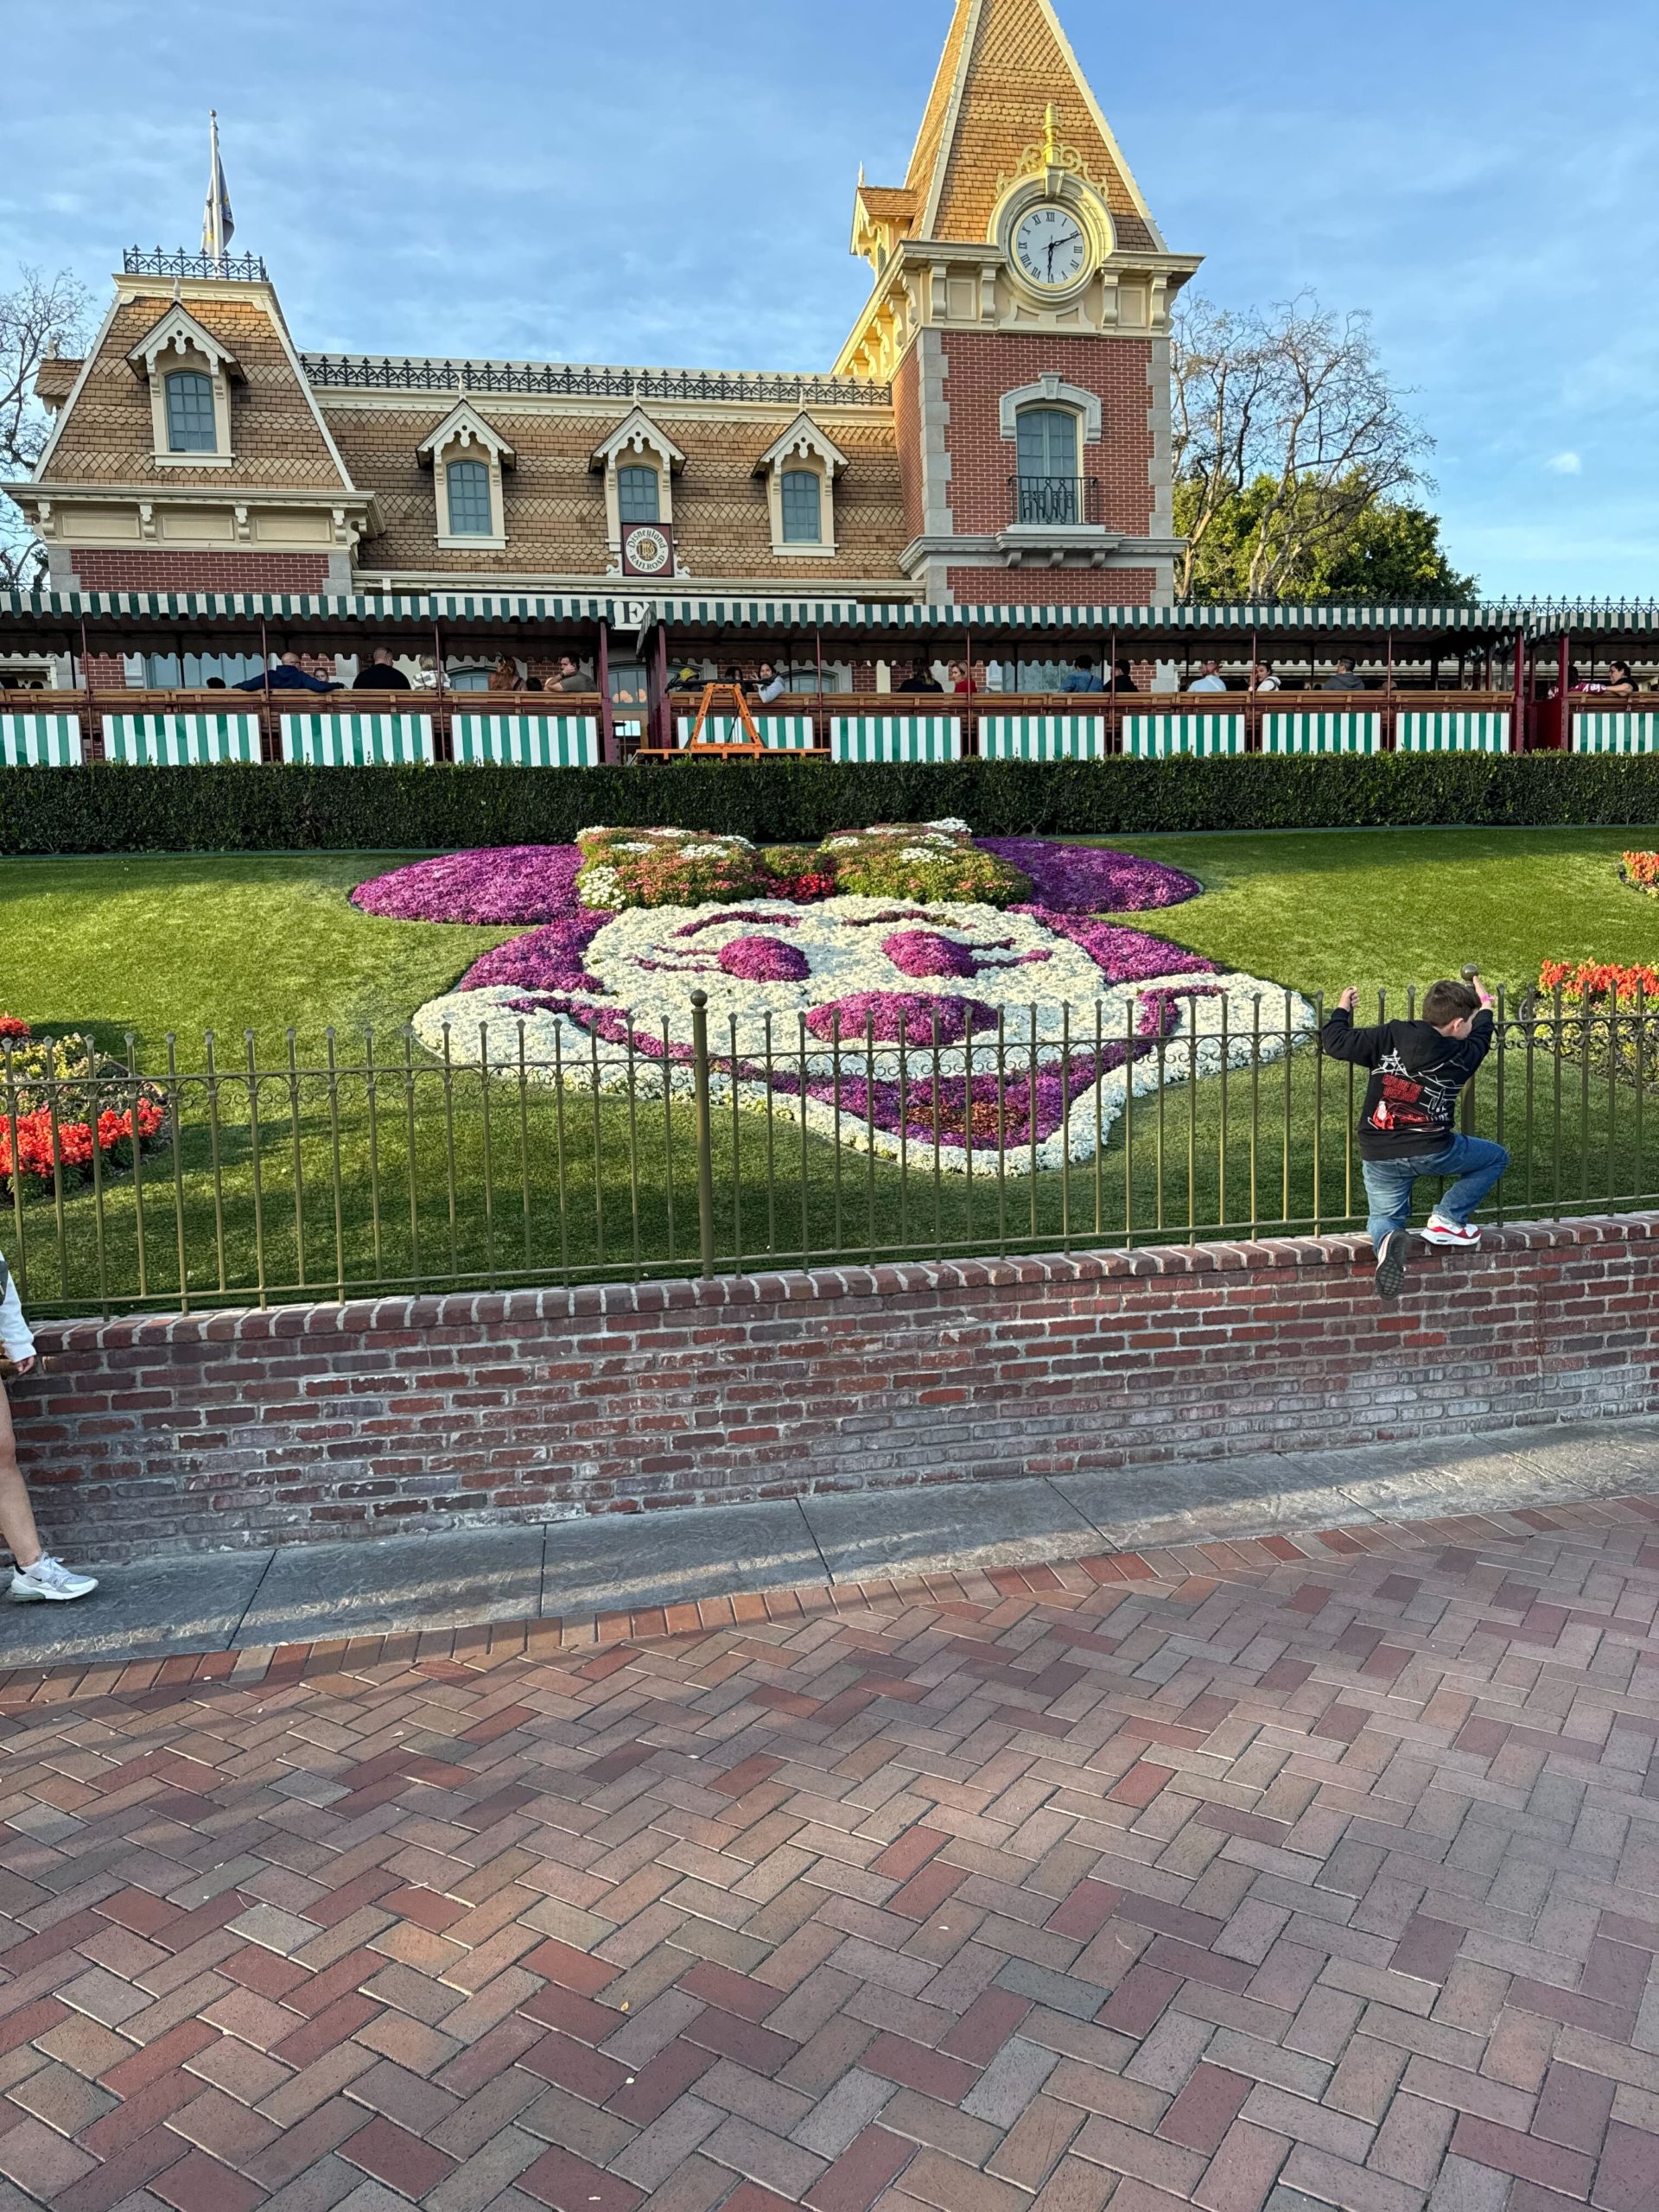
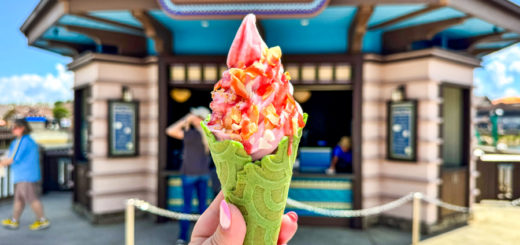
Floral Minnie Mouse at Disneyland
First, as a reminder, I lazily name this article, as it’s really an evaluation of the wait times from the previous month.
We have no idea what the future holds, which is what would be required otherwise.
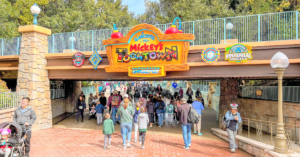
Also, we should remember that Disneyland has entered a transitional phase.
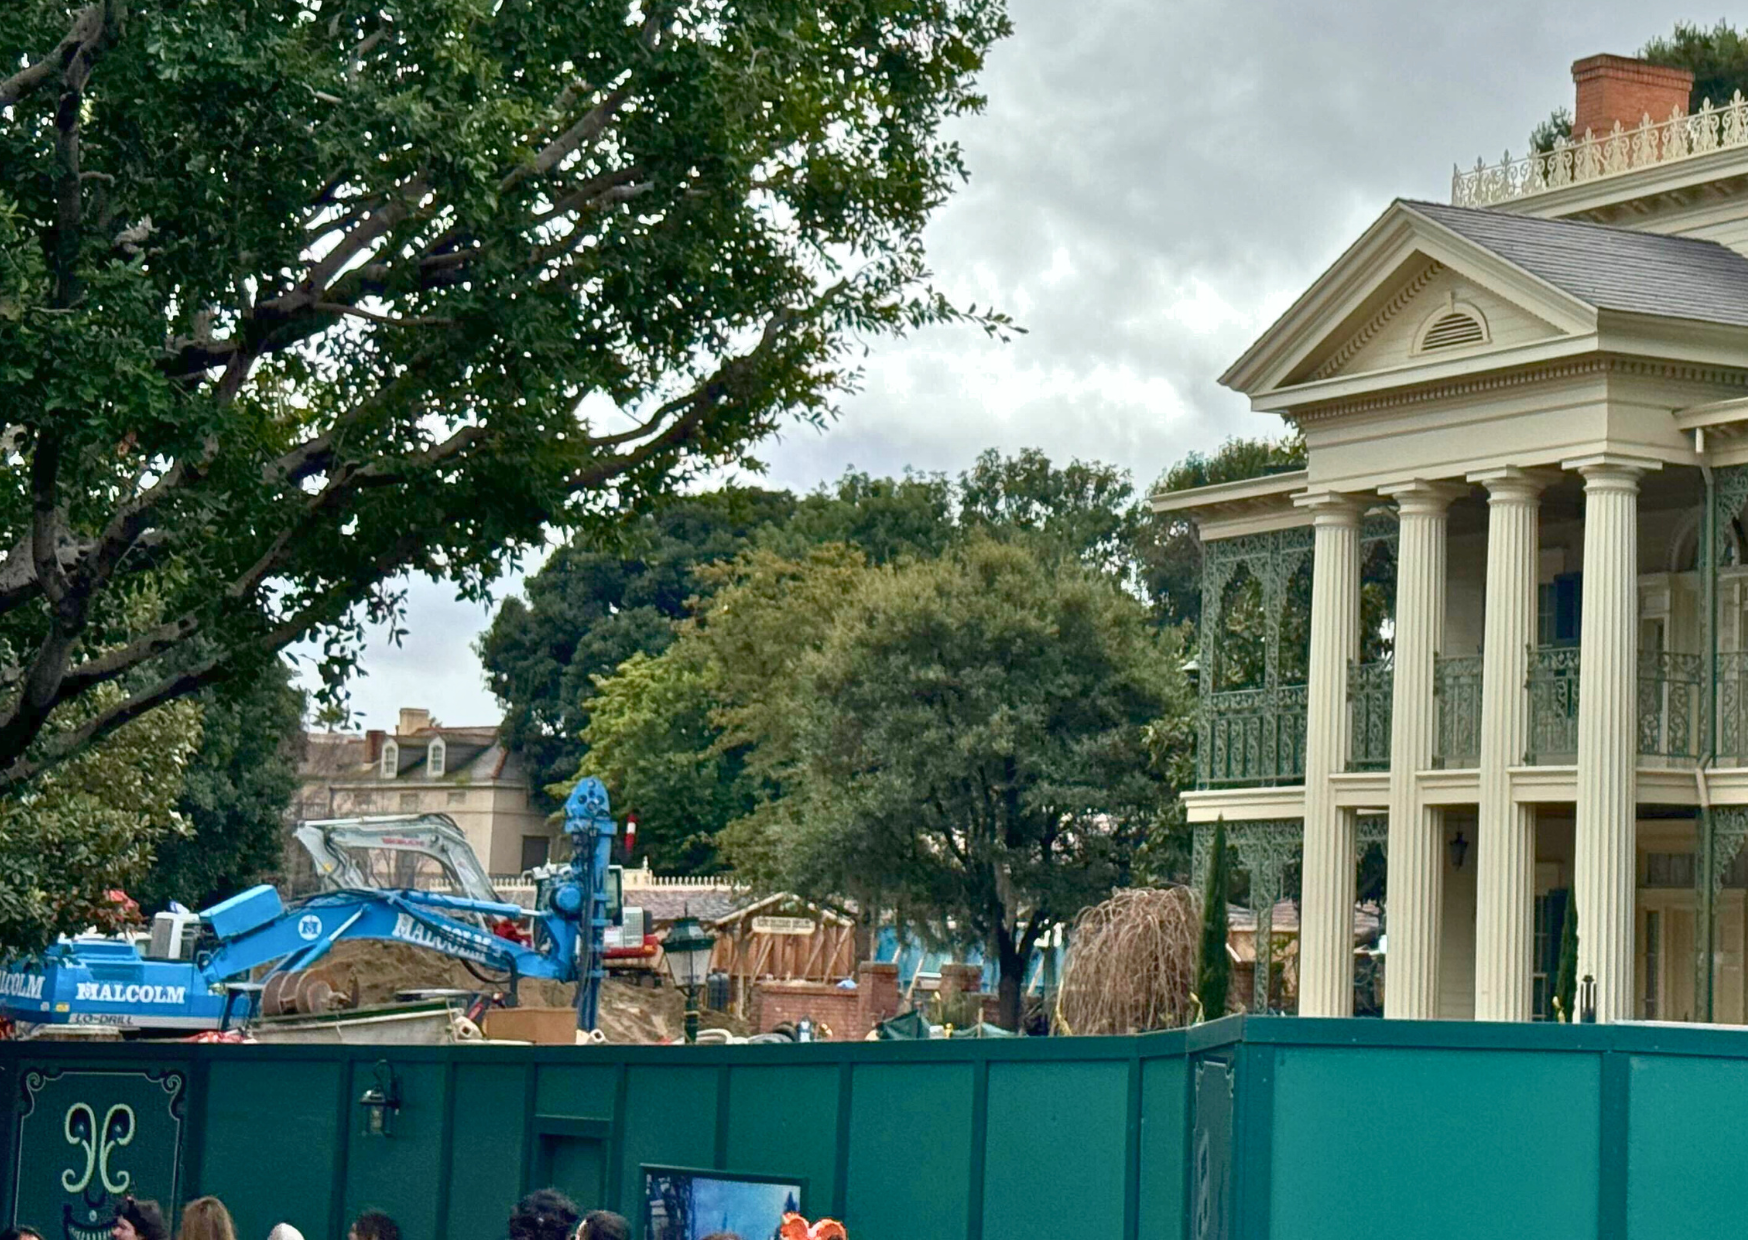
Park officials have closed Haunted Mansion Holiday and won’t reopen it for a bit longer.
Walls
That’s a weird thing to say in April about a Halloween/Christmas ride, but it’s true.
Disney is buffing the New Orleans Square, with the Haunted Mansion campus a particular area of focus.
Haunted Mansion
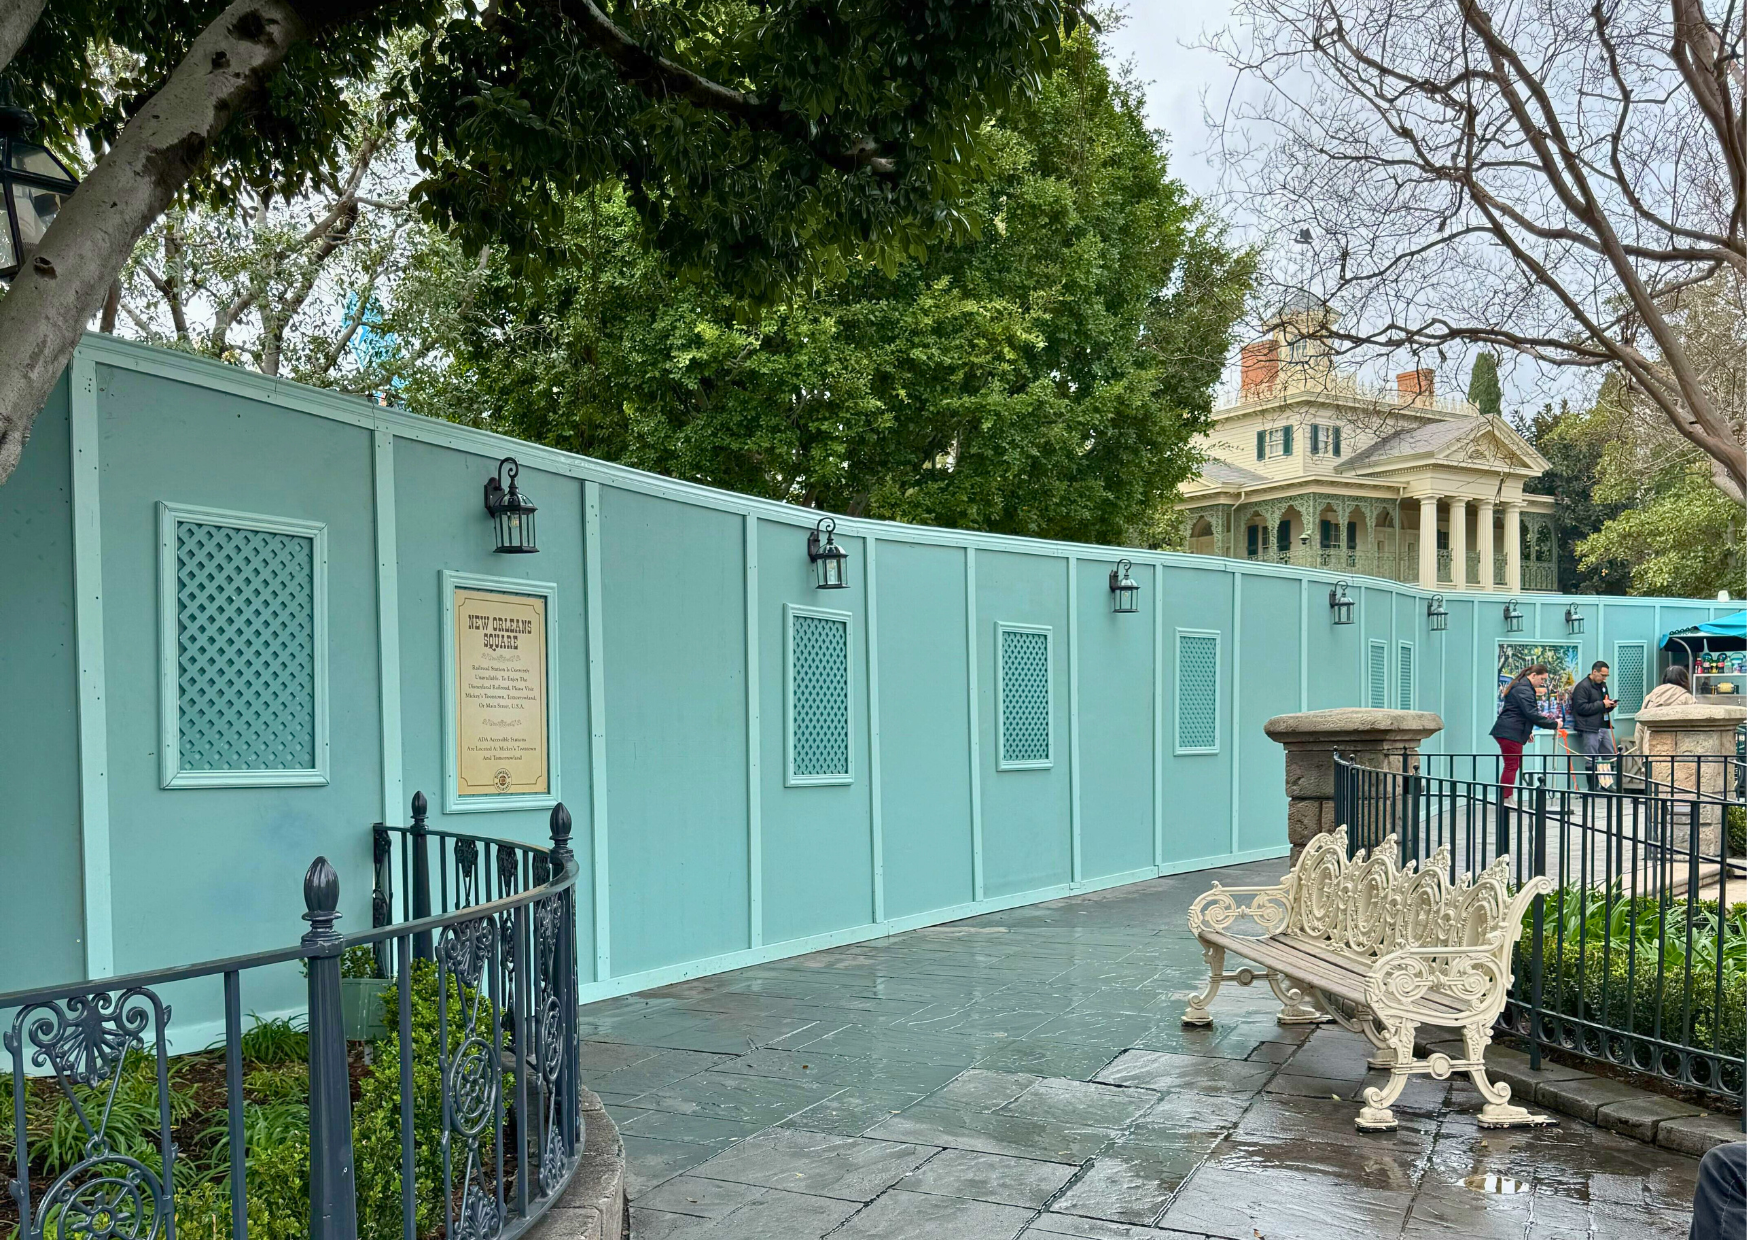
So, some of the wait times we’re tracking this week reflect that one of the park’s most iconic rides remains offline.
Disney has also refurbished some others during the past few weeks as well.
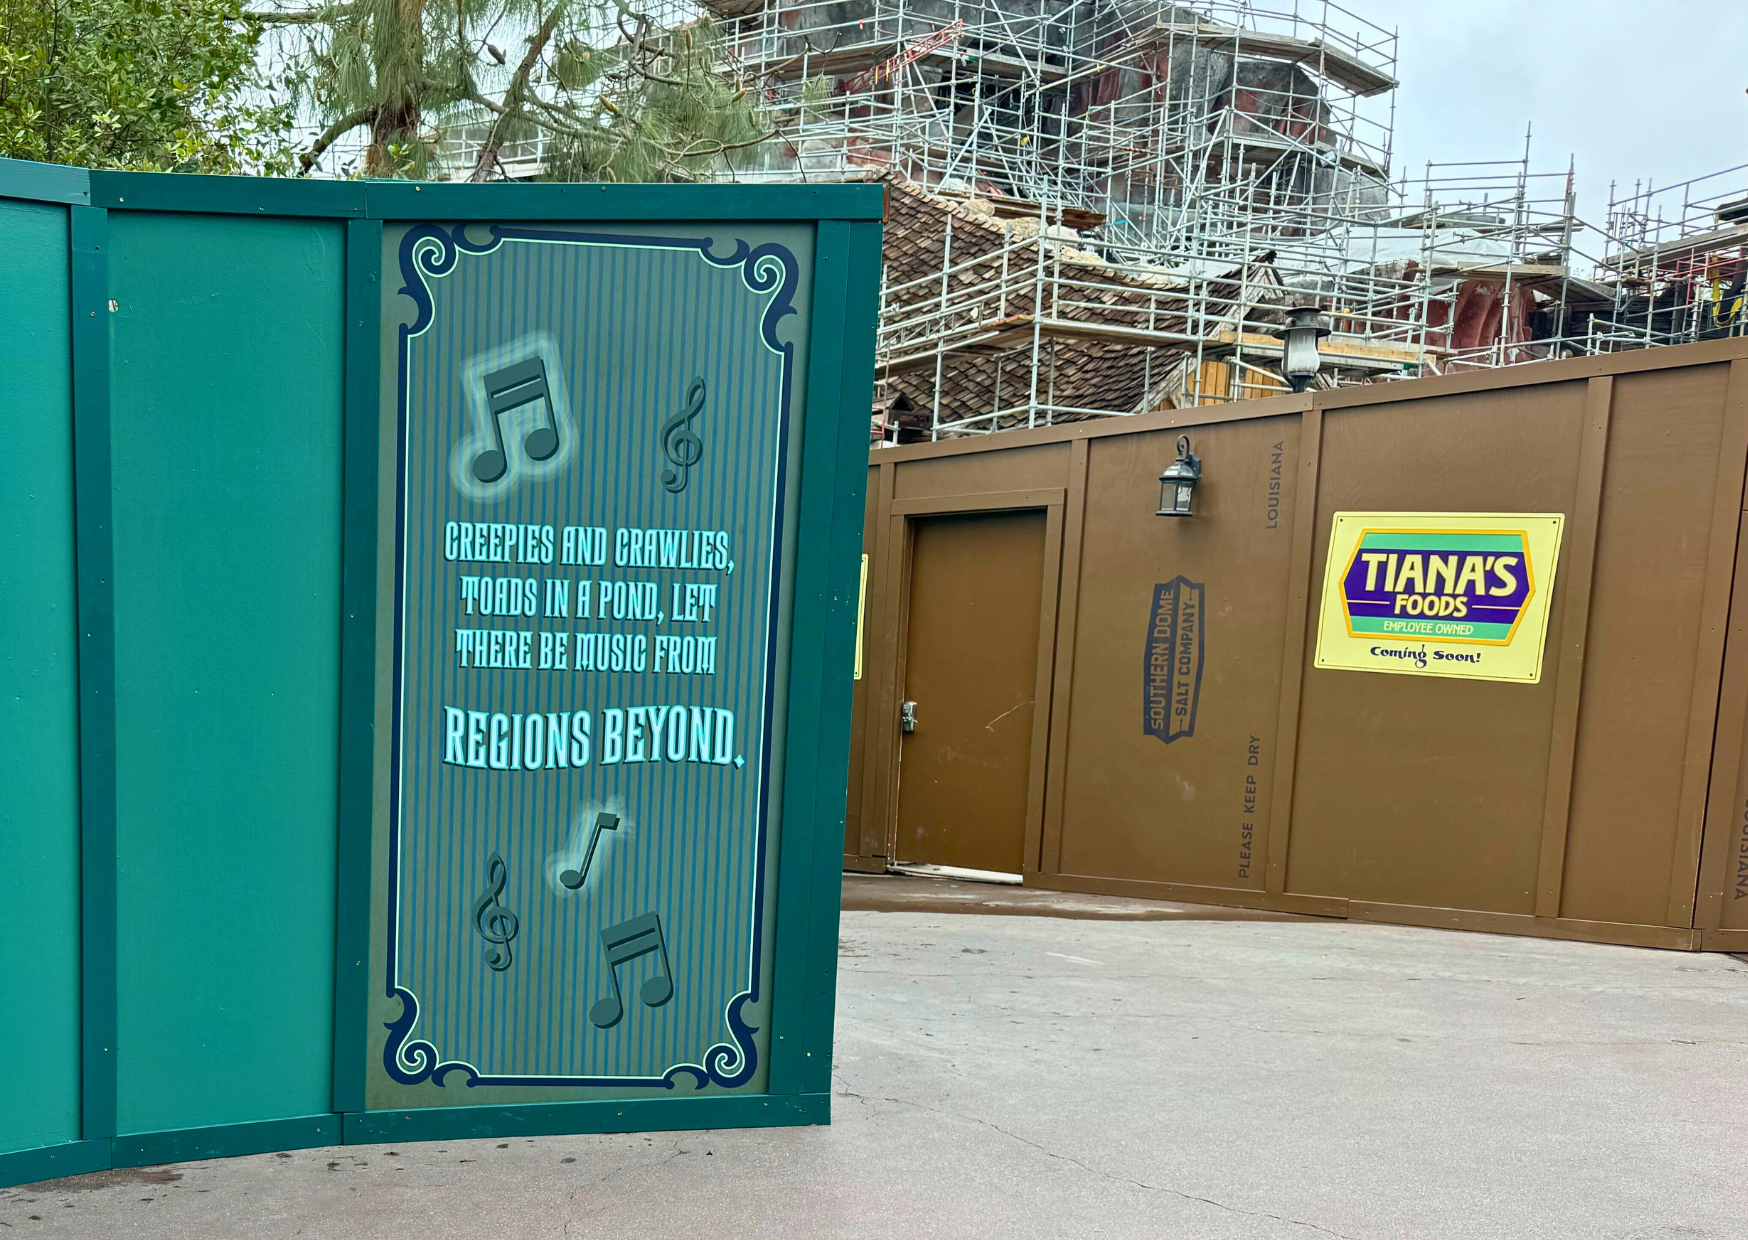
More Walls
That’s not unusual, though. During the offseason, Disneyland cycles through improvements at times when the park is less crowded.
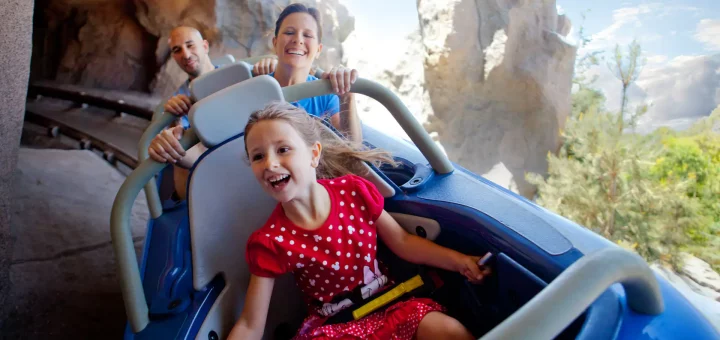
Average Wait Times at Disneyland Park
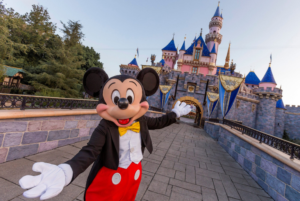
Image: Disney
So, was Disneyland less crowded this past month? Let’s find out!
Here are the park’s average wait times:
- Star Wars: Rise of the Resistance – 70 minutes, up 1
- Space Mountain – 61 minutes, up 1
- Matterhorn Bobsleds – 60 minutes, up 9
- Indiana Jones Adventure – 57 minutes, up 5
- Roger Rabbit’s Car Toon Spin – 51 minutes, up 2
- Big Thunder Mountain Railroad – 47 minutes, up 5
- Mickey & Minnie’s Runaway Railway – 46 minutes, up 1
- Millennium Falcon: Smugglers Run – 43 minutes, up 2
- Peter Pan’s Flight – 42 minutes, no change
- Chip ‘n’ Dale’s GADGETCoaster – 41 minutes, up 1
- Dumbo the Flying Elephant – 38 minutes, up 4
- Meet Mickey Mouse at Mickey’s House – 37 minutes, up 4
- Buzz Lightyear’s Astro Blasters – 36 minutes, up 4
- Star Tours – The Adventures Continue – 35 minutes, up 3
- Alice in Wonderland – 34 minutes, down 1
- Pirates of the Caribbean – 34 minutes, up 2
- Jungle Cruise – 32 minutes, up 2
- Autopia – 30 minutes, down 1
- Finding Nemo Submarine Voyage – 29 minutes, up 3
- Snow White’s Enchanted Wish – 25 minutes, up 1
- Toad’s Wild Ride – 24 minutes, no change
- Casey Jr. Circus Train – 23 minutes, no change
- It’s a Small World – 21 minutes, up 1
- Pinocchio’s Daring Journey – 20 minutes, up 1
- Storybook Land Canal Boats – 20 minutes, down 1
- Mad Tea Party – 18 minutes, no change
- Davy Crockett’s Explorer Canoes – 16 minutes, up 2
- The Many Adventures of Winnie the Pooh – 16 minutes, no change
- King Arthur Carrousel – 15 minutes, no change
- Disneyland Monorail – 10 minutes, no change
Photo: CNtraveler.com
Overall, Disneyland Parks guests waited for an average of 34 minutes per attraction. That’s two minutes more than last time.
So, crowds ticked up at Disneyland, but it wasn’t an overwhelming attendance increase.
About Disney California Adventure
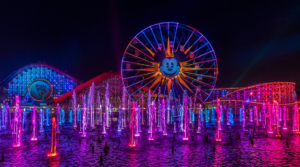
Photo: DIsneyland
At Disney California Adventure, the crowds sometimes behave differently.
What I mean by that is this park hosts fewer attractions.
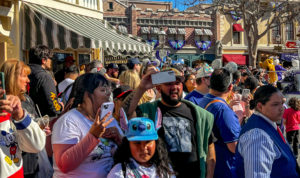
Crowds
Don’t get me wrong. You’ll find a good amount of them, but it’s a shorter list than Disneyland Park.
So, larger crowds tend to cause more fluctuations in the average wait times here.
For this reason, DCA is better for evaluating actual crowd behavior relative to Disneyland.
The latter park offers such a comprehensive list of theme park attractions that its average wait times are harder to impact.

(Christian Thompson/Disneyland Resort)
One ride needs to increase its average wait by 40 minutes for the overall wait time to increase by a single minute.
Since DCA hosts (less than) half the attractions, its ripple effects have a deeper effect.
Average Wait Times at Disney California Adventure

Photo: Disney
Keeping the above in mind, here are DCA’s average wait times last month:
- Radiator Springs Racers – 92 minutes, up 1
- Soarin’ Over California – 59 minutes, up 13
- Guardians of the Galaxy – Mission: BREAKOUT! – 58 minutes, up 4
- Toy Story Midway Mania! – 57 minutes, up 1
- WEBSLINGERS: A Spider-Man Adventure – 55 minutes, up 5
- Goofy’s Sky School – 51 minutes, up 5
- Monsters, Inc. Mike & Sulley to the Rescue! – 49 minutes, up 4
- The Incredicoaster – 44 minutes, up 7
- Pixar Pal-A-Round – 39 minutes, up 4
- Inside Out Emotional Whirlwind – 27 minutes, no change
- Mater’s Junkyard Jamboree – 24 minutes, up 1
- Grizzly River Run – 23 minutes, n/a
- The Little Mermaid ~ Ariel’s Undersea Adventure – 22 minutes, up 1
- Silly Symphony Swings – 19 minutes, up 2
- Jumpin’ Jellyfish – 17 minutes, up 2
- Golden Zephyr – 16 minutes, up 1
- Mickey’s PhilharMagic – 12 minutes, down 1
- Jessie’s Critter Carousel – 10 minutes, up 1

(Joshua Sudock/Disneyland Resort)
Overall, Disney California Adventure visitors waited for an average of 37 minutes per attraction.
That’s four minutes or 12 percent more than the previous month…and pretty much as I’d expected.
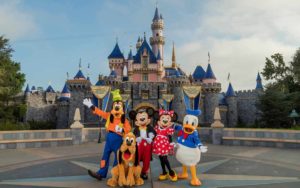
Photo: Travel and Leisure
Disneyland crowds ticked up a bit, but it wasn’t a sizable amount.
We’ll notice larger crowds as Memorial Day Weekend approaches, which gives Disneyland fans another two months of emptier parks.
MickeyBlog Logo
Thanks for visiting MickeyBlog.com! Want to go to Disney? For a FREE quote on your next Disney vacation, please fill out the form below, and one of the agents from MickeyTravels, a Diamond Level Authorized Disney Vacation Planner, will be in touch soon!
Feature Photo: Disney