Walt Disney World Wait Times for Early January 2024
Okay, the holidays have ended, but you shouldn’t think that the parks are empty now.
In case you somehow missed the news, the 2024 EPCOT International Festival of the Arts has opened.
So, we’ll enjoy the festivities for the next several weeks, which will keep the crowds sizable, at least by historical January standards.
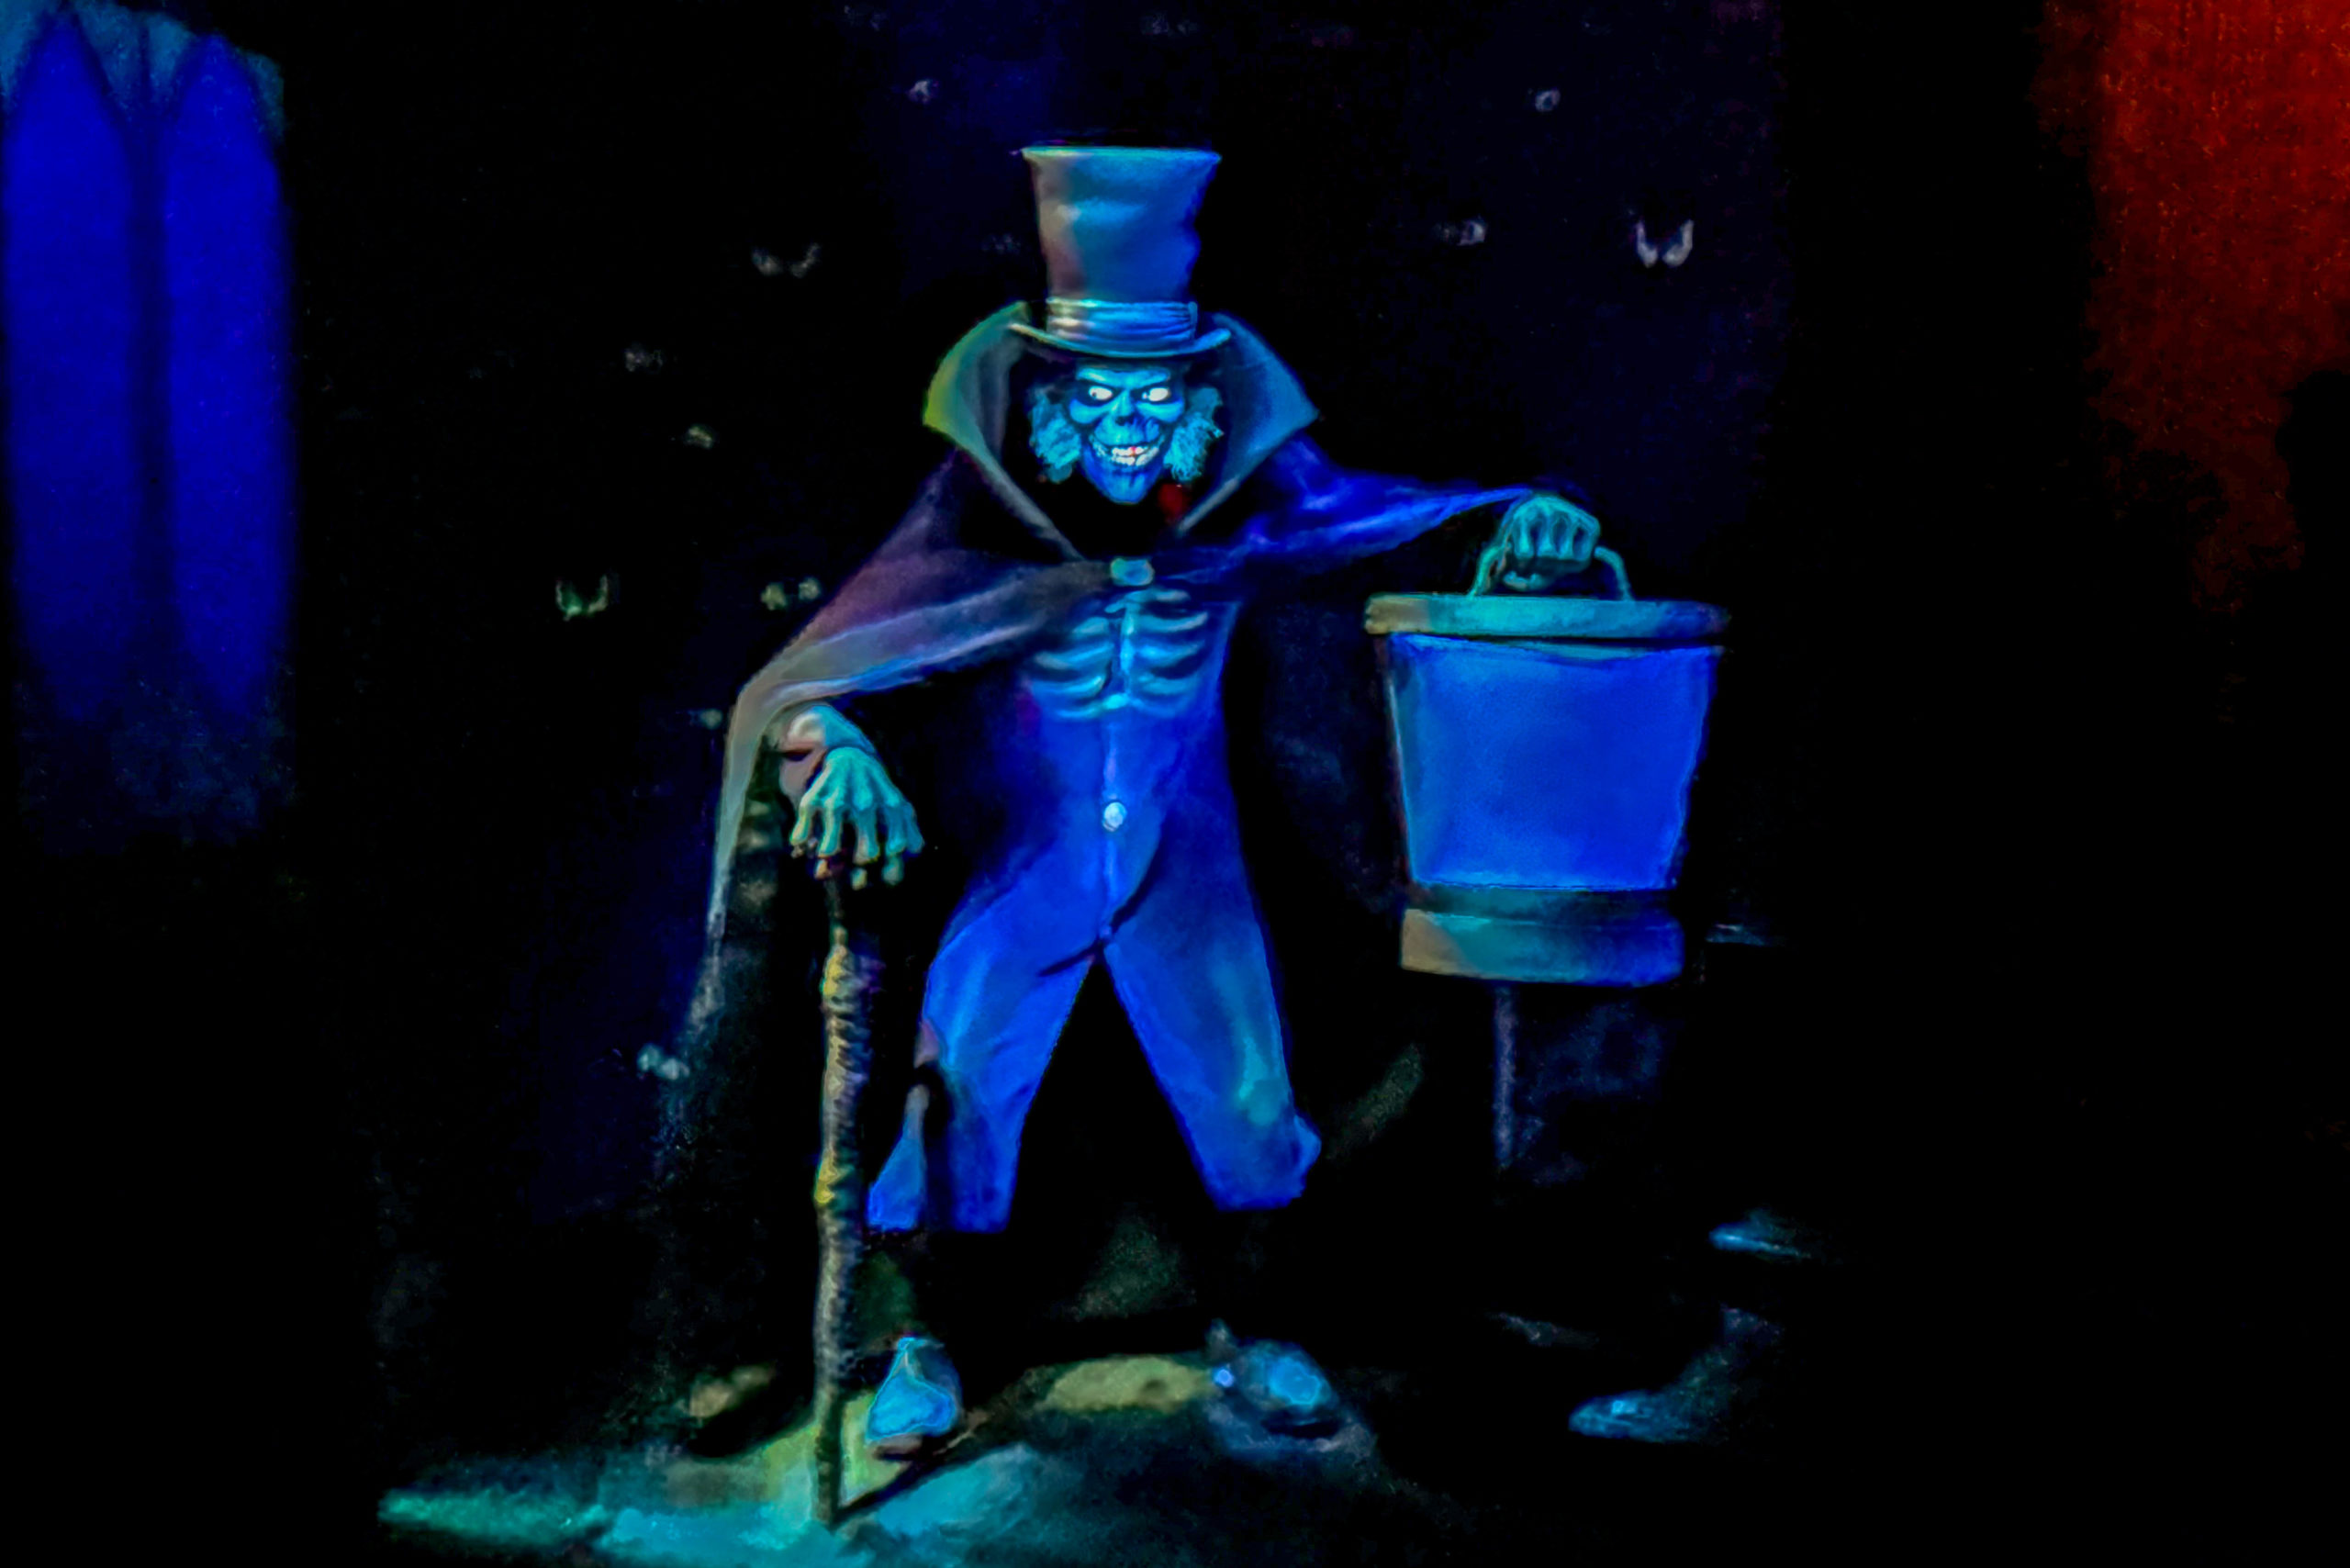
Hatbox Ghost
Here are the Walt Disney World wait times for the second week of January 2024.
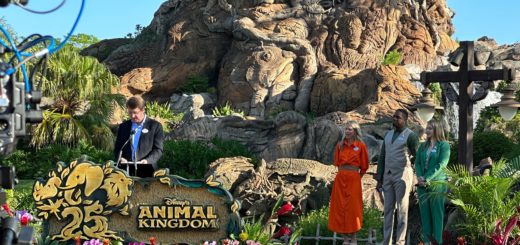
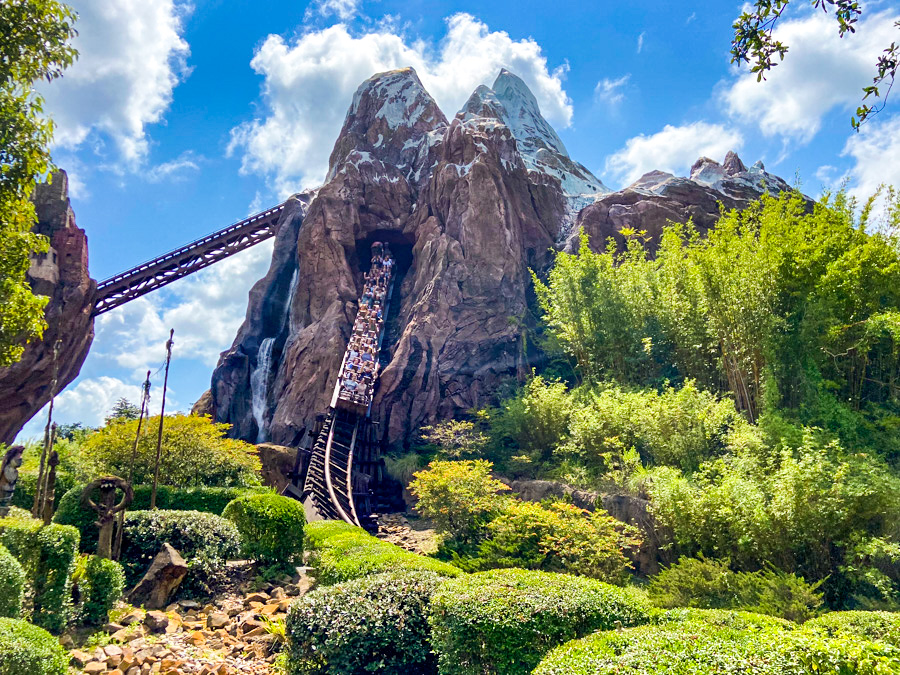
Disney’s Animal Kingdom
Okay, I think we can safely say that the worst is over at Animal Kingdom.
Three-hour waits at Avatar Flight of Passage definitely aren’t the norm, and we all hope they never will be.
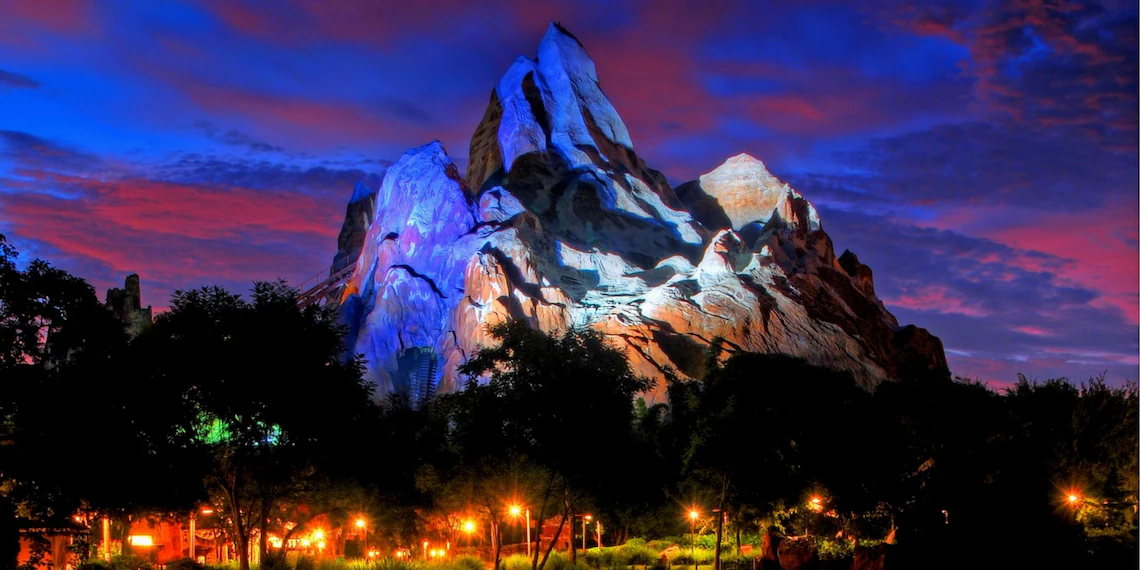
Photo: Disney
A favorable calendar configuration ensured historically large crowds at the park during the end of 2023 and start of 2024.
Normalcy should have returned…but did it? Here are Animal Kingdom’s average wait times last week:
- Avatar Flight of Passage – 98 minutes, down 85
- Na’ Vi River Journey – 71 minutes, up 3
- Adventurers Outpost – 45 minutes, down 3
- Expedition Everest – 40 minutes, up 2
- Kilimanjaro Safaris – 30 minutes, down 3
- DINOSAUR – 25 minutes, down 7
- It’s Tough to Be a Bug! – 15 minutes, no change
- TriceraTop Spin – 10 minutes, up 3
First, as a reminder, Kali River Rapids has closed for its annual refurbishment. So, we won’t have it on the list for a while.
Since Animal Kingdom remains a bit short on attractions, having one less option inflates the wait times of the others…slightly.
Even if Kali River Rapids were open, people would still be hesitant to ride it in this weather.
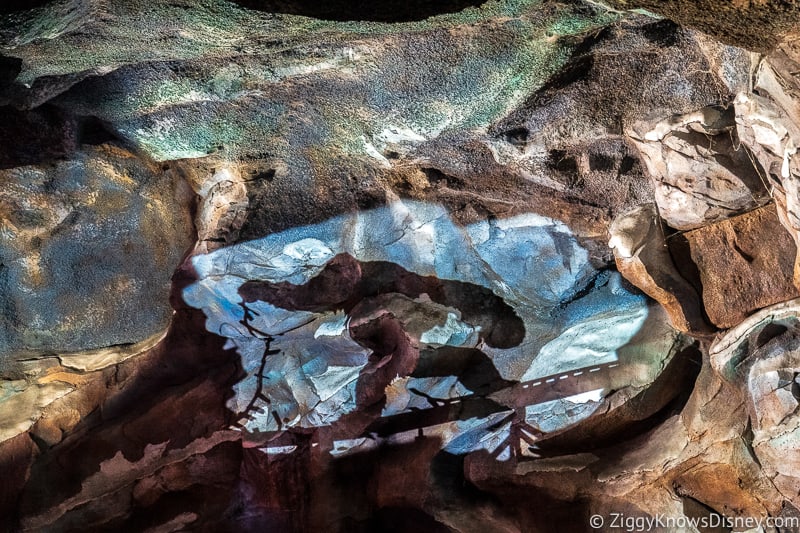
Photo: Ziggy Knows Disney
Overall, guests stood in line for an average of 42 minutes, which is six minutes less than last time.
Yes, the x-factor here is Avatar Flight of Passage. If not for its drop, Animal Kingdom’s average would have increased slightly.
Disney’s Hollywood Studios
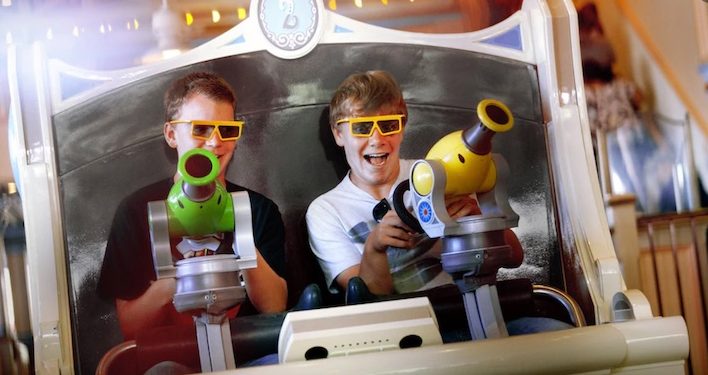
Photo: Disney
Here’s the park where sanity should have been restored after three truly insane weeks.
Here are the average waits at Hollywood Studios last week:
- Slinky Dog Dash – 104 minutes, down 29
- Star Wars: Rise of the Resistance – 98 minutes, down 32
- Toy Story Mania! – 73 minutes, down 13
- Twilight Zone Tower of Terror – 70 minutes, down 27
- Millennium Falcon: Smugglers Run – 65 minutes, down 40
- Mickey & Minnie’s Runaway Railway – 63 minutes, down 19
- Red Carpet Dreams – 39 minutes, down 8
- Alien Swirling Saucers – 38 minutes, down 11
- Celebrity Spotlight – 21 minutes, down 6
- Star Tours – The Adventures Continue! – 18 minutes, down 18
- Lightning McQueen’s Racing Academy – 15 minutes, no change
- Muppet*Vision 3D – 10 minutes, no change
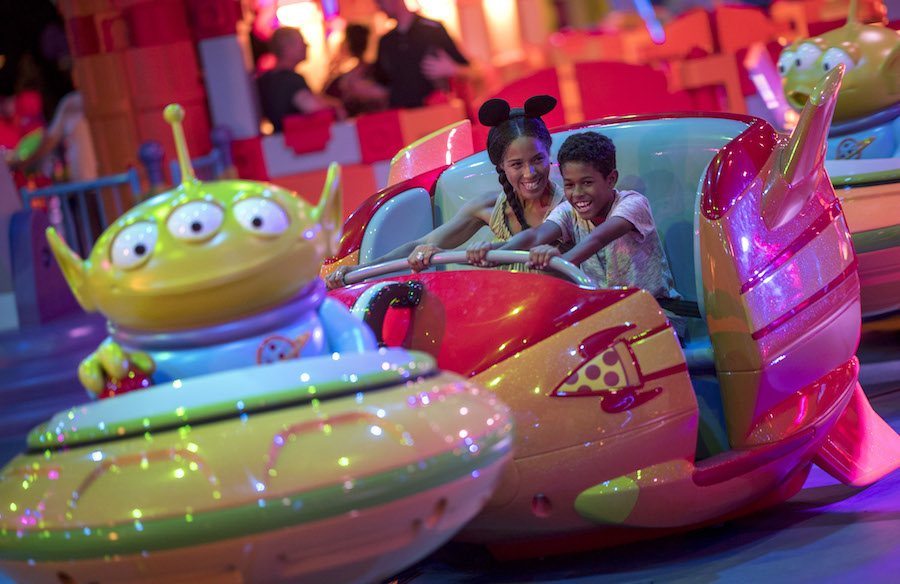
Photo: Disney
Okay, that’s a relief, isn’t it? The average wait at Hollywood Studios fell to 45 minutes, which is a drop of 20 minutes.
We still had six attractions average hourlong waits, but that’s far better than what we tracked during the holidays.
EPCOT
Photo: Disney
Here’s the park that theoretically should decline the most. I say this because the festival didn’t start until Friday.
So, most of this week’s data won’t include the festival crowds.
Meanwhile, the holiday crowds definitely returned home before this point.
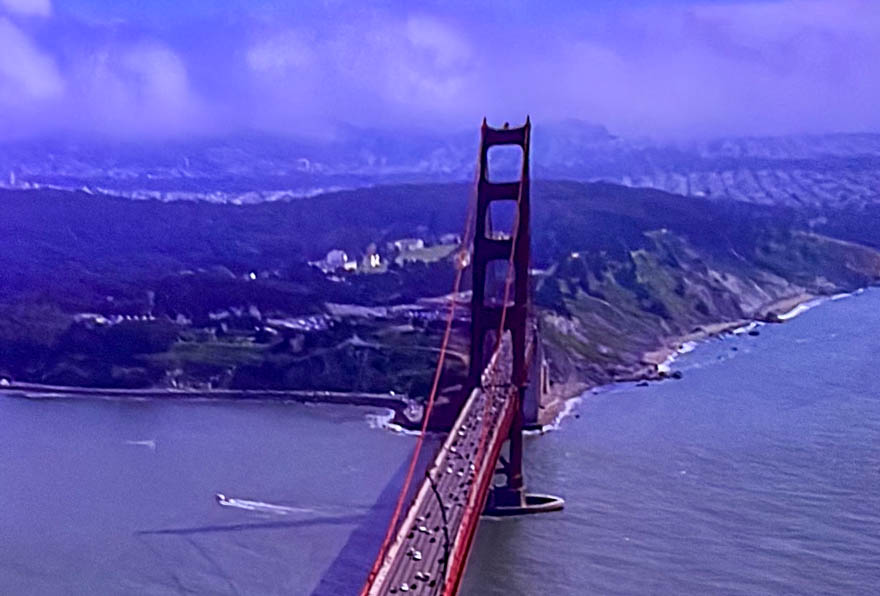
Soarin’ Over California
Here are EPCOT’s wait times last week:
- Remy’s Ratatouille Adventure – 83 minutes, down 29
- Frozen Ever After – 75 minutes, down 18
- Test Track – 69 minutes, down 22
- Soarin’ Around the World– 49 minutes, down 18
- Royal Sommerhus – 35 minutes, down 4
- Mission: SPACE – 25 minutes, down 19
- Spaceship Earth – 21 minutes, down 10
- Turtle Talk with Crush – 19 minutes, down 2
- The Seas with Nemo & Friends – 16 minutes, down 6
- Living with the Land – 14 minutes, down 3
- Journey into Imagination with Figment – 13 minutes, down 8
- Gran Fiesta Tour Starring the Three Caballeros – 12 minutes, down 3
Overall, EPCOT guests stood in line for an average of 36 minutes per attraction, which is 11 minutes less than last time.
Magic Kingdom
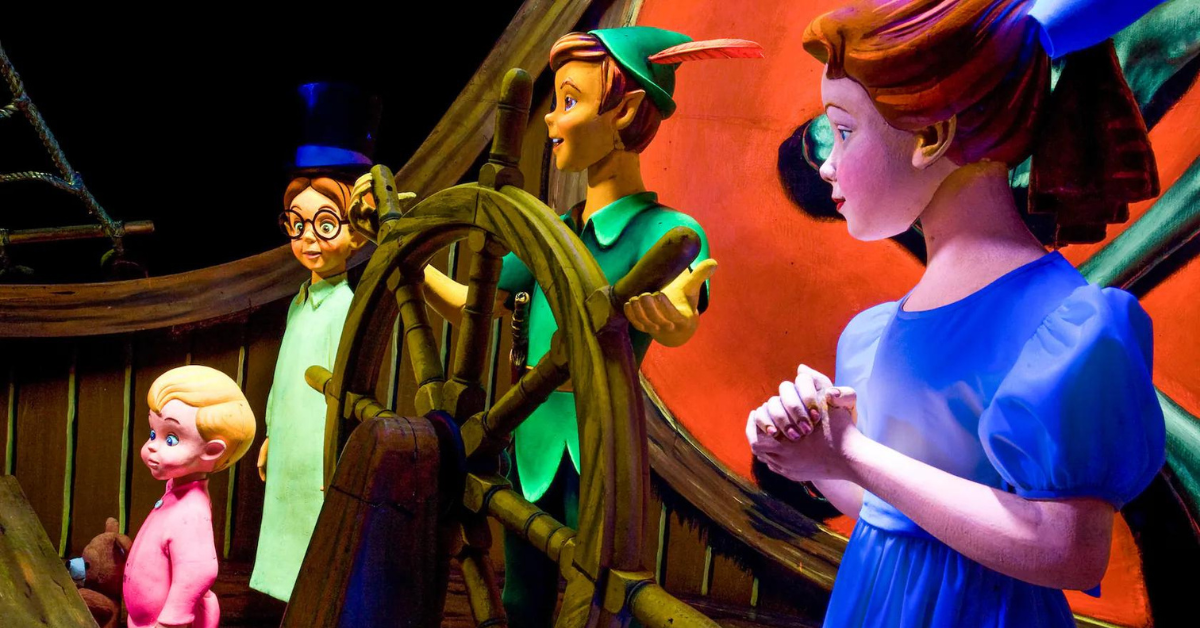
Photo: Disney
Finally, we have the most popular theme park on the planet.
Here are Magic Kingdom’s average wait times last week:
- Seven Dwarfs Mine Train – 88 minutes, down 25
- Peter Pan’s Flight – 72 minutes, down 17
- Space Mountain – 66 minutes, down 26
- Jungle Cruise – 57 minutes, down 14
- Big Thunder Mountain Railroad – 53 minutes, down 15
- Haunted Mansion – 51 minutes, down 8
- Town Square Theater – 41 minutes, down 9
- Princess Fairytale Hall – 40 minutes, down 9
- The Many Adventures of Winnie the Pooh – 39 minutes, down 7
- Buzz Lightyear’s Space Ranger Spin – 38 minutes, down 19
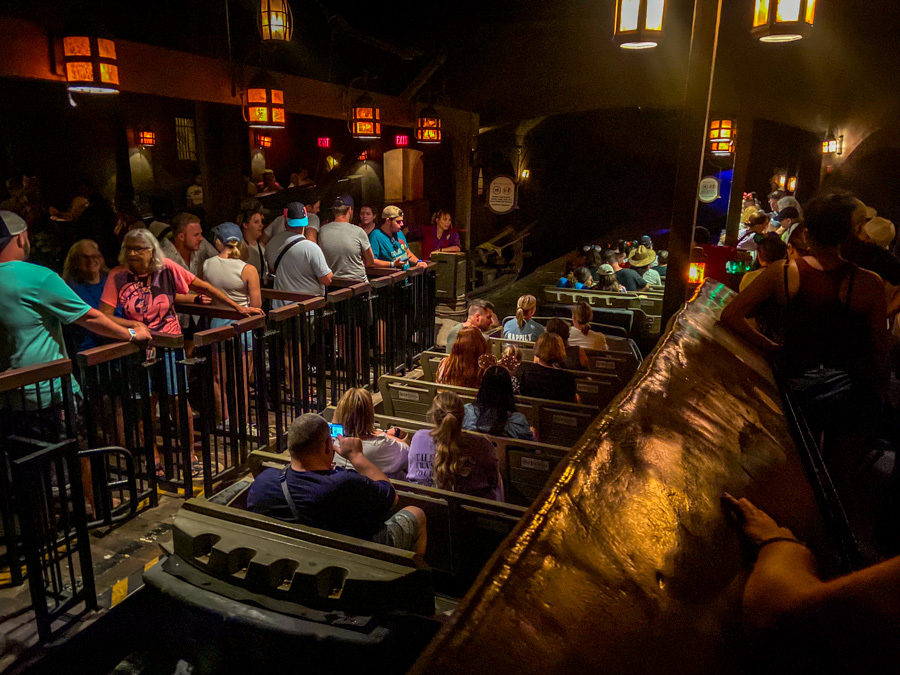
- Pirates of the Caribbean – 38 minutes, down 10
- Ariel’s Grotto – 37 minutes, down 8
- Astro Orbiter – 35 minutes, down 9
- Pete’s Silly Sideshow – 32 minutes, down 7
- Enchanted Tales with Belle – 31 minutes, down 10
- It’s a Small World – 30 minutes, down 8
- Under the Sea ~ Journey of the Little Mermaid – 28 minutes, down 10
- The Barnstormer – 27 minutes, down 14
- Dumbo the Flying Elephant – 26 minutes, down 11
- The Magic Carpets of Aladdin – 25 minutes, down 8
- Tomorrowland Speedway – 20 minutes, down 14
- Mickey’s PhilharMagic – 18 minutes, down 3
- Tomorrowland Transit Authority PeopleMover – 18 minutes, down 5
- Mad Tea Party – 17 minutes, down 9
- Walt Disney World Railroad – 17 minutes, down 12
- Country Bear Jamboree – 16 minutes, down 2
- Monsters, Inc. Laugh Floor – 15 minutes, down 5
- Prince Charming Regal Carrousel – 13 minutes, down 6
- Walt Disney’s Carousel of Progress – 5 minutes, no change
Final Thoughts
Yes, literally every attraction at Magic Kingdom lowered its average wait time last week.
Overall, guests stood in line for an average of 31 minutes per attraction, which is 11 minutes less than last time.
Photo: Disney
So, we can safely say that the holidays are over at Disney theme parks.
However, the crowds remain atypically large for January. Then again, this might be the new normal.
MickeyBlog Logo
Thanks for visiting MickeyBlog.com! Want to go to Disney? For a FREE quote on your next Disney vacation, please fill out the form below, and one of the agents from MickeyTravels, a Diamond Level Authorized Disney Vacation Planner, will be in touch soon!
Feature Photo: Disney