Walt Disney World Wait Times for Christmas Week 2023 — Disney’s Busiest Week Ever!
Have you read MickeyBlog during the holidays?
If so, you already know what I’m about to say. And if you haven’t, shame on you! Okay, I’m kidding. I know the holidays get busy for everyone.
EPCOT crowd
That statement is truest at Walt Disney World, where crowds swarmed the parks in record numbers.
As MickeyBlog tracked, Disney’s Animal Kingdom experienced its first Disney Genie+ sellout.

On multiple dates this past week, Disney Genie+ vanished almost immediately after the parks opened.
Vacationers knew the deal and purchased the FastPass replacement as quickly as possible.
Meanwhile, everyone else stood in line…and those lines were loooooooong!
Here are Walt Disney World’s wait times for Christmas Week 2023. And I can go ahead and tell you that they’re comically long.
Disney’s Animal Kingdom
Photo: OC Register
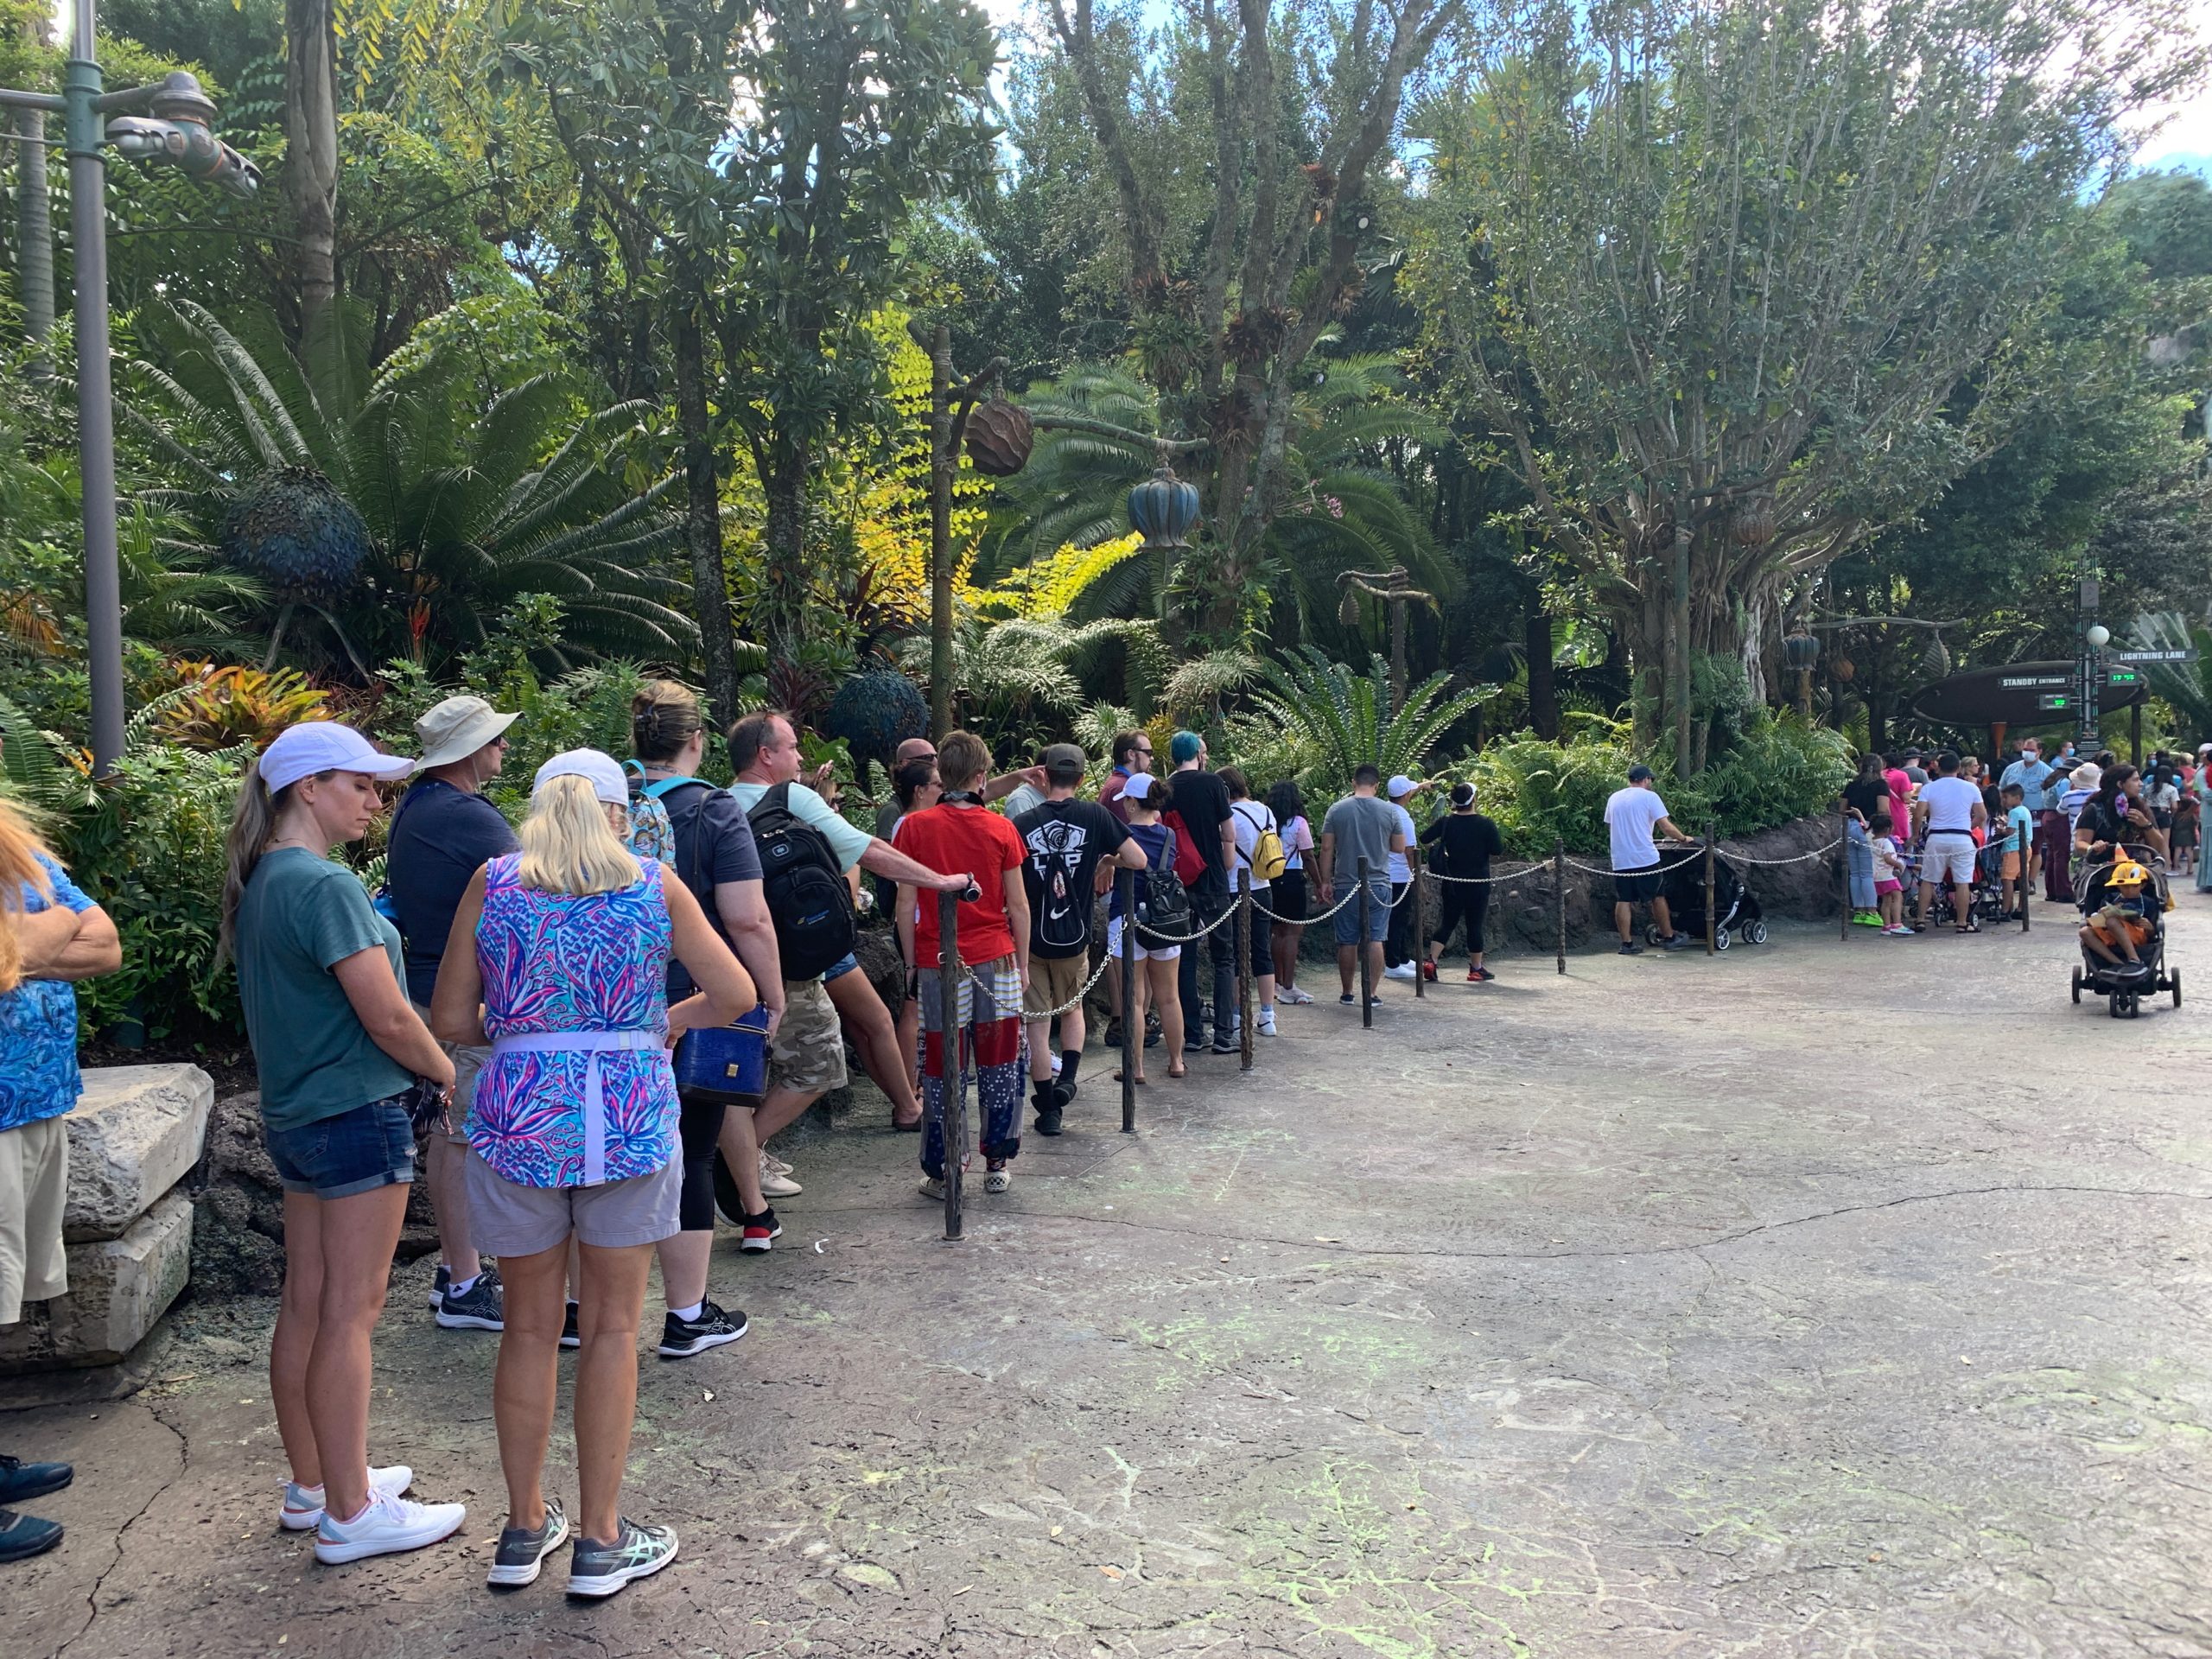
In the days that followed Christmas, some reports involving Avatar Flight of Passage were mind-blowing.
I had non-Disney friends joking about the five-hour estimated wait times for the attraction.
The posted wait times in My Disney Experience explain why Disney Genie+ sold out on some dates.
Lightning Lane
People would NOT wait that many hours for Avatar Flight of Passage, right? Weeeeeell…
The attraction averaged a wait time of 202 minutes, which is three hours and 22 minutes. That’s an increase of 75 MINUTES from last time.
During 2024, we’ll track several full weeks when Avatar Flight of Passage’s total wait time will be 75-90 minutes.
Credit: Disney
That was the INCREASE during Christmas Week! So, you already know that all the wait times are gonna be ridiculous.
Here are the other average waits at Animal Kingdom last week:
- Na’vi River Journey – 117 minutes, up 31
- Kilimanjaro Safaris – 89 minutes, up 41
- Expedition Everest – 77 minutes, up 33
- DINOSAUR – 68 minutes, up 28
- Adventurers Outpost – 67 minutes, up 10
- Kali River Rapids – 26 minutes, up 13
- TriceraTop Spin – 24 minutes, up 6
- It’s Tough to Be a Bug! – 20 minutes, up 5
Realistically, Animal Kingdom wasn’t that bad if you stayed away from Pandora – The World of Avatar.
Na’vi River Journey extended stand-by queue
Overall, the attractions at the park averaged a wait of 78 minutes, which is the largest I’ve ever tracked. It’s also 26 minutes or 50 percent more than last time.
Please understand that the two Pandora rides reflect most of that wait time, though.
The other attractions averaged a wait of 53 minutes, which is still comically long for them, but it’s substantially less without the Pandora rides.
Disney’s Hollywood Studios
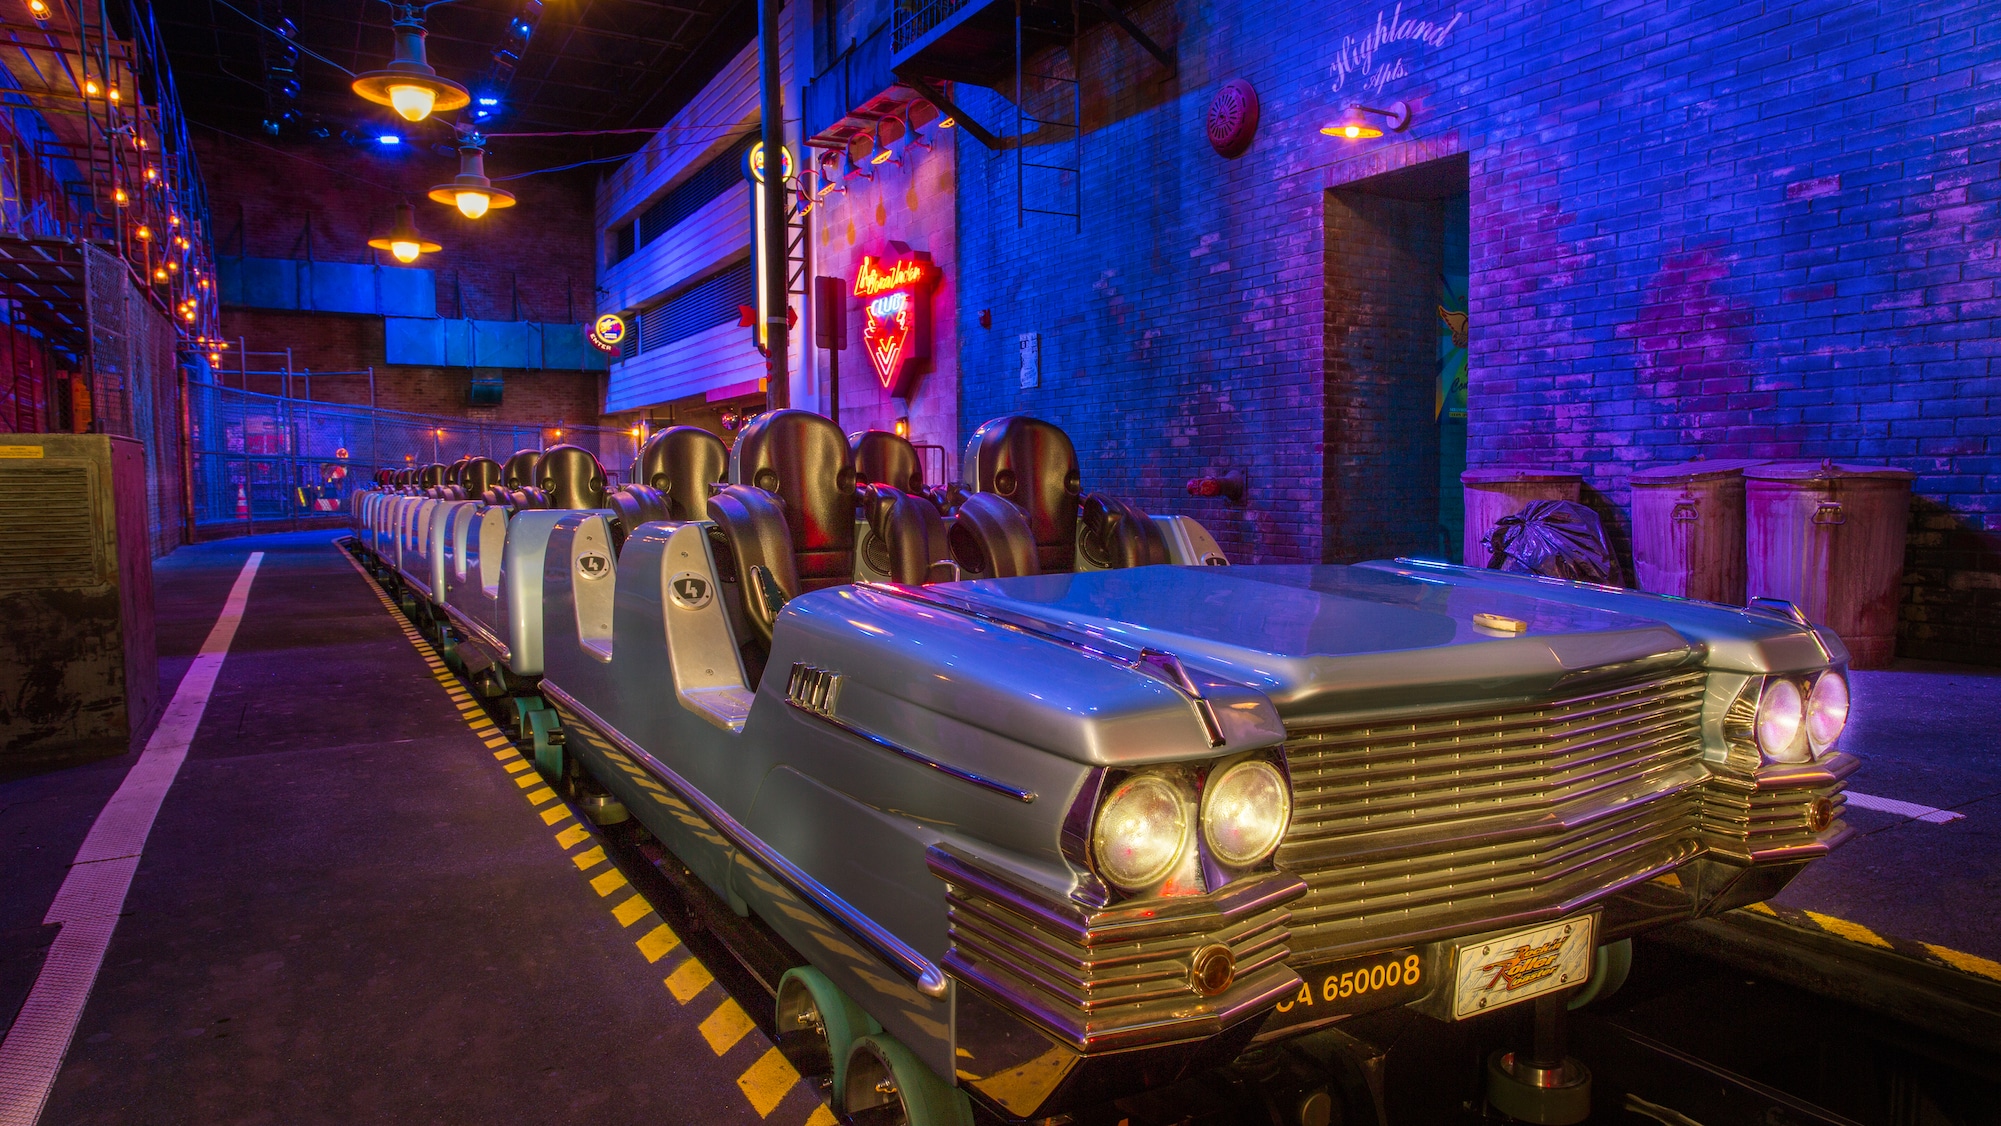
Image Credit: Disney
Warning: this ride is about to get rough! Here are the average wait times for Hollywood Studios last week:
- Slinky Dog Dash – 144 minutes, up 22
- Star Wars: Rise of the Resistance – 139 minutes, up 28
- Rock ‘n’ Roller Coaster Starring Aerosmith – 119 minutes, up 26
- Millennium Falcon: Smugglers Run – 112 minutes, up 18
- Twilight Zone Tower of Terror – 109 minutes, up 24
- Toy Story Mania! – 100 minutes, up 17
- Mickey & Minnie’s Runaway Railway – 90 minutes, up 17
- Alien Swirling Saucers – 60 minutes, up 4
- Red Carpet Dreams – 53 minutes, up 8
- Star Tours – The Adventures Continue! – 46 minutes, up 17
- Celebrity Spotlight – 32 minutes, up 7
- Lightning McQueen’s Racing Academy – 15 minutes, no change
- Muppet*Vision 3D – 15 minutes, up 5
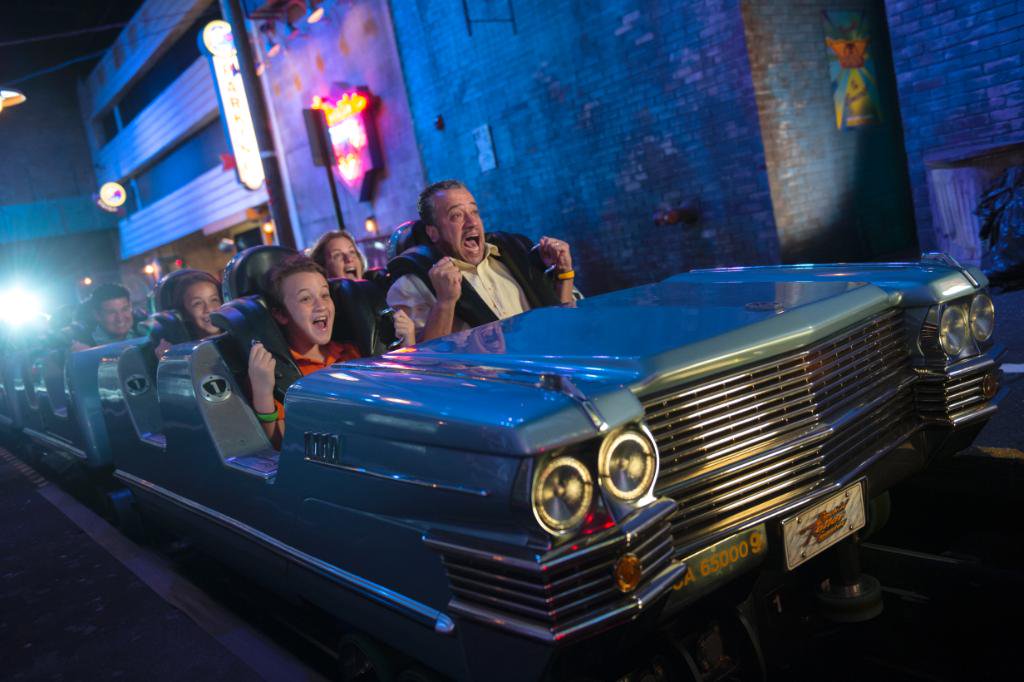
Image: Disney
Overall, guests at Hollywood Studios stood in line for an average of 79 minutes per attraction, which is 21 minutes or 36 percent more than last time.
Frequent readers of this article know that I identify crowded park dates at Hollywood Studios by how many require a wait of 60+ minutes.
When seven attractions take an hour or more, that’s a busy day.
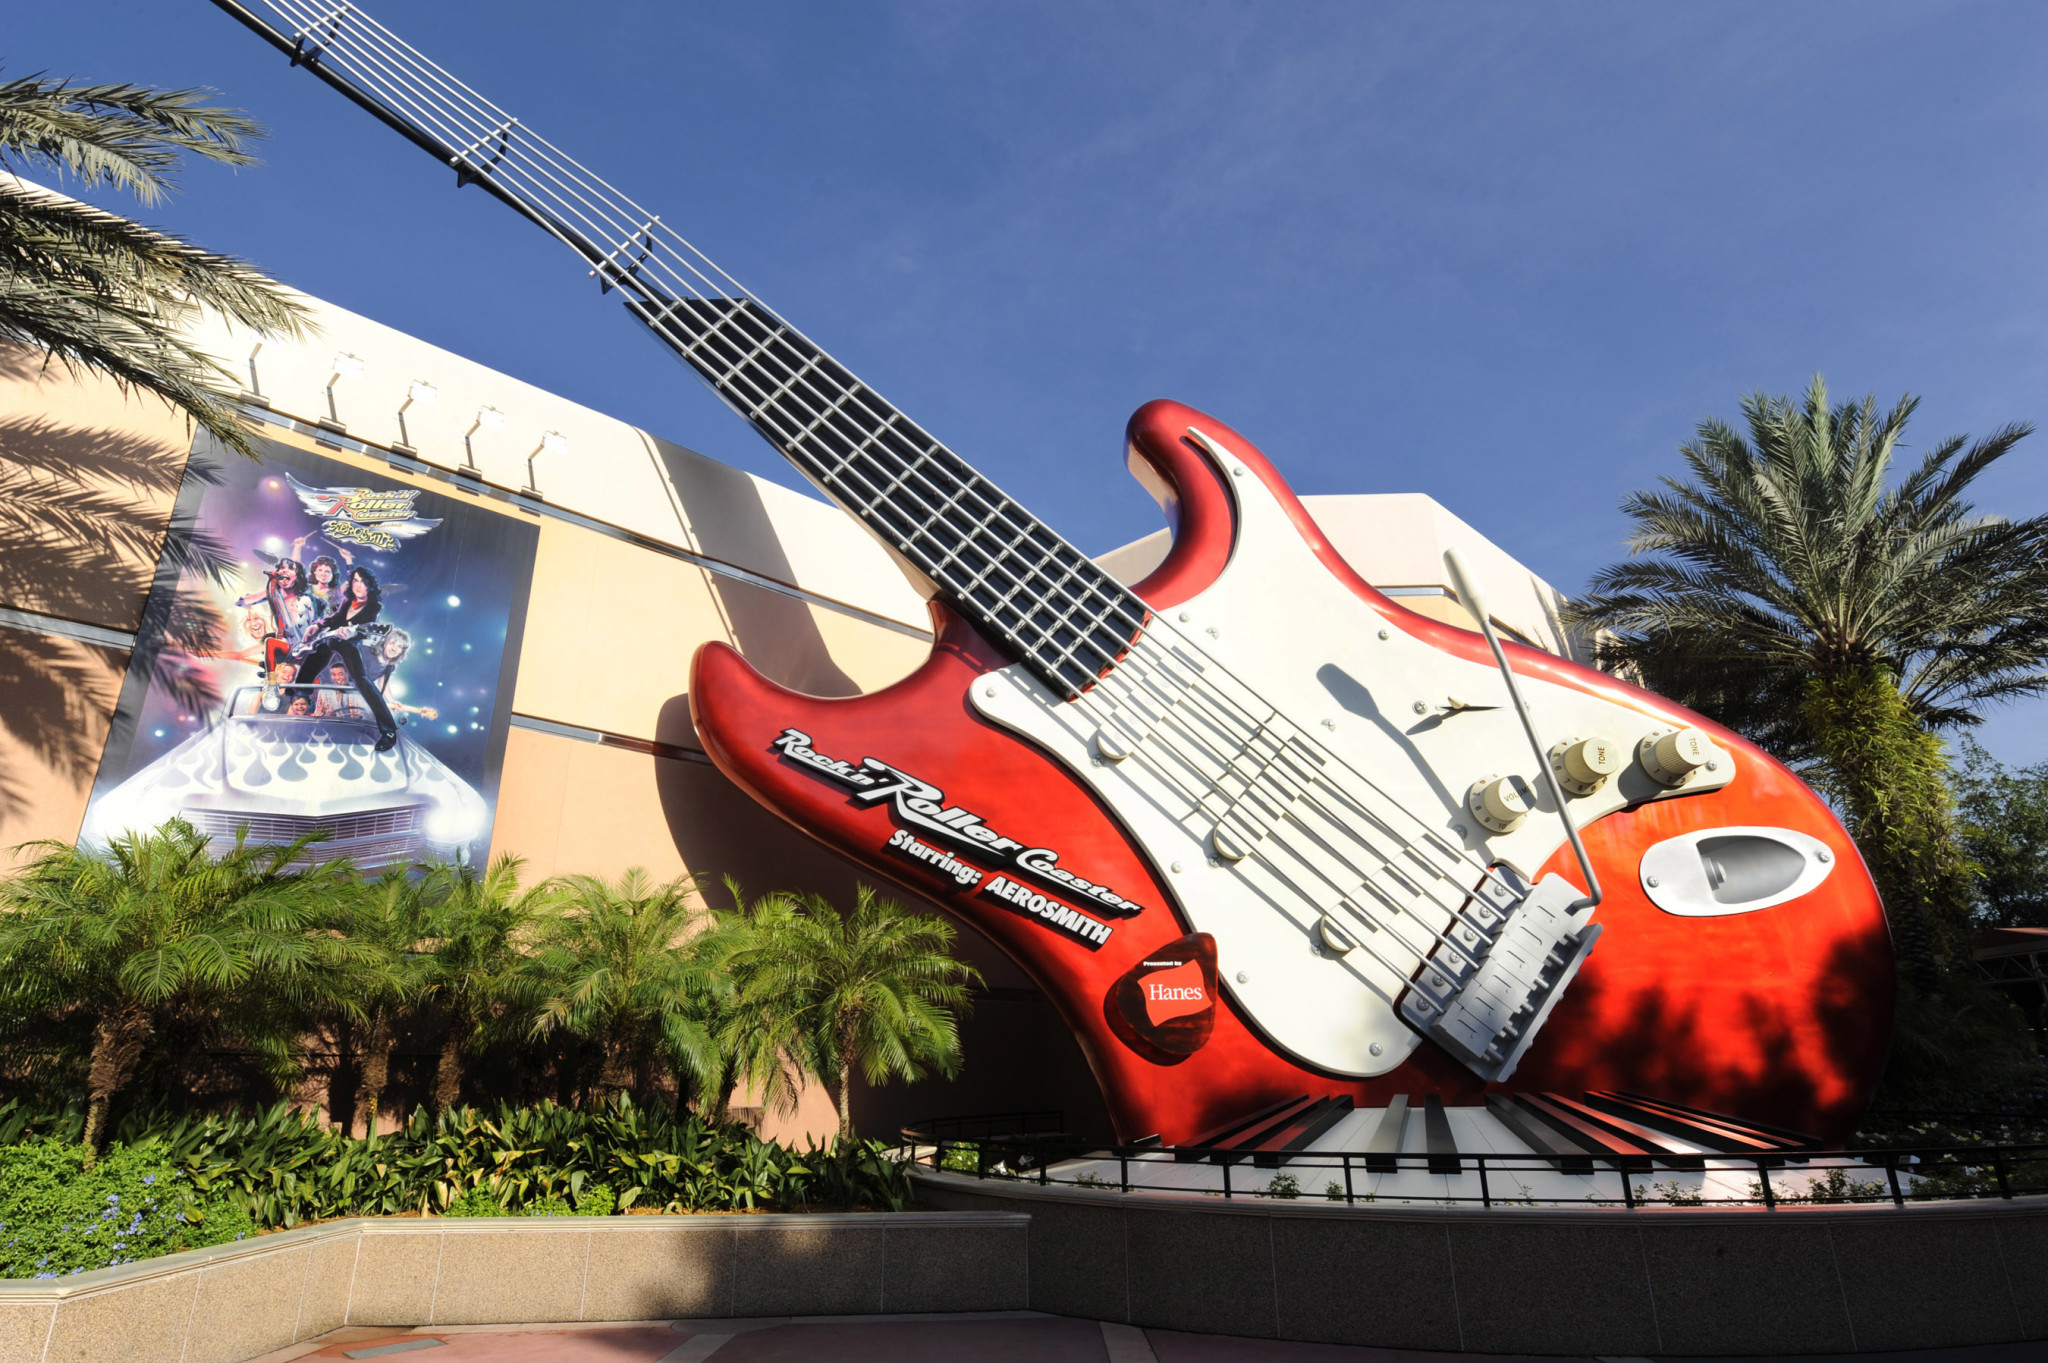
Photo: Disney
During Christmas Week, seven attractions averaged waits of 90+ minutes!!!
That’s a 50 percent spike to what I already consider a wildly crowded park date.
That statement alone identifies how crowded the parks were during Christmas Week.
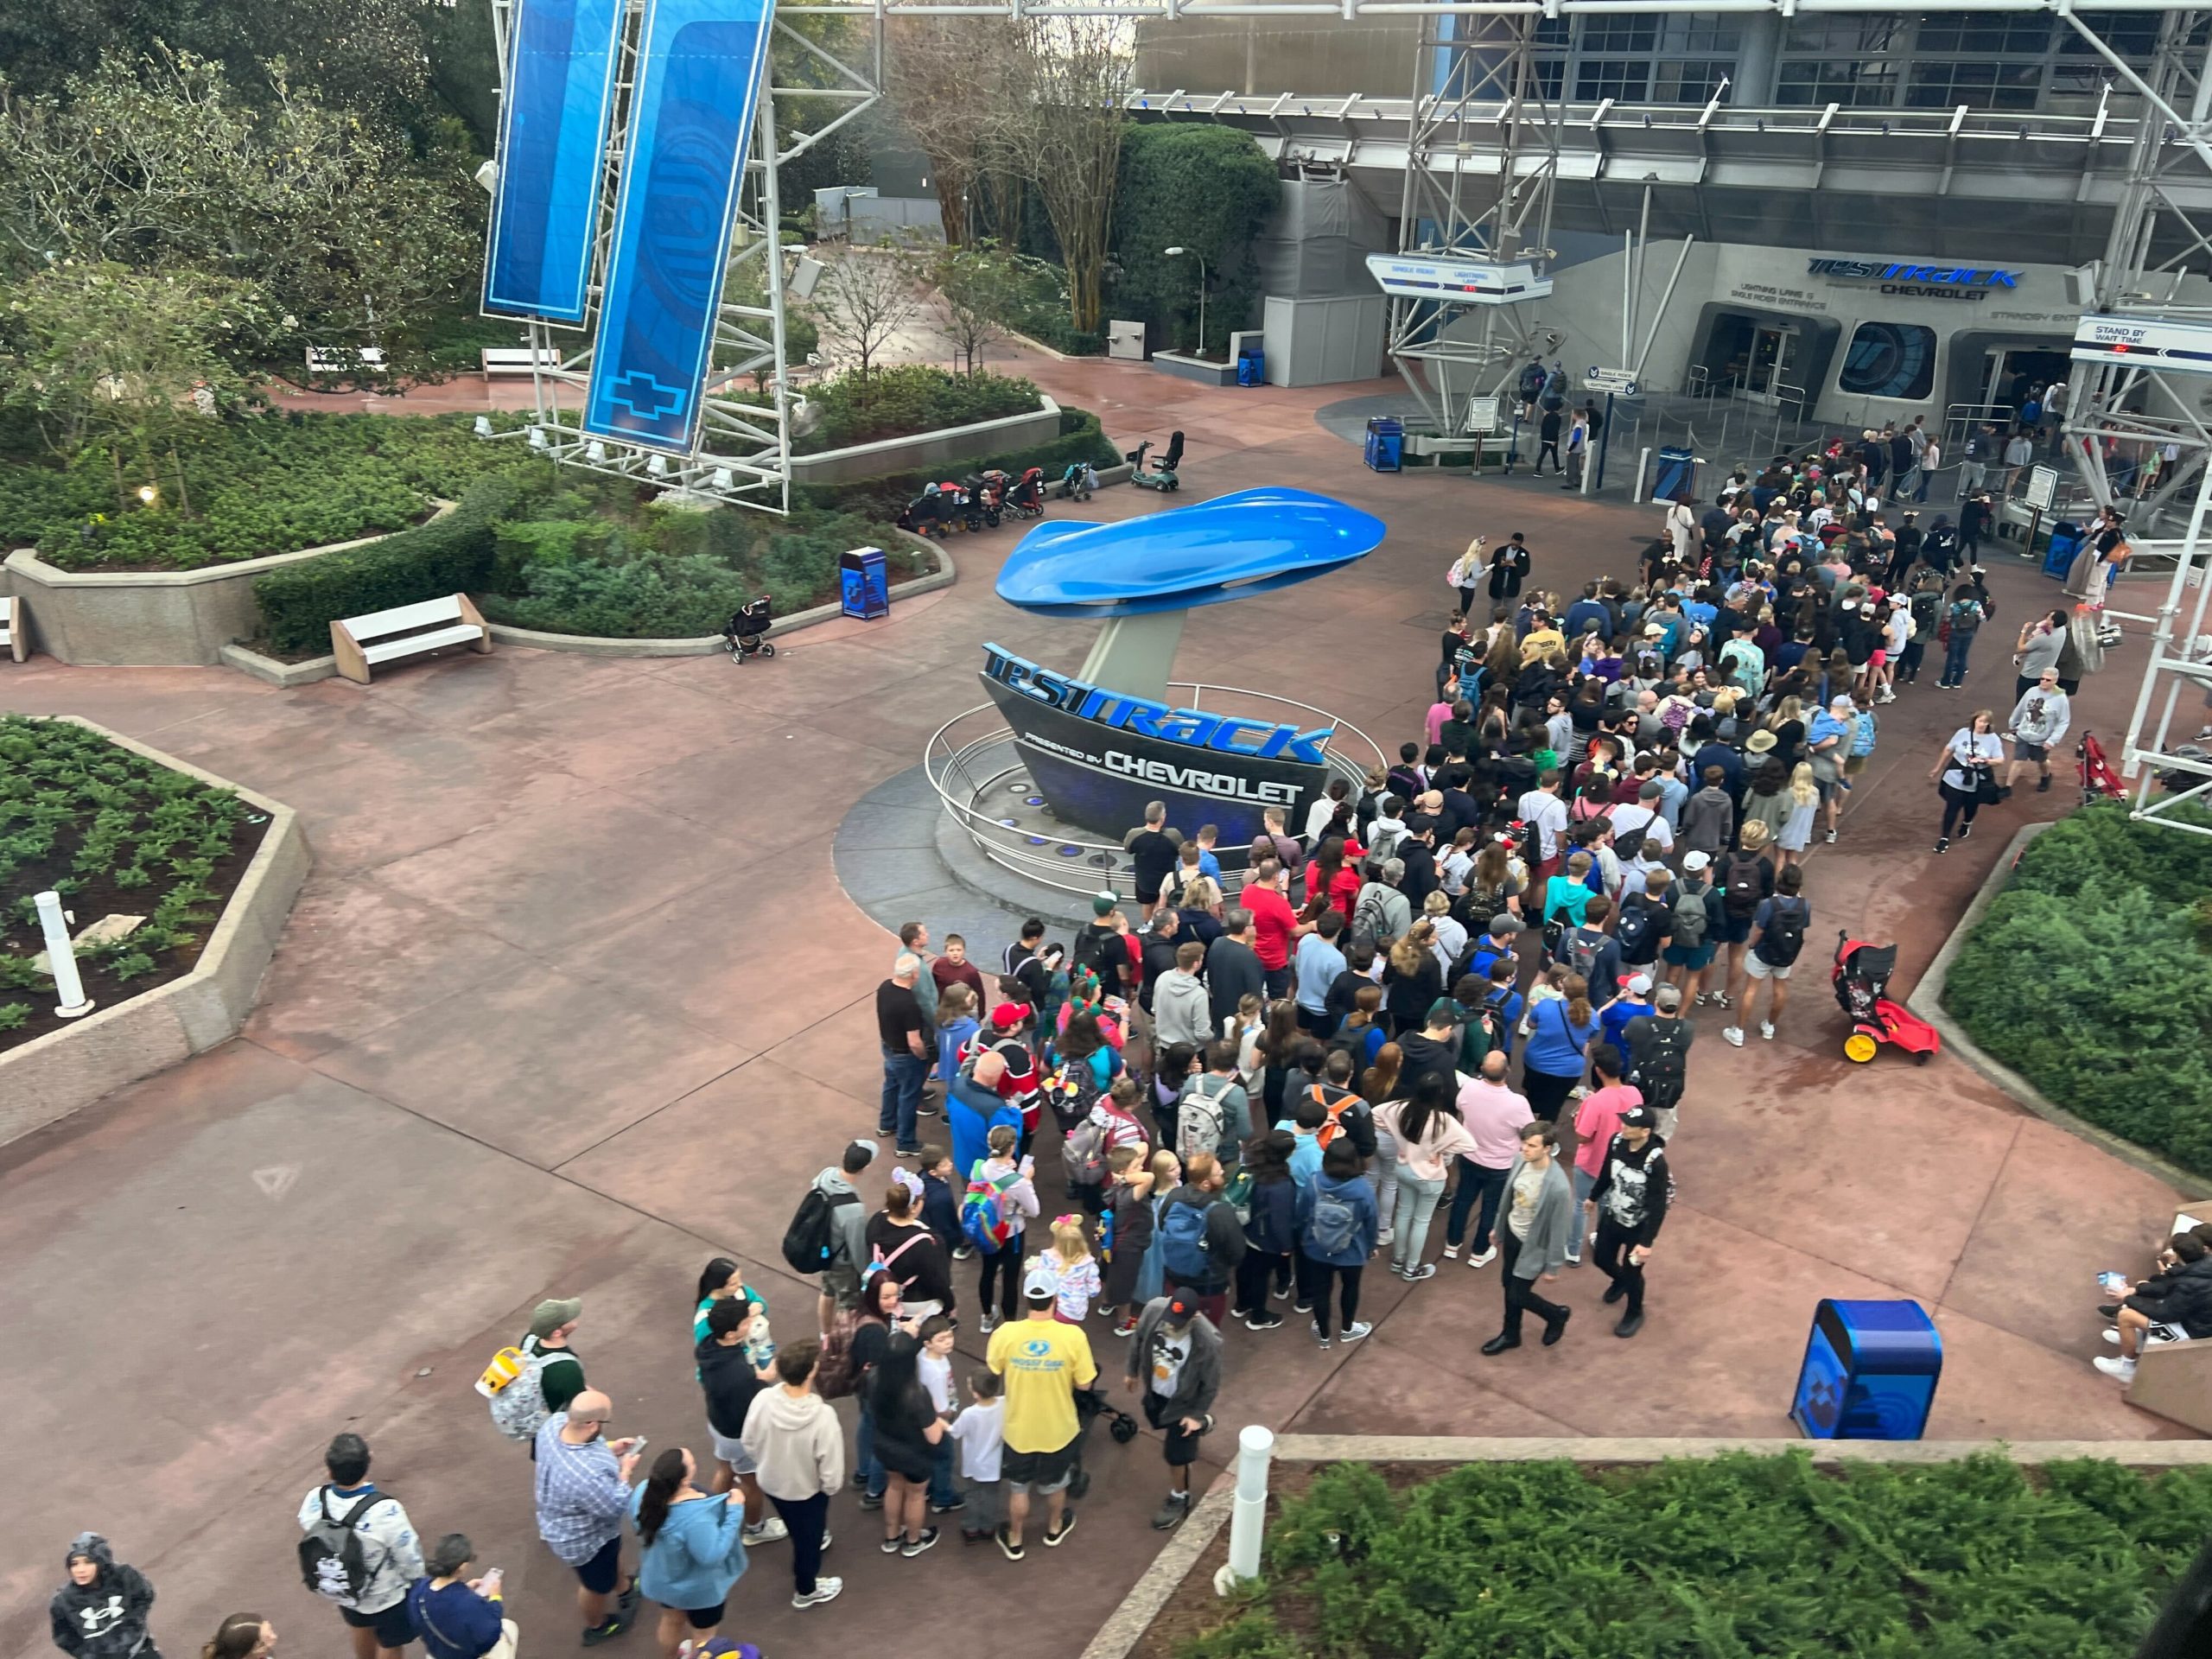
EPCOT
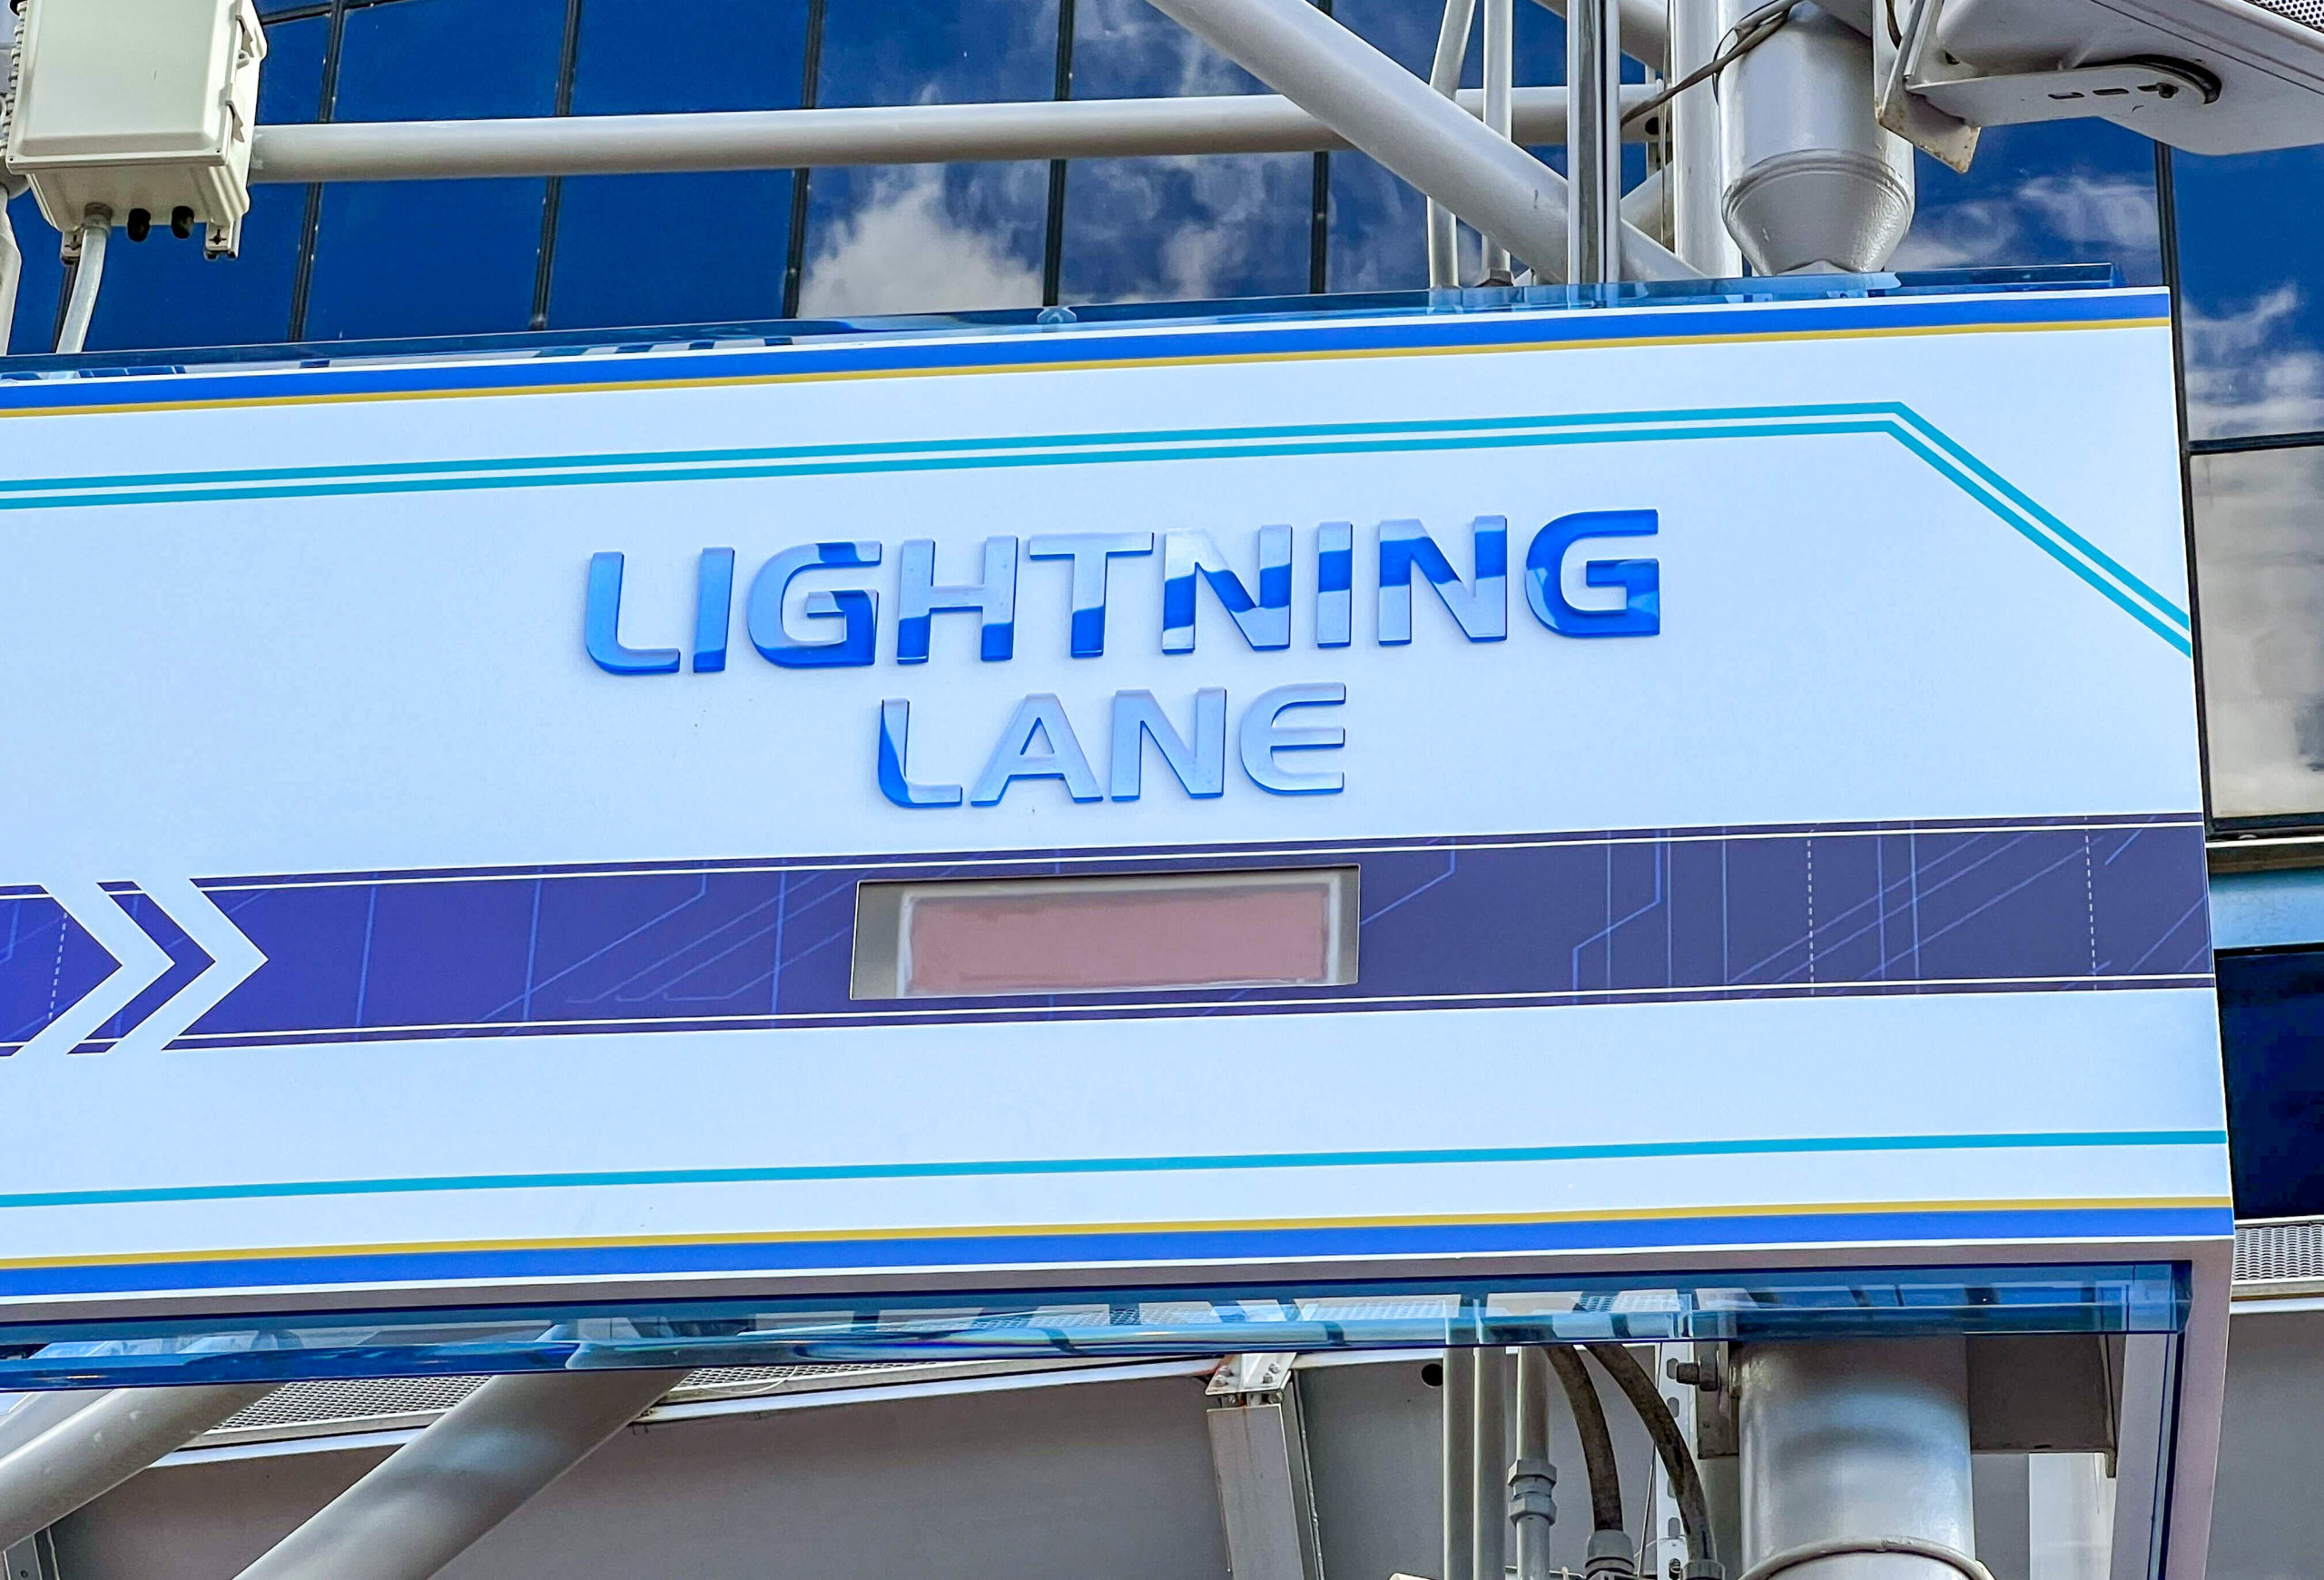
Lightning Lane
You get the point by now, but let’s add another data point. Here are EPCOT’s average wait times last week:
- Remy’s Ratatouille Adventure – 136 minutes, up 47
- Test Track – 118 minutes, up 38
- Frozen Ever After – 114 minutes, up 31
- Soarin’ Over California – 95 minutes, up 36
- Mission: SPACE – 74 minutes, up 32
- Spaceship Earth – 53 minutes, up 19
- Royal Sommerhus – 48 minutes, up 10
- The Seas with Nemo & Friends – 40 minutes, up 21
- Journey into Imagination with Figment – 32 minutes, up 17
- Living with the Land – 29 minutes, up 9
- Turtle Talk with Crush – 29 minutes, up 9
- Gran Fiesta Tour Starring the Three Caballeros – 26 minutes, up 12
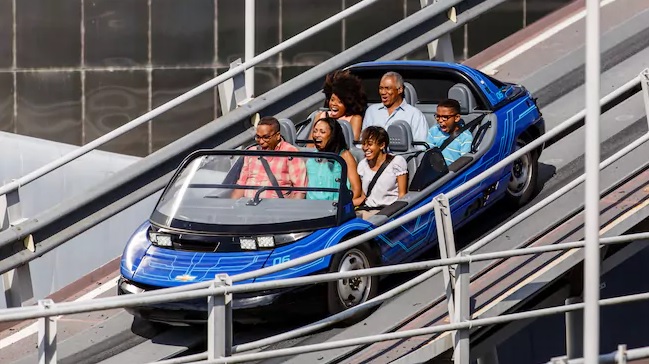
Image Credit: Disney
Overall, guests stood in line for an average of 66 minutes per attraction, which is 24 minutes or 57 percent more than last time.
The three parks have increased their wait times by an average of 47 percent. As a reminder, that previous week included Christmas Eve.
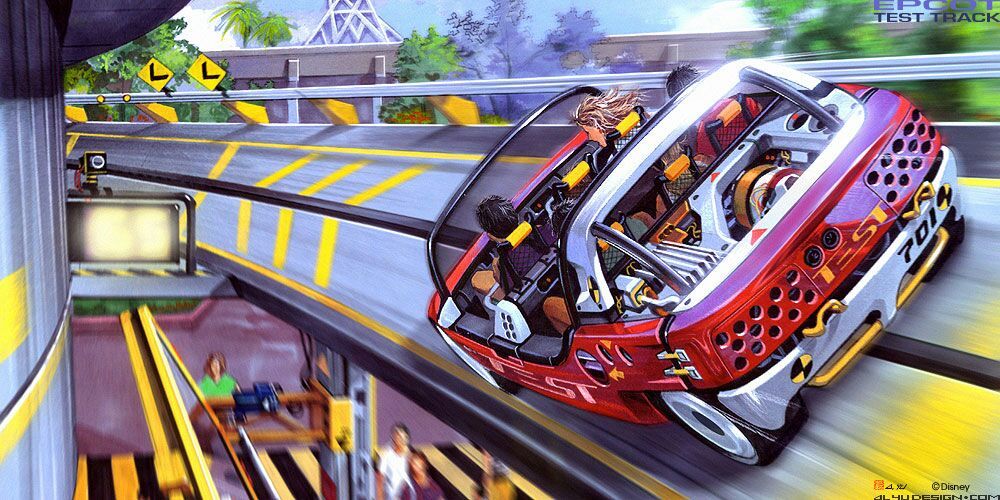
Photo: Disney
So, we started with one of the largest crowd weeks ever at Disney…and increased by 47 percent from there.
This past week legitimately might have been the busiest ever at Walt Disney World. I’m not being hyperbolic, either.
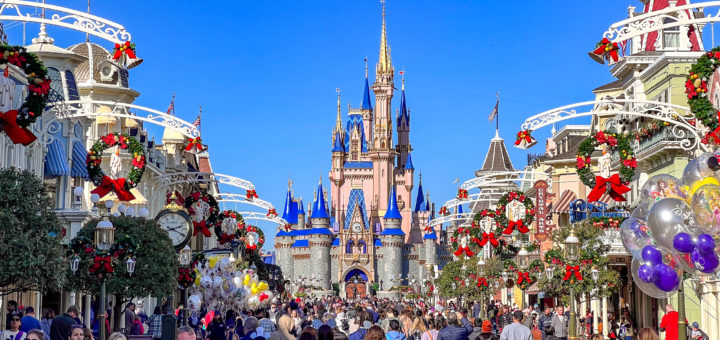
Magic Kingdom

Stating the obvious, these numbers are about to be ridiculous.
Here are Magic Kingdom’s average wait times for the past week:
- Seven Dwarfs Mine Train – 144 minutes, up 42
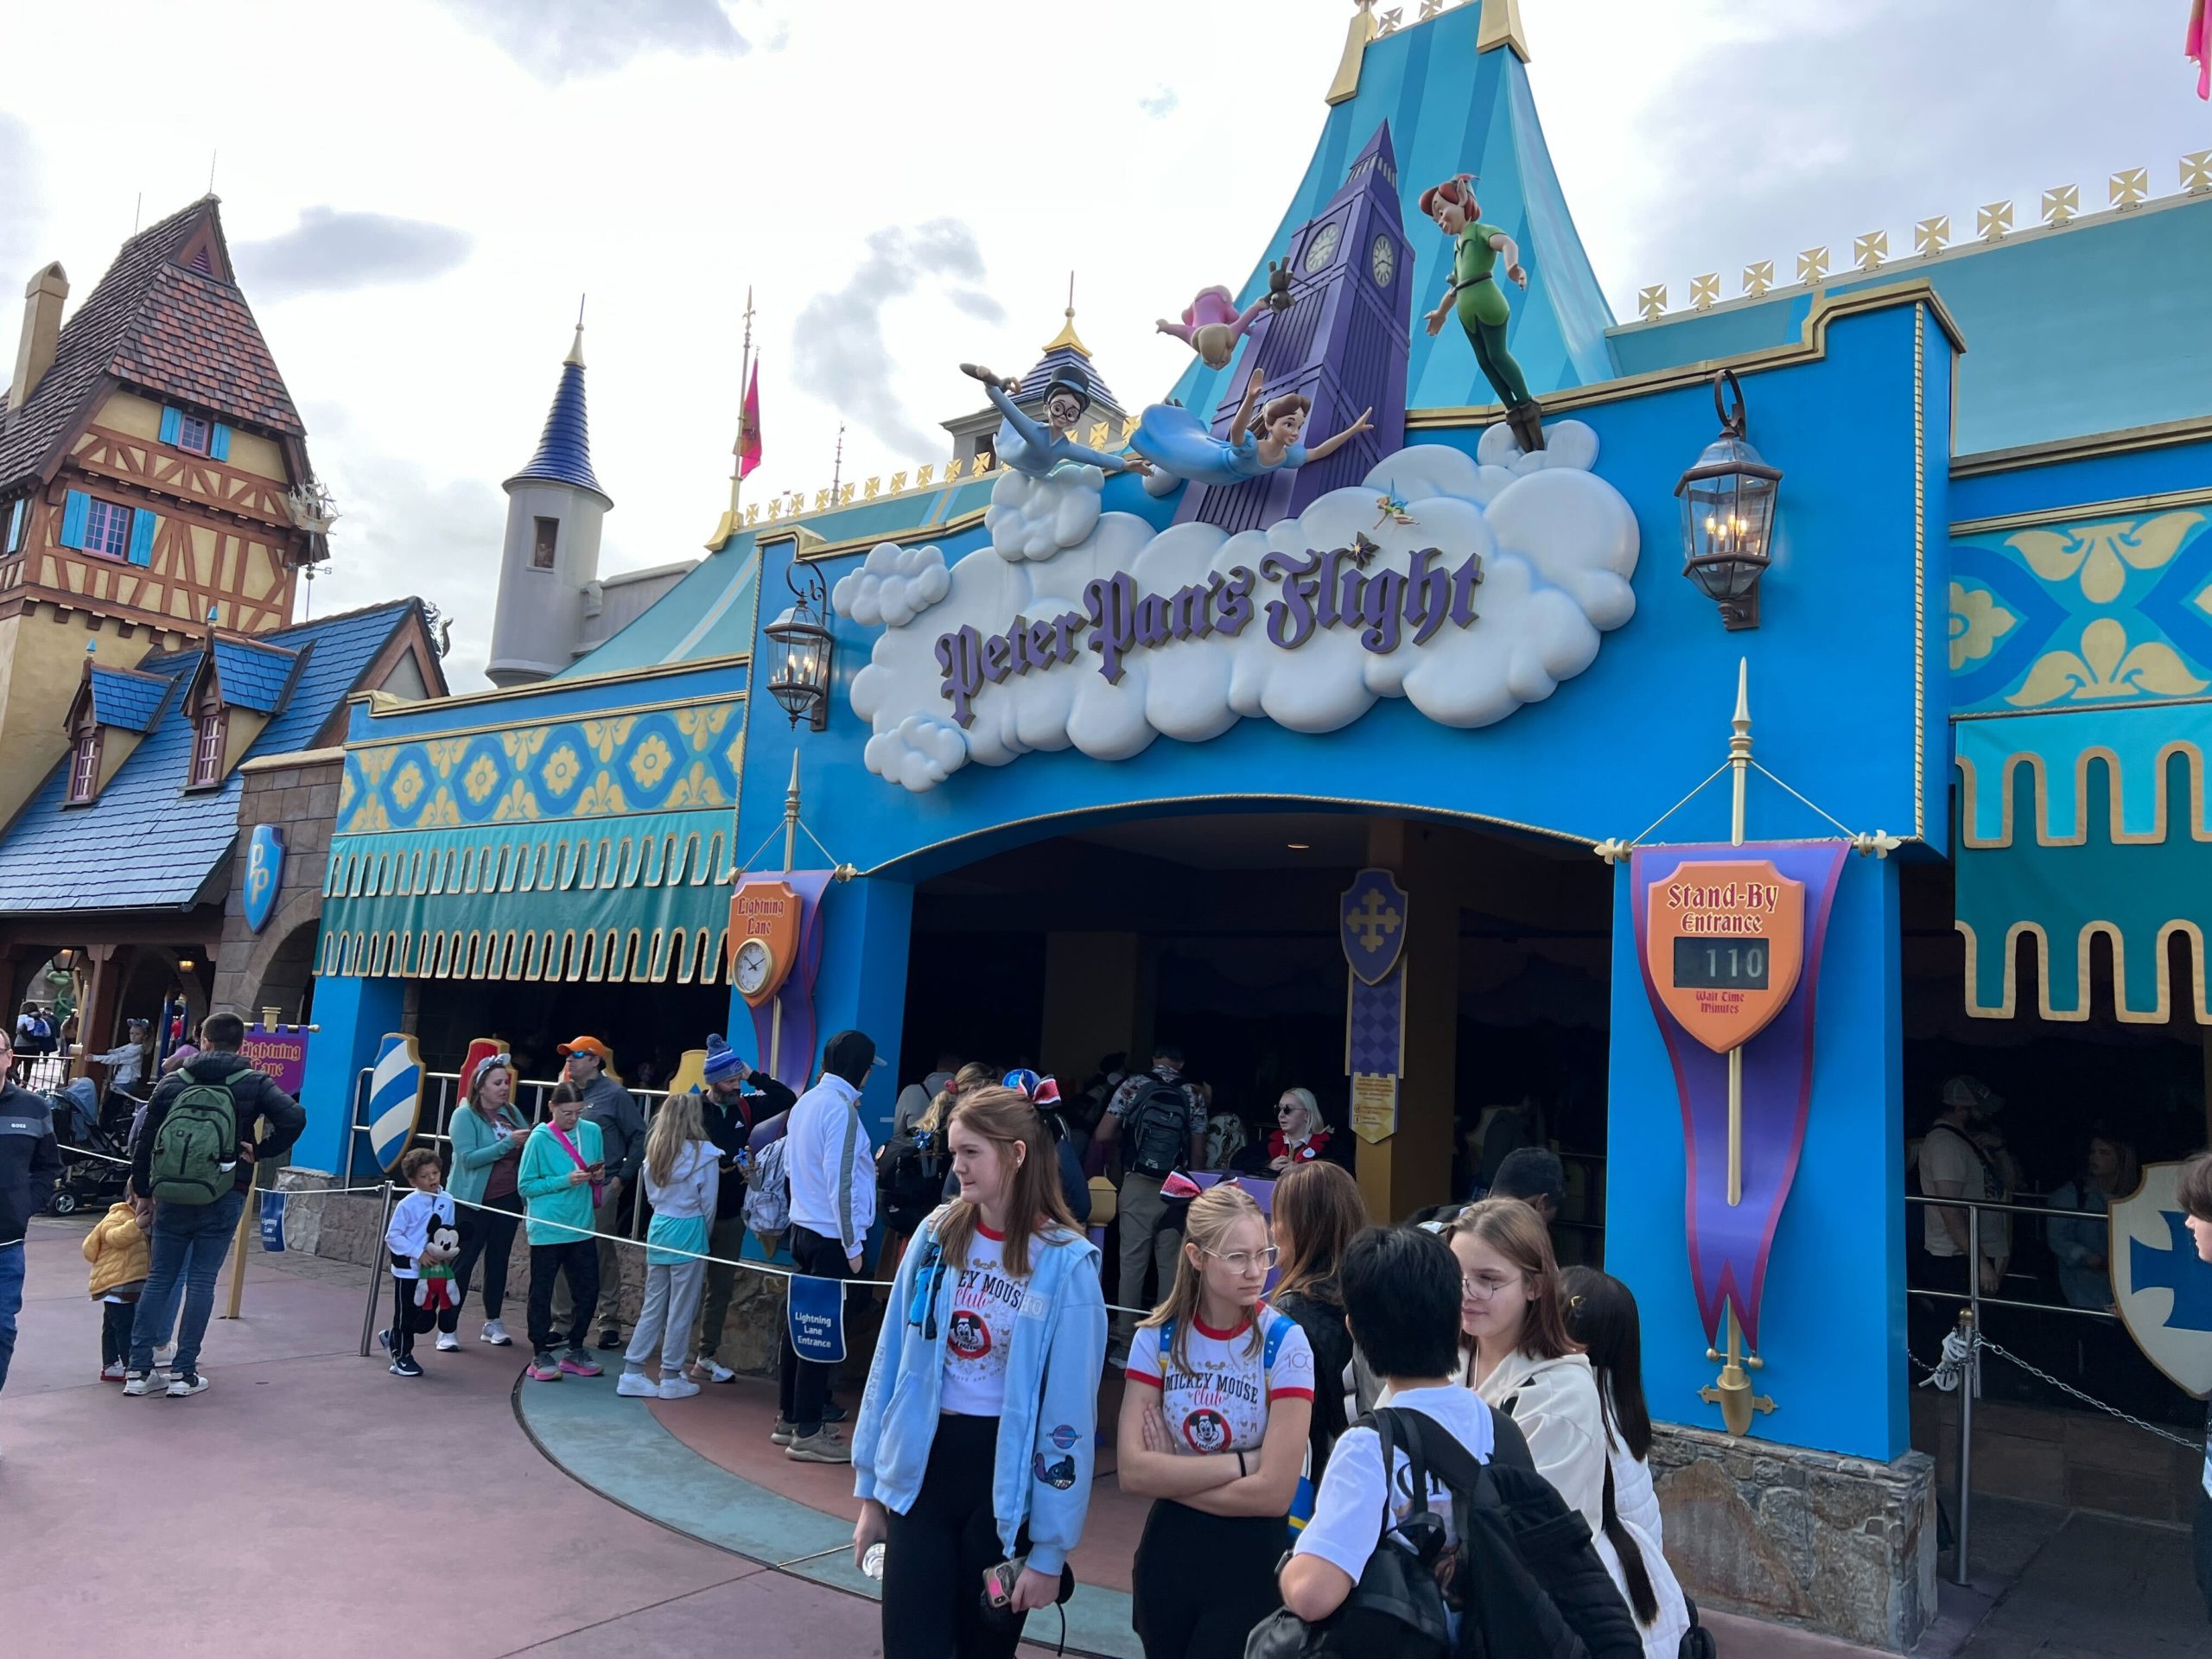
- Peter Pan’s Flight – 102 minutes, up 20
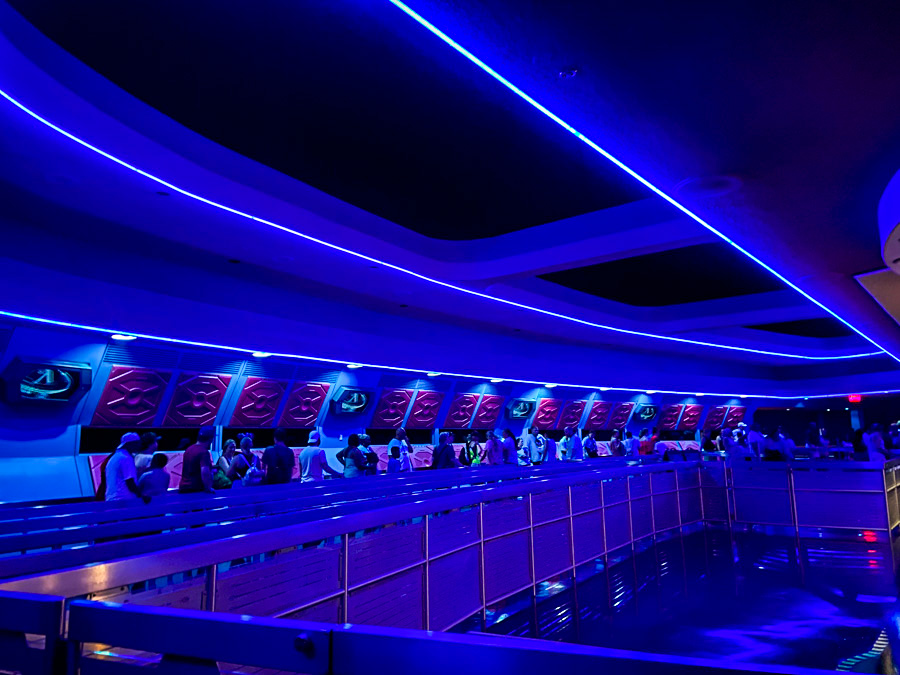
- Space Mountain – 97 minutes, up 17
- Jingle Cruise – 82 minutes, up 6
- Big Thunder Mountain Railroad – 77 minutes, up 14
- Haunted Mansion – 73 minutes, up 13
- Buzz Lightyear’s Space Ranger Spin – 62 minutes, up 7
- Pirates of the Caribbean – 58 minutes, up 10
- Princess Fairytale Hall – 57 minutes, up 9
- Town Square Theater – 54 minutes, up 4
- Ariel’s Grotto – 52 minutes, up 9
- Astro Orbiter – 50 minutes, up 5
- The Many Adventures of Winnie the Pooh – 50 minutes, up 4
- It’s a Small World – 48 minutes, up 9
- Enchanted Tales with Belle – 45 minutes, up 10
- Under the Sea ~ Journey of the Little Mermaid – 45 minutes, up 11
- The Barnstormer – 44 minutes, up 7
- Dumbo the Flying Elephant – 43 minutes, up 5
- Pete’s Silly Sideshow – 42 minutes, up 1
- Tomorrowland Speedway – 39 minutes, up 5
- The Magic Carpets of Aladdin – 37 minutes, up 5
- Mad Tea Party – 29 minutes, up 2
- Tomorrowland Transit Authority PeopleMover – 27 minutes, up 7
- Walt Disney World Railroad – 24 minutes, no change
- Monsters, Inc. Laugh Floor – 22 minutes, up 5
- Prince Charming Regal Carrousel – 20 minutes, up 2
- Mickey’s PhilharMagic – 19 minutes, down 2
- Country Bear Jamboree – 16 minutes, no change
- Walt Disney’s Carousel of Progress – 5 minutes, no change
Final Thoughts

Photo: Disney
The average wait time for Magic Kingdom attractions last week was 49 minutes, which is 10 minutes or 26 percent more than last time.
While this number is quite high, it underscores the genius of Magic Kingdom.
You’ll notice the larger increases and average waits at the other three parks.
Because Magic Kingdom hosts so many excellent attractions, crowds spread out rather than swarming in one place like, say, Pandora.
The result is steadier traffic flow and a lower ceiling on average wait times.
Hollywood Studios and Animal Kingdom work pretty much the opposite due to how top-heavy they are.
But the larger point here is the obvious one. Walt Disney World crowds were the biggest I’ve ever tracked during Christmas Week 2023.
MickeyBlog Logo
Thanks for visiting MickeyBlog.com! Want to go to Disney? For a FREE quote on your next Disney vacation, please fill out the form below, and one of the agents from MickeyTravels, a Diamond Level Authorized Disney Vacation Planner, will be in touch soon!