Walt Disney World Wait Times for Second Week of December 2023
Welcome to Christmas Week!
By this time next Monday, you will have opened all your gifts and celebrated a joyous holiday with your ‘ohana. I wish great tidings unto you and yours.
But that’s next week… When we talk about Walt Disney World wait times, we discuss the previous week.
Therein lies one of the true curiosities of theme park behavior.
Let’s talk about the quirks of the holiday season in the latest batch of Walt Disney World wait times.
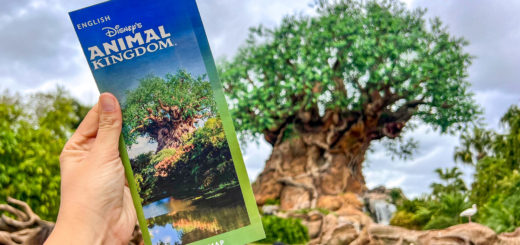
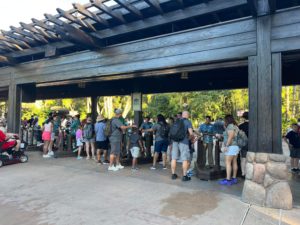
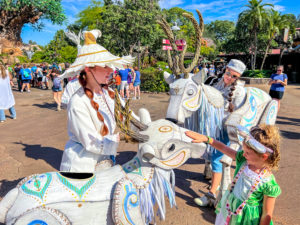
Disney’s Animal Kingdom

Historically, December park behavior divides evenly.
During the first half of the month, crowds dissipate as people choose to spend the holidays at Walt Disney World.
So, we get the Thanksgiving rush followed by a lull until Christmas Week.
Depending on how you evaluate the calendar, that could be this week or the next one.
With Christmas Eve falling on Sunday, some fans will arrive soon for their annual holiday visits.
EPCOT lines
Others will wait until the end of this week since Christmas doesn’t come until Monday.
Still, the overall effect remains the same. Until December 17th, park traffic isn’t as significant as it will be from December 18th until January 3rd.
That’s the general timeframe when guests finish their New Year’s celebrations and return to their normal lives.
What we’d expect to see here is a similar performance to last week compared to the previous one. Then, crowds will swell as soon as today.

Photo: Disney
Is that what happened at Animal Kingdom? Here are the park’s average attraction wait times for the past week:
- Avatar Flight of Passage – 74 minutes, down 12
- Na’vi River Journey – 60 minutes, down 5
- Adventurers Outpost – 42 minutes, down 10
- Kilimanjaro Safaris – 34 minutes, down 11
- Expedition Everest – 23 minutes, down 5
- DINOSAUR – 14 minutes, down 9
- It’s Tough to Be a Bug! – 10 minutes, no change
- TriceraTop Spin – 10 minutes, down 2
- Kali River Rapids – 8 minutes, down 1
Okay, first of all, Disney closed its water park multiple times last week. Who were the brave people riding Kali River Rapids?!
Disney’s Hollywood Studios
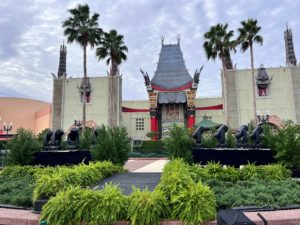
Light Fixtures outside Chinese Theater in Hollywood Studios
Anyway, the crowds at Animal Kingdom dipped slightly overall, and the weather may have played a factor in that.
I rarely think that’s the case, but we’ll contrast Animal Kingdom’s behavior with the other parks to verify.
Overall, park guests stood in line for an average of 32 minutes per attraction, which is a significant decline of six minutes.
So, we’re all left wondering how Hollywood Studios worked last week. Here are the wait times at Disney’s most mercurial theme park:
- Star Wars: Rise of the Resistance – 80 minutes, down 23
- Slinky Dog Dash – 73 minutes, down 19
- Twilight Zone Tower of Terror – 65 minutes, up 9
- Rock ‘n’ Roller Coaster Starring Aerosmith – 58 minutes, down 4
- Toy Story Mania! – 57 minutes, down 10
- Mickey & Minnie’s Runaway Railway – 55 minutes, down 9
- Millennium Falcon: Smugglers Run – 54 minutes, down 2
- Red Carpet Dreams – 38 minutes, down 5
- Alien Swirling Saucers – 31 minutes, down 8
- Celebrity Spotlight – 18 minutes, down 6
- Lightning McQueen’s Racing Academy – 15 minutes, no change
- Star Tours – The Adventures Continue – 12 minutes, down 2
- Muppet*Vision 3D – 10 minutes, no change
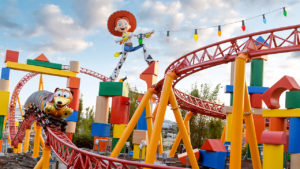
Image Credit: Disney
At Hollywood Studios, guests waited for an average of 40 minutes per attraction, which is five minutes less than last time.
I often categorize the park’s crowds by how many attractions required hour-long waits.
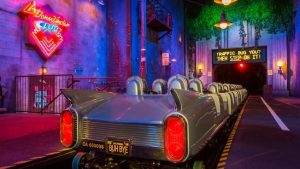
Photo: Disney
Technically, this past week only included three, which is low for Hollywood Studios. However, four others were at 54 minutes or more.
These are the numbers I’d expect at this time of year at this park.
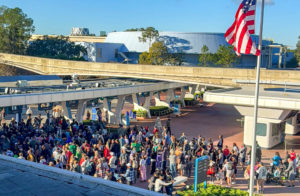
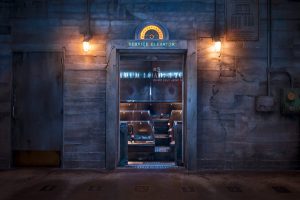
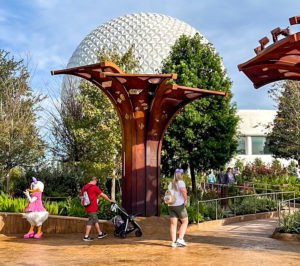
EPCOT

Photo: Walt Disney World
I’m curious about EPCOT, though. A lot is happening at this park.
During the week in question, we had the first full week of Luminous The Symphony of Us and the new hangout spot at World Celebration Gardens.
For these reasons, EPCOT’s crowd behavior should evolve from what’s been standard for most of 2023.
We’re only getting our first look at the new EPCOT, but I’m curious how gradual the changes will be.

Here are the park’s average waits for last week:
- Frozen Ever After – 72 minutes, down 10
- Remy’s Ratatouille Adventure – 69 minutes, down 9
- Test Track – 59 minutes, down 2
- Soarin’ Over California – 38 minutes, down 10
- Royal Sommerhus – 33 minutes, down 7
- Mission: SPACE – 19 minutes, down 1
- Living with the Land – 18 minutes, down 7
- Turtle Talk with Crush – 18 minutes, down 1
- Spaceship Earth – 16 minutes, down 5
- The Seas with Nemo & Friends – 13 minutes, down 7
- Gran Fiesta Tour Starring the Three Caballeros – 11 minutes, down 1
- Journey into Imagination with Figment – 10 minutes, down 4
Overall, EPCOT visitors stood in lines for an average of 31 minutes per attraction, which is five minutes less than last time.
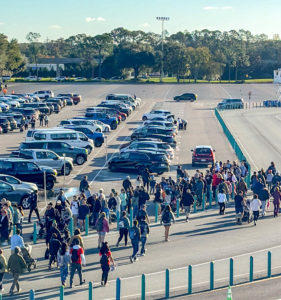
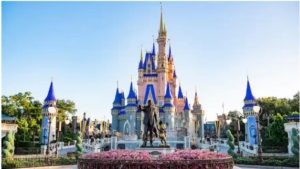
Magic Kingdom

Finally, we have the theme park that guests will overwhelm over the next two weeks.
Here are Magic Kingdom’s wait times for its final slow-ish week of 2023:
- Seven Dwarfs Mine Train – 76 minutes, down 1
- Peter Pan’s Flight – 69 minutes, up 1
- Jingle Cruise – 63 minutes, down 10
- Haunted Mansion – 49 minutes, down 4
- Space Mountain – 45 minutes, down 3
- Buzz Lightyear’s Space Ranger Spin – 43 minutes, down 4
- Big Thunder Mountain Railroad – 39 minutes, down 10
- The Many Adventures of Winnie the Pooh – 38 minutes, down 2
- Princess Fairytale Hall – 38 minutes, down 5
- Town Square Theater – 37 minutes, down 6
- Ariel’s Grotto – 35 minutes, down 7
- Pirates of the Caribbean – 33 minutes, down 6
- Pete’s Silly Sideshow – 30 minutes, down 6
- Astro Orbiter – 28 minutes, down 4
- Enchanted Tales with Belle – 27 minutes, down 5
- It’s a Small World – 26 minutes, down 4
- Under the Sea ~ Journey of the Little Mermaid – 23 minutes, down 7
- Walt Disney World Railroad – 23 minutes, up 2
- Magic Carpets of Aladdin – 19 minutes, down 5
- Tomorrowland Transit Authority PeopleMover – 18 minutes, no change
- The Barnstormer – 17 minutes, down 7
- Dumbo the Flying Elephant – 16 minutes, down 11
- Country Bear Jamboree – 15 minutes, down 2
- Mickey’s PhilharMagic – 14 minutes, down 6
- Tomorrowland Speedway – 14 minutes, down 4
- Mad Tea Party – 13 minutes, down 6
- Monsters, Inc. Laugh Floor – 12 minutes, down 3
- Prince Charming Regal Carrousel – 11 minutes, down 4
- Walt Disney’s Carousel of Progress – 5 minutes, no change
Final Thoughts
Credit: Disney
Guests at Magic Kingdom happily waited in line for an average of 29 minutes per attraction, which is three minutes per attraction.
My general rule of thumb here is that anything at 30 minutes or less is great for Magic Kingdom.

Photo: Disney
We…won’t see these numbers again until early 2024. The parks are about to get wild.
If you’re one of the lucky people attending, have a wonderful time, my many loves!
MickeyBlog Logo
Thanks for visiting MickeyBlog.com! Want to go to Disney? For a FREE quote on your next Disney vacation, please fill out the form below, and one of the agents from MickeyTravels, a Diamond Level Authorized Disney Vacation Planner, will be in touch soon!
Feature Photo: Disney