Disneyland Wait Times for August 2023
How did The Happiest Place on Earth manage during one of the hottest months on record?
Well, let’s just say that the crowds remained sizable throughout the month, but Disneyland Resort sent everyone home with a smile.

Photo: Disney Parks
Here are Disneyland’s wait times for the past month!
Disneyland Park
In last month’s article, I referenced the impending July 4th crowds, which somehow never materialized.
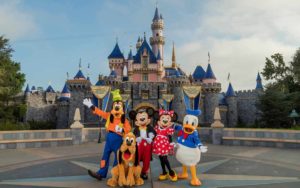

Photo: Travel and Leisure
This was an industry-wide, systemic issue stemming from the oddity of the national holiday occurring on a Tuesday.
Many guests had to go to work on Wednesday, July 5th, which caused a shocking downturn in holiday theme park attendance across the country.
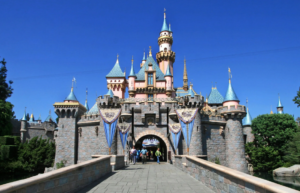

Photo: CNtraveler.com
Despite that fact, all signs at Disneyland Resort suggested strong, consistent attendance levels throughout the month.
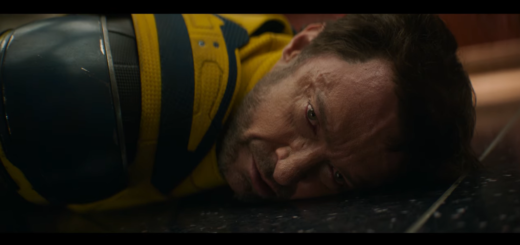
Also, we still have the continuing phenomenon of Rogers: The Musical skewing results at Disney California Adventure.
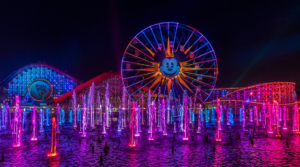

Photo: DIsneyland
Disney has employed a virtual queue for this attraction and even offered a paid option to ensure that guests can catch the show.
Both strategies underscore the overwhelming demand for the Captain America/Peggy Carter show.
So, for all these reasons, there’s little reason to expect Disneyland to report a slow July. But we never really know until we do a deep dive into the data…

Image: Disney
Average Waits at Disneyland Park
Remembering the above factors, here are the park’s average waits for the past month:
- Star Wars: Rise of the Resistance – 71 minutes, down 5
- Indiana Jones Adventure – 59 minutes, down 3
- Space Mountain – 57 minutes, down 13
- Roger Rabbit’s Car Toon Spin – 53 minutes, down 1
- Matterhorn Bobsleds – 51 minutes, down 5
- Millennium Falcon: Smugglers Run – 51 minutes, down 6
- Mickey & Minnie’s Runaway Railway – 41 minutes, down 9
- Big Thunder Mountain Railroad – 39 minutes, down 7
- Haunted Mansion – 35 minutes, down 4
- Peter Pan’s Flight – 34 minutes, down 6
- Chip ‘n’ Dale’s GADGETcoaster – 33 minutes, down 4
- Alice in Wonderland – 31 minutes, down 1
- Finding Nemo Submarine Voyage – 31 minutes, up 2
- Meet Mickey Mouse at Mickey’s House – 31 minutes, down 1
- Star Tours – The Adventures Continue! – 31 minutes, no change
- Astro Orbiter – 29 minutes, down 4
- Autopia – 29 minutes, down 6
- Dumbo the Flying Elephant – 29 minutes, down 3
- Jungle Cruise – 28 minutes, down 2
- Buzz Lightyear Astro Blasters – 27 minutes, down 6
- Pirates of the Caribbean – 26 minutes, down 6
- Toad’s Wild Ride – 20 minutes, down 1
- Snow White’s Enchanted Wish – 20 minutes, down 4
- Pinocchio’s Daring Journey – 17 minutes, down 1
- Davy Crockett’s Explorer Canoes – 15 minutes, down 5
- Disneyland Railroad – 15 minutes, no change
- It’s a Small World – 15 minutes, down 5
- Storybook Land Canal Boats – 15 minutes, down 4
- Disneyland Monorail – 13 minutes, up 3
- Mad Tea Party – 11 minutes, down 5
- The Many Adventures of Winnie the Pooh – 11 minutes, down 3
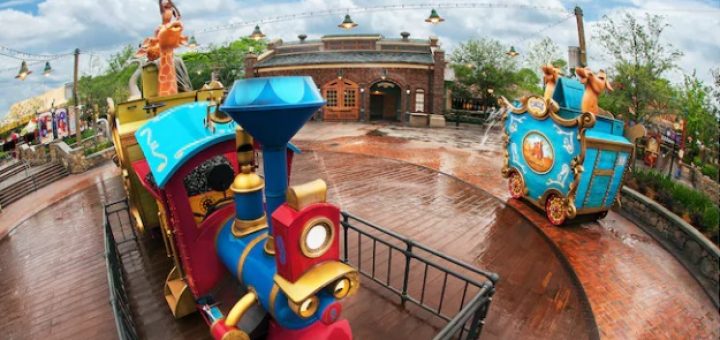
- Casey Jr. Circus Train – 10 minutes, down 9
- King Arthur Carrousel – 10 minutes, down 2
- Meet Tinkerbell – 10 minutes, up 1


(Christian Thompson/Disneyland Resort)
Let’s Talk about Disneyland Wait Times
So, yeah. I clearly have no idea what I’m talking about.
Somehow, virtually every attraction at Disneyland Park experienced a decline in average wait time last month.


Crowds
Overall, guests stood in line for 30 minutes per attraction, which is four minutes less than they did in June.
During the same interval last year, Disneyland Park guests waited for 37 minutes per attraction.
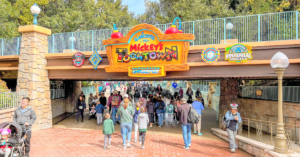

We ARE witnessing some park slowdown in the aftermath of the end of Revenge Travel.
Still, I won’t run away from the truth. That’s a more dramatic dip than I’d expected, especially because of anecdotal reports I’ve heard from friends at the park.
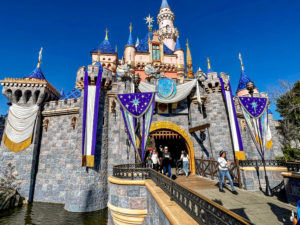

Disney California Adventure
Did the same trend hold at the smaller Disney California Adventure? Let’s find out! Here are the park’s average wait times for the past month:
- Radiator Springs Racers – 83 minutes, down 2
- Guardians of the Galaxy – Mission: BREAKOUT! – 58 minutes, down 6
- Grizzly River Run – 56 minutes, up 23
- Toy Story Midway Mania! – 55 minutes, down 1
- WEBSLINGERS: A Spider-Man Adventure – 51 minutes, down 1
- Soarin’ Around the World – 49 minutes, no change
- Monsters, Inc. Mike & Sulley to the Rescue! – 43 minutes, no change
- Goofy’s Sky School – 42 minutes, down 3
- The Incredicoaster – 37 minutes, down 3
- Pixar Pal-A-Round – 36 minutes, down 1
- Luigi’s Rollick’ Roadsters – 30 minutes, down 1
- Inside Out Emotional Whirlwind – 20 minutes, down 2
- Mater’s Junkyard Jamboree – 20 minutes, down 10
- The Little Mermaid ~ Ariel’s Undersea Adventure – 18 minutes, up 1
- Silly Symphony Swings – 16 minutes, down 2
- Golden Zephyr – 13 minutes, no change
- Jumpin’ Jellyfish – 13 minutes, down 2
- Mickey’s PhilharMagic – 12 minutes, no change
- Jessie’s Critter Carousel – 5 minutes, no change


Photo: Disney
Overall, guests at Disney California Adventure waited for an average of 31 minutes per attraction, which was four minutes less than the previous month.
Similarly, that’s eight minutes less than the same time in 2022. Again, we can definitely tell the difference now that Revenge Travel has ended.


(Joshua Sudock/Disneyland Resort)
To a certain extent, normalcy has returned at the parks. Also, management deserves some credit for managing crowds more efficiently this summer.

Photo: MickeyBlog
Thanks for visiting MickeyBlog.com! Want to go to Disney? For a FREE quote on your next Disney vacation, please fill out the form below, and one of the agents from MickeyTravels, a Diamond Level Authorized Disney Vacation Planner, will be in touch soon!
Feature Photo: Disney


