Disneyland Wait Times for July 2023
The school year has ended. The moment this happens each year, guests flock to the Happiest Place on Earth.
How has the sudden influx of vacationing families impacted attendance?
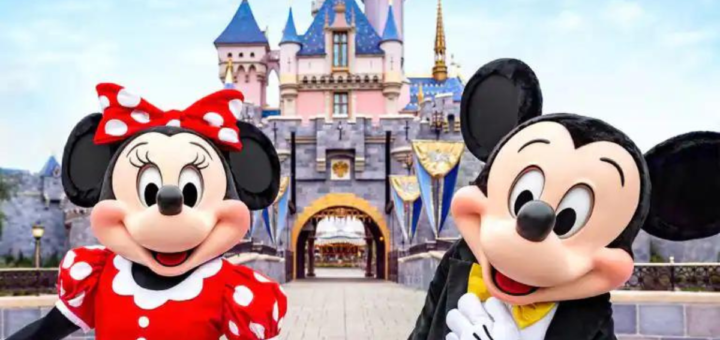
Disneyland Disney 100 Celebration
We’ll know when we study Disneyland’s wait times for the past month!
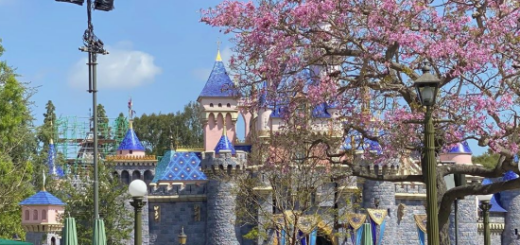
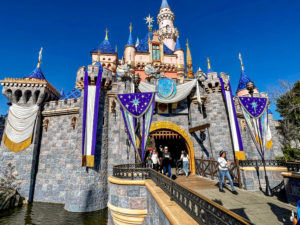
Disneyland Park
Presuming this publishes when I expect it to happen, you’re reading this during the week of July 4th.

We know this time in the theme park industry as one of the most popular weeks of the entire year.
Virtually all Americans are on vacation at this point. Where do we want to go when we have vacations? Disney theme parks!

(Christian Thompson/Disneyland Resort)
Disneyland Resort didn’t max out its attendance in June, as the first part of the month isn’t summer vacation for all students.
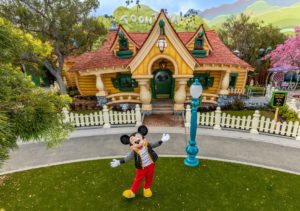
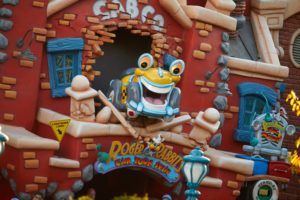
Honestly, that’s for the best, though. During June, park officials started work on significant repairs at Mickey’s Toontown.
(Christian Thompson/Disneyland Resort)
As a reminder, Mickey & Minnie’s Runaway Railway opened in late January. At the time, Disneyland officials took an unusual approach.
They debuted the E-ticket attraction before the rest of the new themed land. Two months later, Mickey’s Toontown opened to the public.
Christian Thompson/Disneyland Resort)
I cannot help but wonder whether this odd tactic caused some of the issues we’ve seen with the construction of Mickey’s Toontown.
Whatever the explanation, the need for quick refurbishment has played a factor in the park’s wait times over the past month.
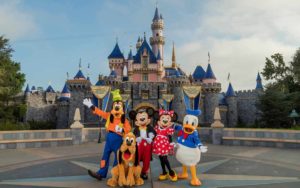
Photo: Travel and Leisure
Average Waits at Disneyland Park
Keeping the above in mind, here are the park’s average wait times for the past 30 days:
- Star Wars: Rise of the Resistance – 76 minutes, down 1
- Space Mountain – 70 minutes, up 2
- Indiana Jones Adventure – 62 minutes, no change
- Millennium Falcon: Smugglers Run – 57 minutes, up 7
- Matterhorn Bobsleds – 56 minutes, n/a
- Roger Rabbit’s Car Toon Spin – 54 minutes, no change
- Mickey & Minnie’s Runaway Railway – 50 minutes, down 3
- Big Thunder Mountain Railroad – 46 minutes, no change
- Peter Pan’s Flight – 40 minutes, up 1
- Haunted Mansion – 39 minutes, up 1
- Chip ‘n’ Dale’s GADGETcoaster – 37 minutes, down 3
- Autopia – 35 minutes, up 6
- Astro Orbiter – 33 minutes, up 3
- Buzz Lightyear Astro Blasters – 33 minutes, up 4
- Alice in Wonderland – 32 minutes, up 1
- Dumbo the Flying Elephant – 32 minutes, no change
- Meet Mickey Mouse at Mickey’s House – 32 minutes, down 1
- Pirates of the Caribbean – 32 minutes, up 2
- Star Tours – The Adventures Continue! – 31 minutes, up 2
- Jungle Cruise – 30 minutes, up 2
- Finding Nemo Submarine Voyage – 29 minutes, up 4
- Snow White’s Enchanted Wish – 24 minutes, up 2
- Toad’s Wild Ride – 21 minutes, no change
- Davy Crockett’s Explorer Canoes – 20 minutes, no change
- It’s a Small World – 20 minutes, up 4
- Casey Jr. Circus Train – 19 minutes, down 3
- Storybook Land Canal Boats – 19 minutes, up 2
- Pinocchio’s Daring Journey – 18 minutes, up 1
- Mad Tea Party – 16 minutes, up 3
- Disneyland Railroad – 15 minutes, up 1
- The Many Adventures of Winnie the Pooh – 14 minutes, down 3
- King Arthur Carrousel – 12 minutes, up 1
- Disneyland Monorail – 10 minutes, up 1
- Meet Tinkerbell – 9 minutes, no change
(Christian Thompson/Disneyland Resort)
Let’s Talk about Disneyland Wait Times
During the past month, guests stood in line for an average of 34 minutes per attraction, which is four minutes or 13 percent more than the previous month.
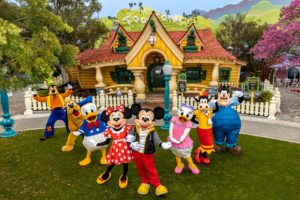
You can see that the waits dropped at the most popular attractions at Mickey’s Toontown, presumably because they were a bit more challenging to visit.
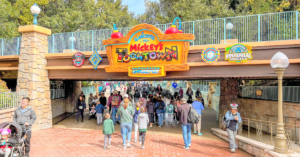
When guests see construction walls at various spots in the park, they tend to veer elsewhere instead.
I’m not noticing any direct impact on spillover in the adjoining themed lands, though. So, my speculation could be baseless. It’s tough to tell from the outside.
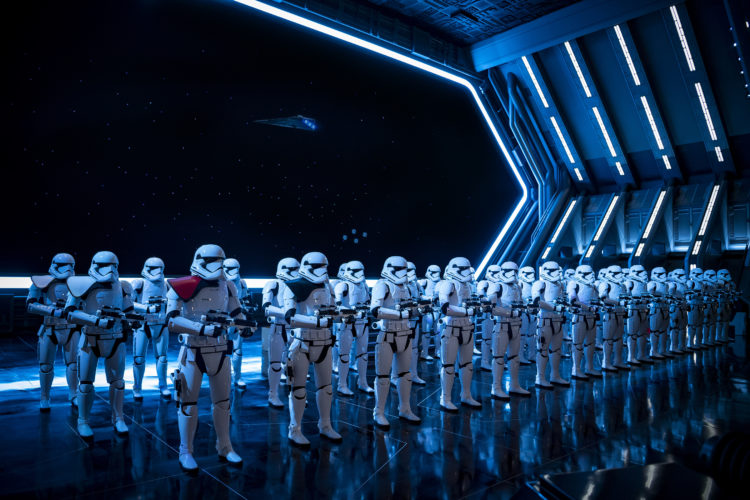
Photo: Matt Stroshane
The overall positive here is that only seven attractions averaged waits of 50+ minutes in June, which is quite reasonable, all things considered.
Even better, only three of them surpassed an hour. That behavior likely won’t happen in July, but it’s a reasonable expectation for August…or at least the second half of it.
(Matt Stroshane/Disney Parks)
Disney California Adventure
As usual, the primary changes at Disney California Adventure last month involved new Marvel character meetings.
We also got Rogers: The Musical, but it’s not a show with a standby line queue. Disney employs virtual queueing instead. So, it’ll never make our list.
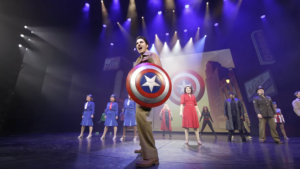
Photo: Disney
Here are the other average wait times at Disney California Adventure (DCA) over the past 30 days:
- Radiator Springs Racers – 85 minutes, up 10
- Guardians of the Galaxy – Mission: BREAKOUT! – 64 minutes, up 5
- Toy Story Midway Mania! – 56 minutes, up 3
- WEBSLINGERS – A Spider-Man Adventure – 52 minutes, up 2
- Soarin’ Around the World – 49 minutes, up 3
- Goofy’s Sky School – 45 minutes, up 2
- Monsters, Inc. Mike & Sulley to the Rescue! – 43 minutes, no change
- The Incredicoaster – 40 minutes, no change
- Pixar Pal-A-Round – 37 minutes, up 3
- Grizzly River Run – 33 minutes, up 3
- Luigi’s Rollickin’ Roadsters – 31 minutes, up 1
- Mater’s Junkyard Jamboree – 30 minutes, up 10
- Inside Out Emotional Whirlwind – 22 minutes, no change
- Silly Symphony Swings – 18 minutes, no change
- The Little Mermaid ~ Ariel’s Undersea Adventure – 17 minutes, up 1
- Jumpin’ Jellyfish – 15 minutes, up 2
- Golden Zephyr – 13 minutes, up 1
- Mickey’s PhilharMagic – 12 minutes, no change
- Jessie’s Critter Carousel – 5 minutes, no change
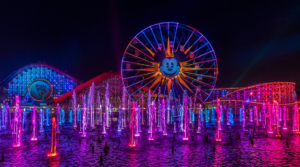
Photo: DIsneyland
Overall, DCA guests waited for an average of 35 minutes per attraction, which is three minutes more than last time.
So, we did track a modest bump of about ten percent overall at Disneyland Resort attractions over the past month.
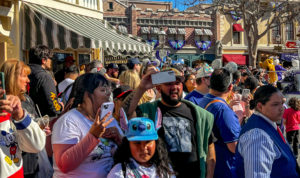
DL Crowds
You may safely expect a more dramatic spike in July, which is often the busiest month on the annual calendar. It’s either now or December.
Photo: MickeyBlog
Thanks for visiting MickeyBlog.com! Want to go to Disney? For a FREE quote on your next Disney vacation, please fill out the form below, and one of the agents from MickeyTravels, a Diamond Level Authorized Disney Vacation Planner, will be in touch soon!