Walt Disney World Wait Times for Second Week of May 2024
We’re currently in the lull at Walt Disney World or, as tourism analysts think of it, the calm before the storm.
When Memorial Day Week arrives, the parks will transition to the summer season.
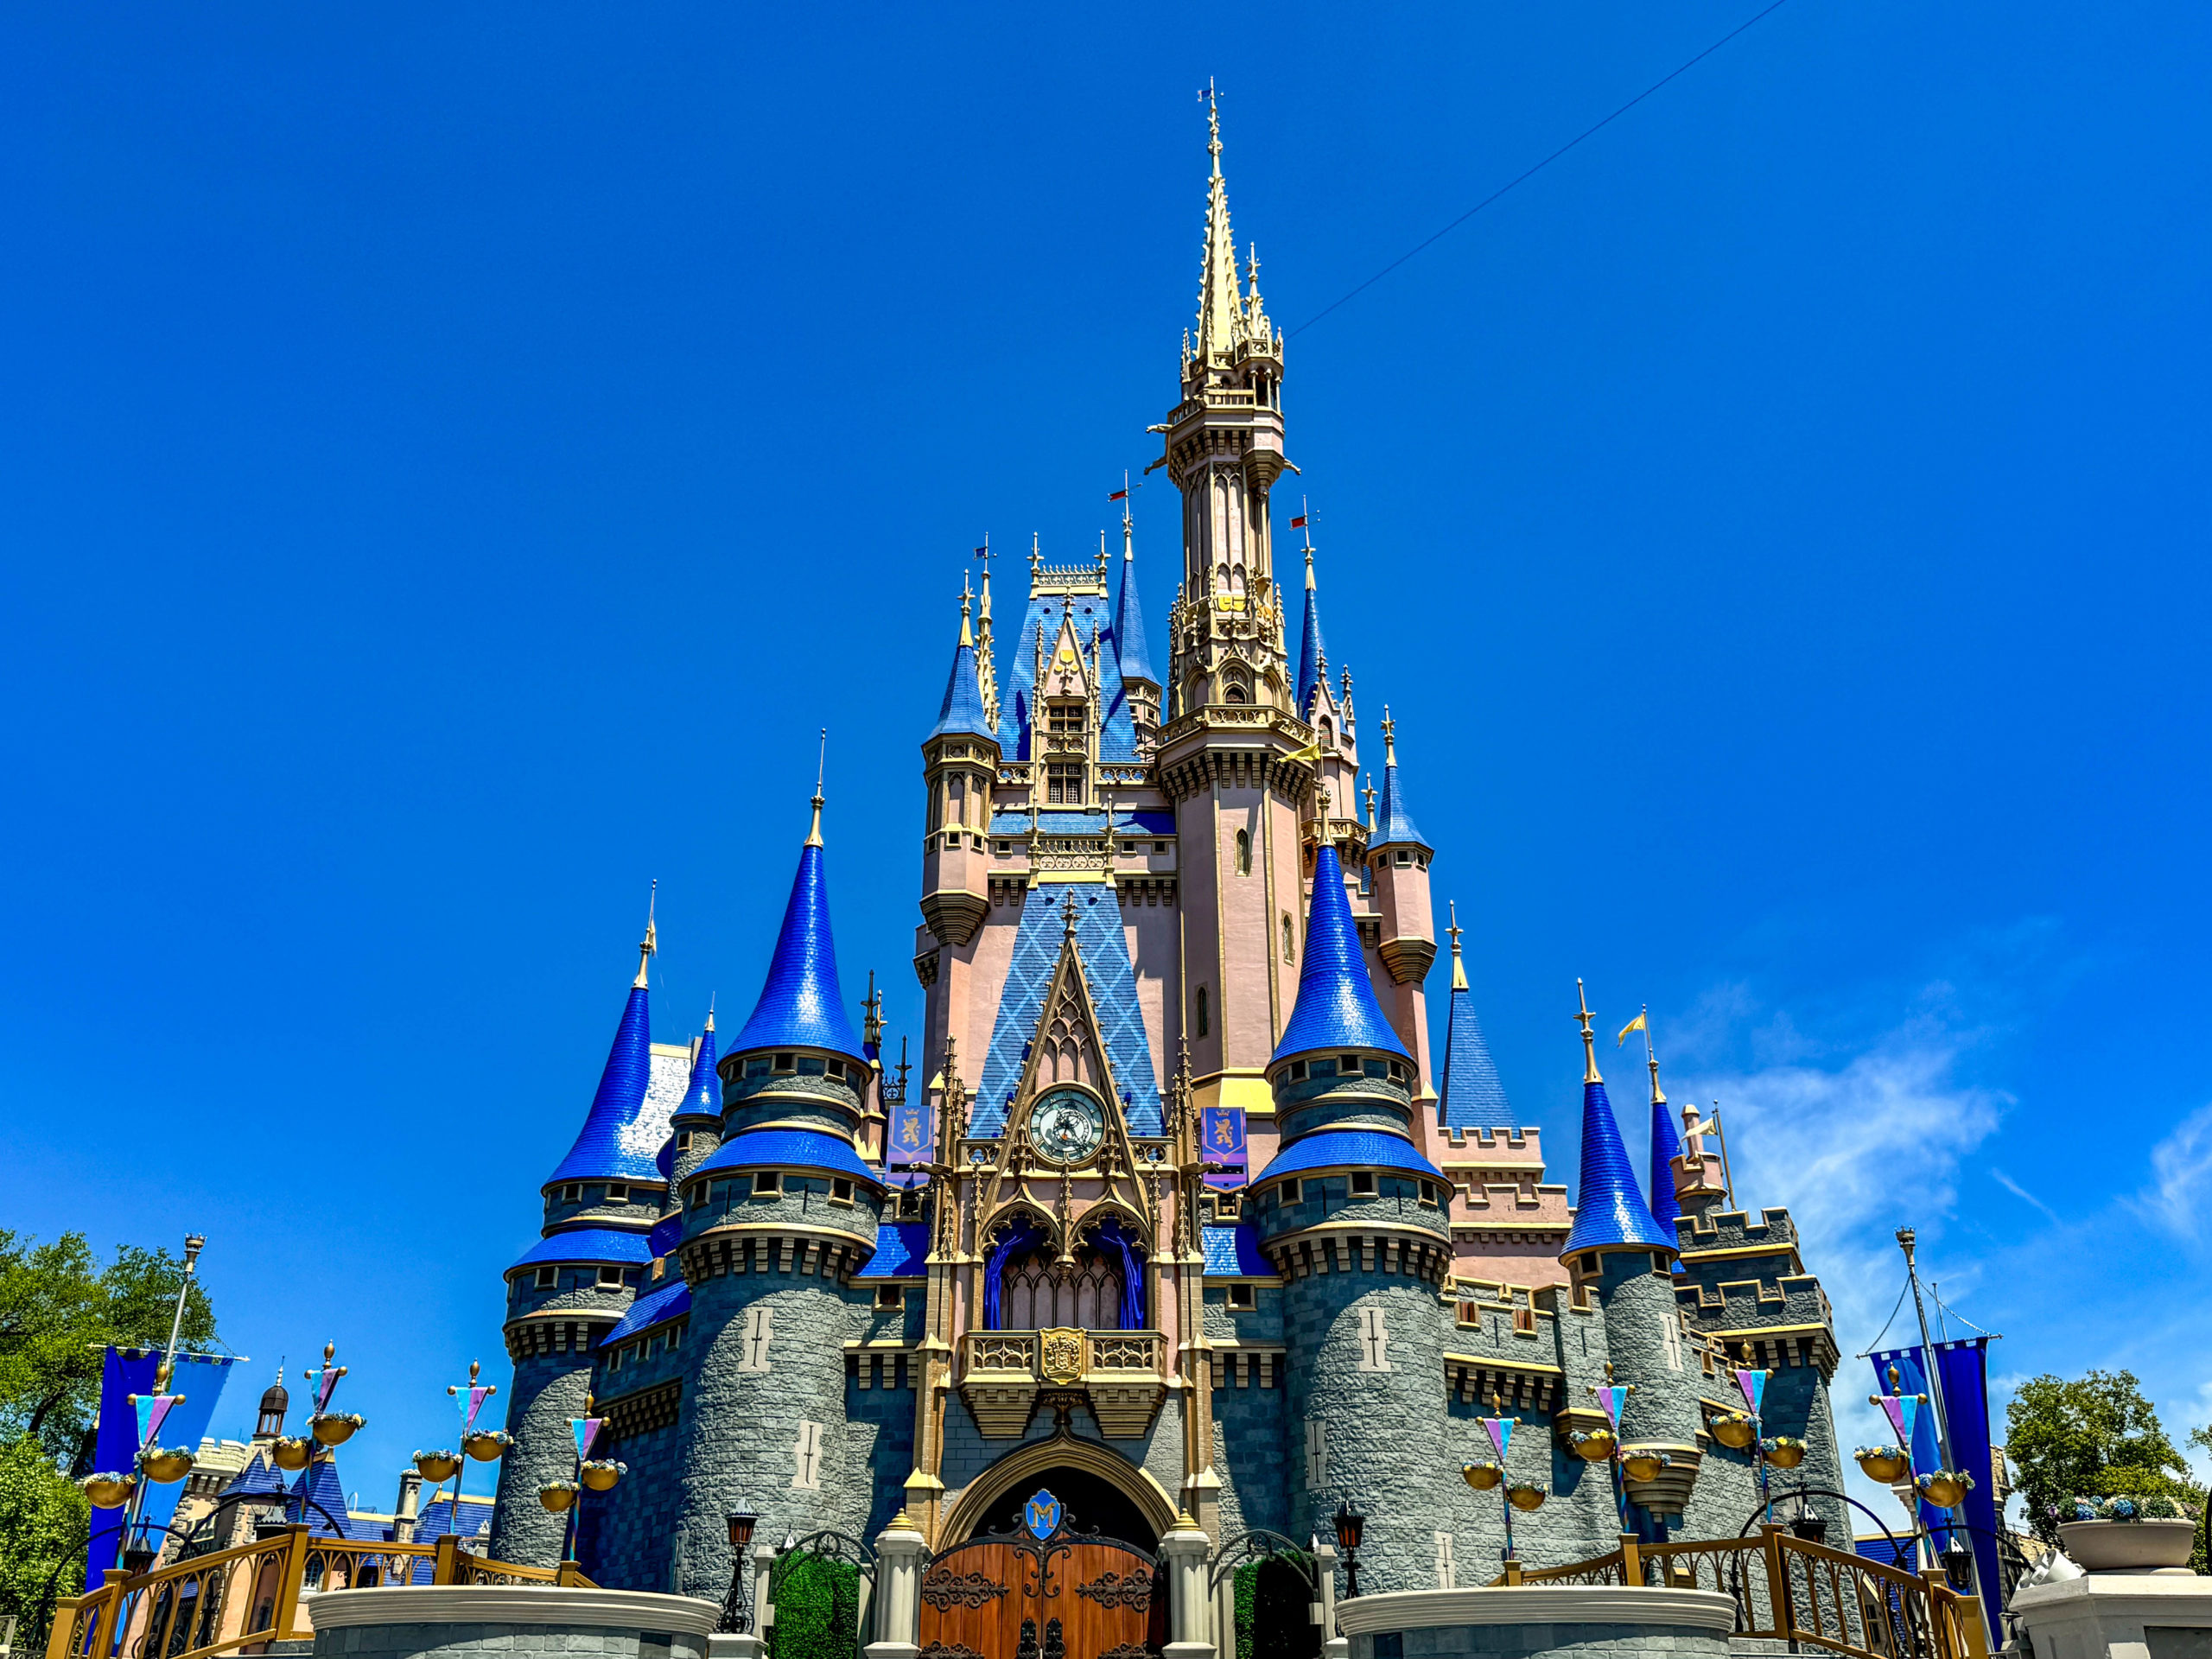
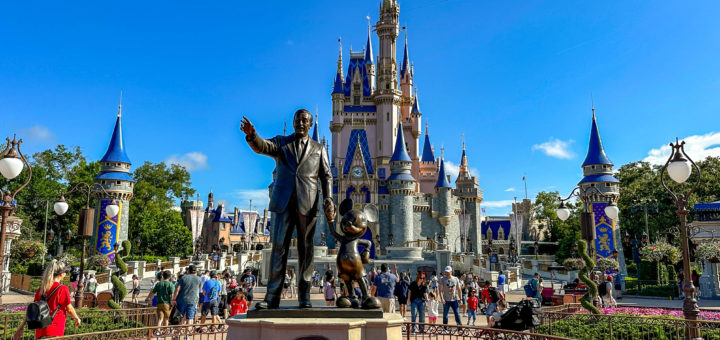
Cinderella Castle in Magic Kingdom
That’s when Disney crowds swell to some of their highest levels of the year.
Recently, the second half of June has been more crowded than July, but we don’t know whether that trend will continue.
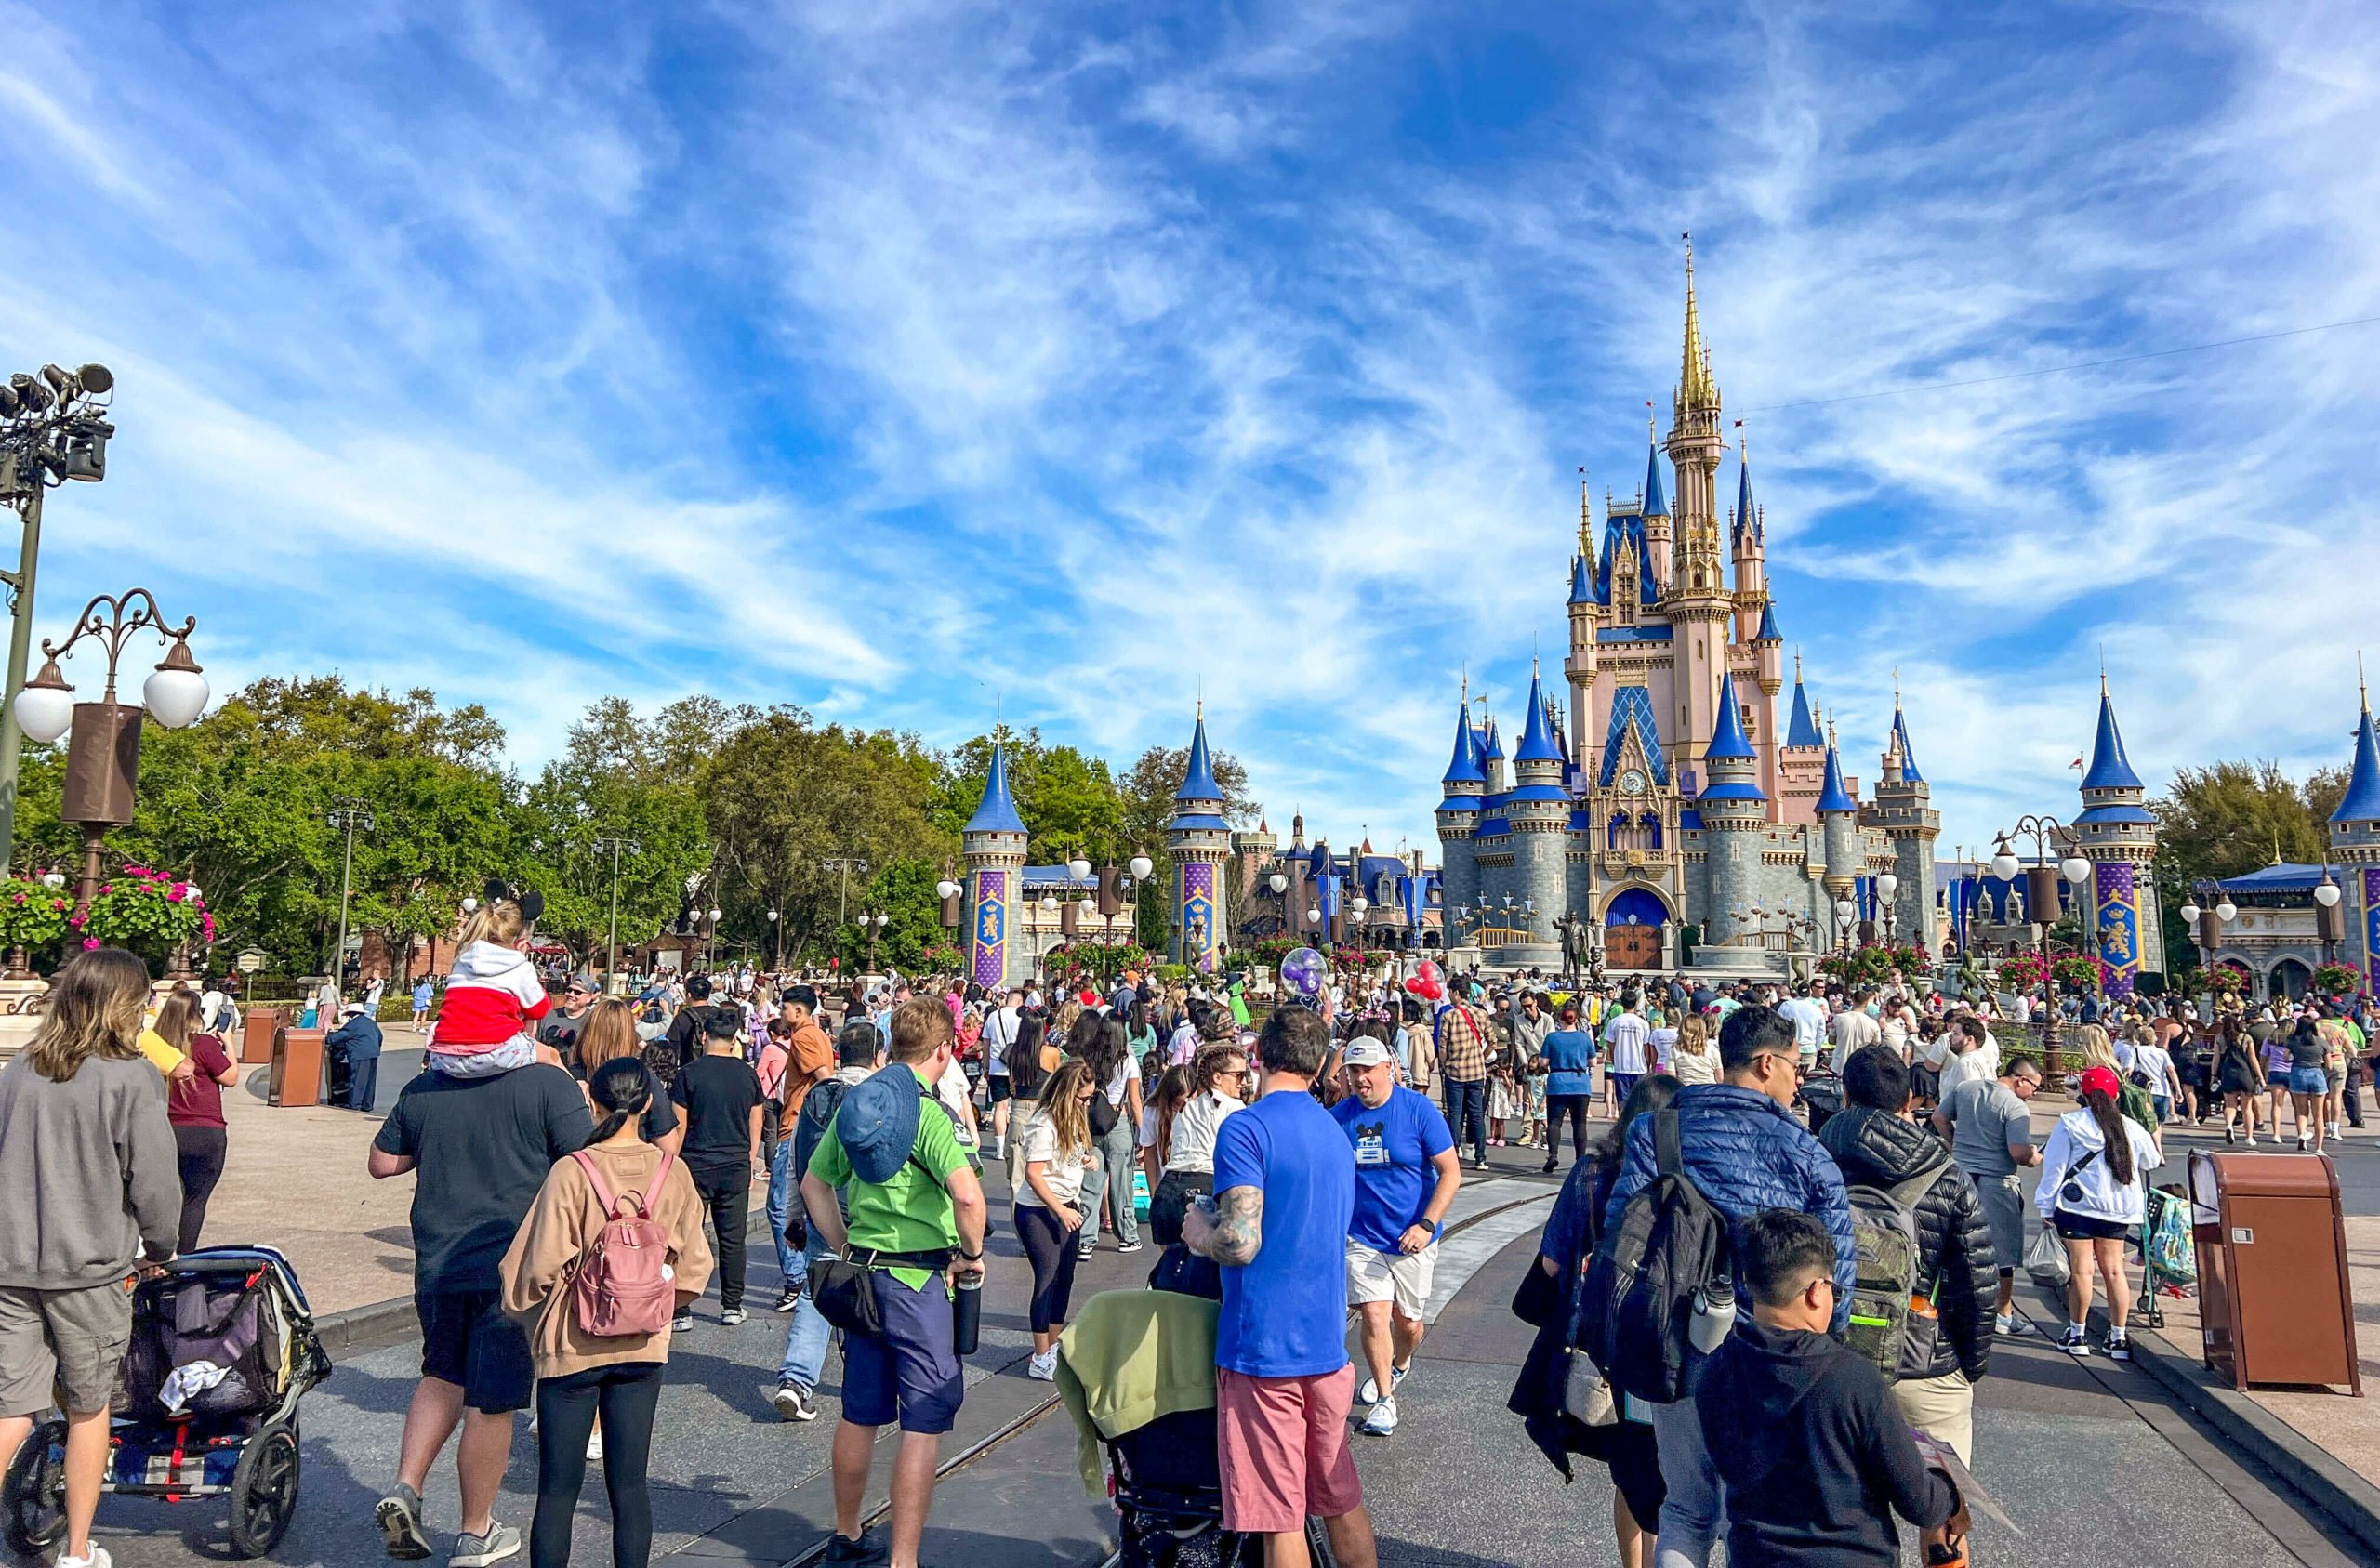
Spring Break crowds
What we do know is that the first half of May is the slow season before crowds gradually increase later in the month.
So, the Walt Disney World wait times for the second week of May should be the lowest we track for a while.
Disney’s Animal Kingdom
Anecdotally, some of the crowd reports this week, especially at Magic Kingdom, suggested smaller attendance numbers.
We can often track that right off the bat at Animal Kingdom. If Pandora – The World of Avatar is slow, everything will be.
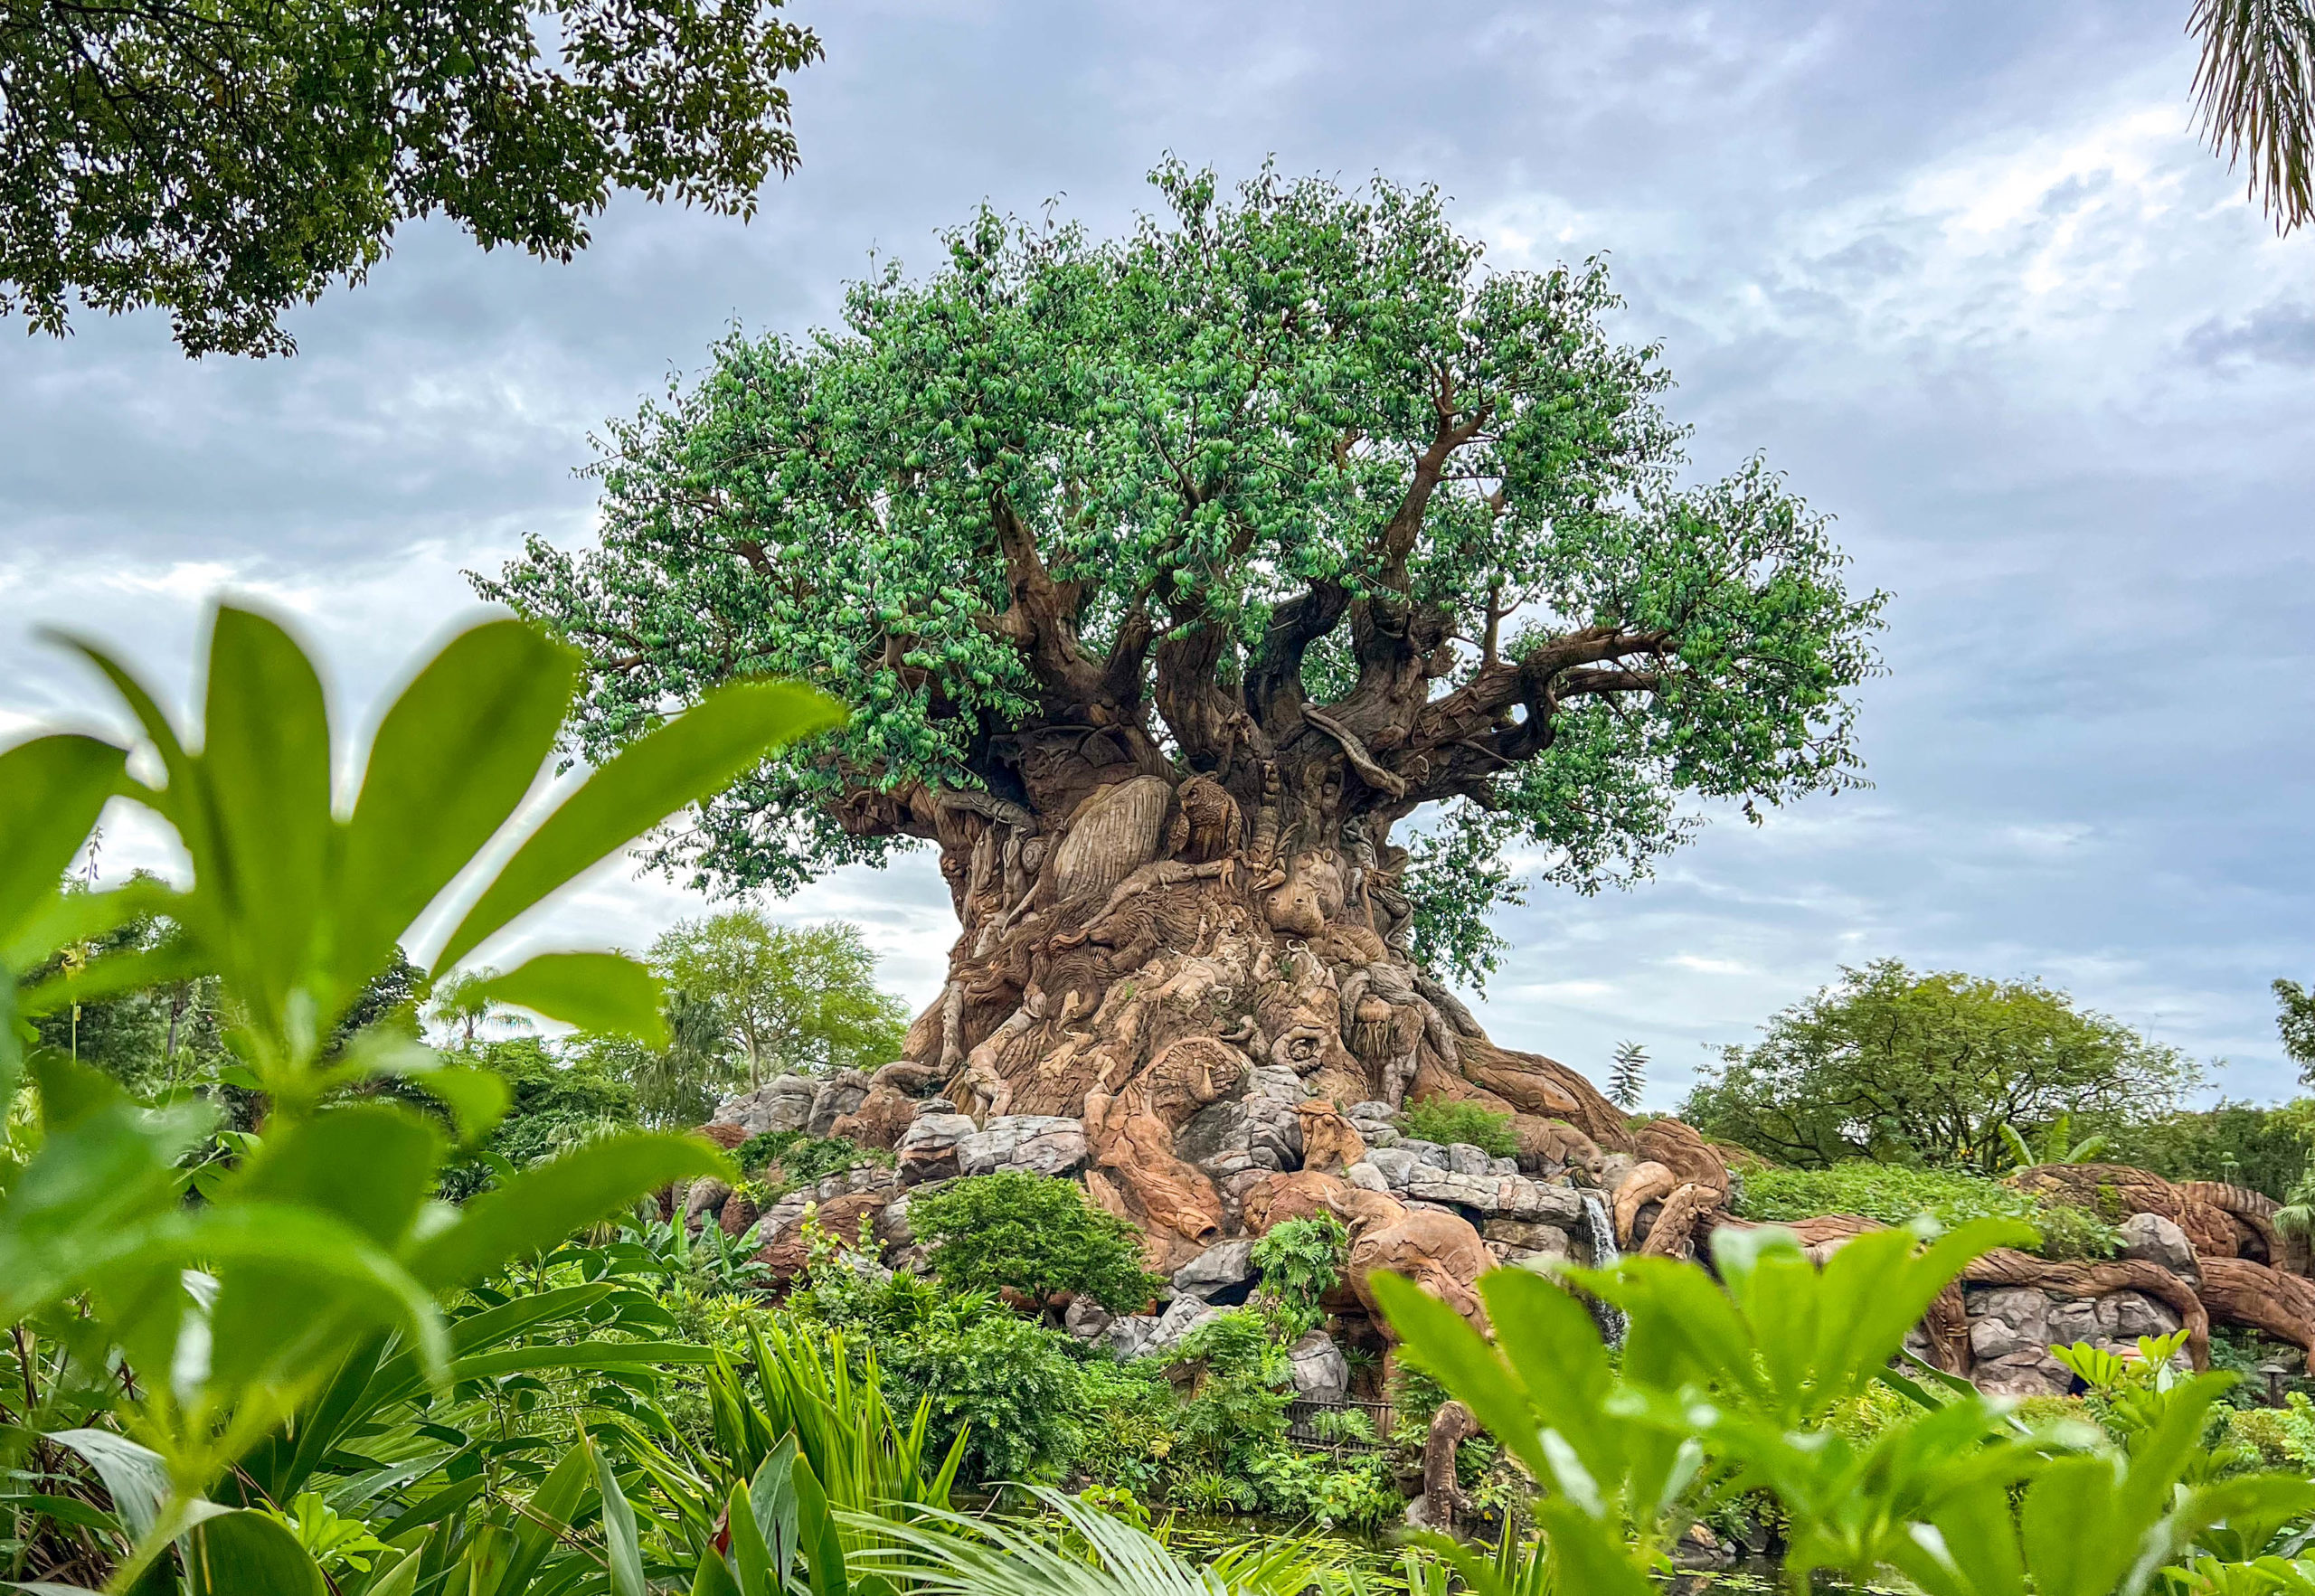
Tree of Life
However, Avatar Flight of Passage increased its wait time to 98 minutes, six minutes more than last week.
Similarly, Na’vi River Journey’s wait time went up eight minutes to 63 minutes.
Avatar — Flight of Passage
That data already flies in the face of the anecdotal reports. So, let’s evaluate the park’s other average wait times:
- Adventurers Outpost – 50 minutes, no change
- Kali River Rapids – 47 minutes, up 9
- Expedition Everest – 44 minutes, down 1
- Kilimanjaro Safaris – 35 minutes, up 1
- DINOSAUR – 26 minutes, up 3
- It’s Tough to Be a Bug! – 15 minutes, up 5
- TriceraTop Spin – 10 minutes, no change
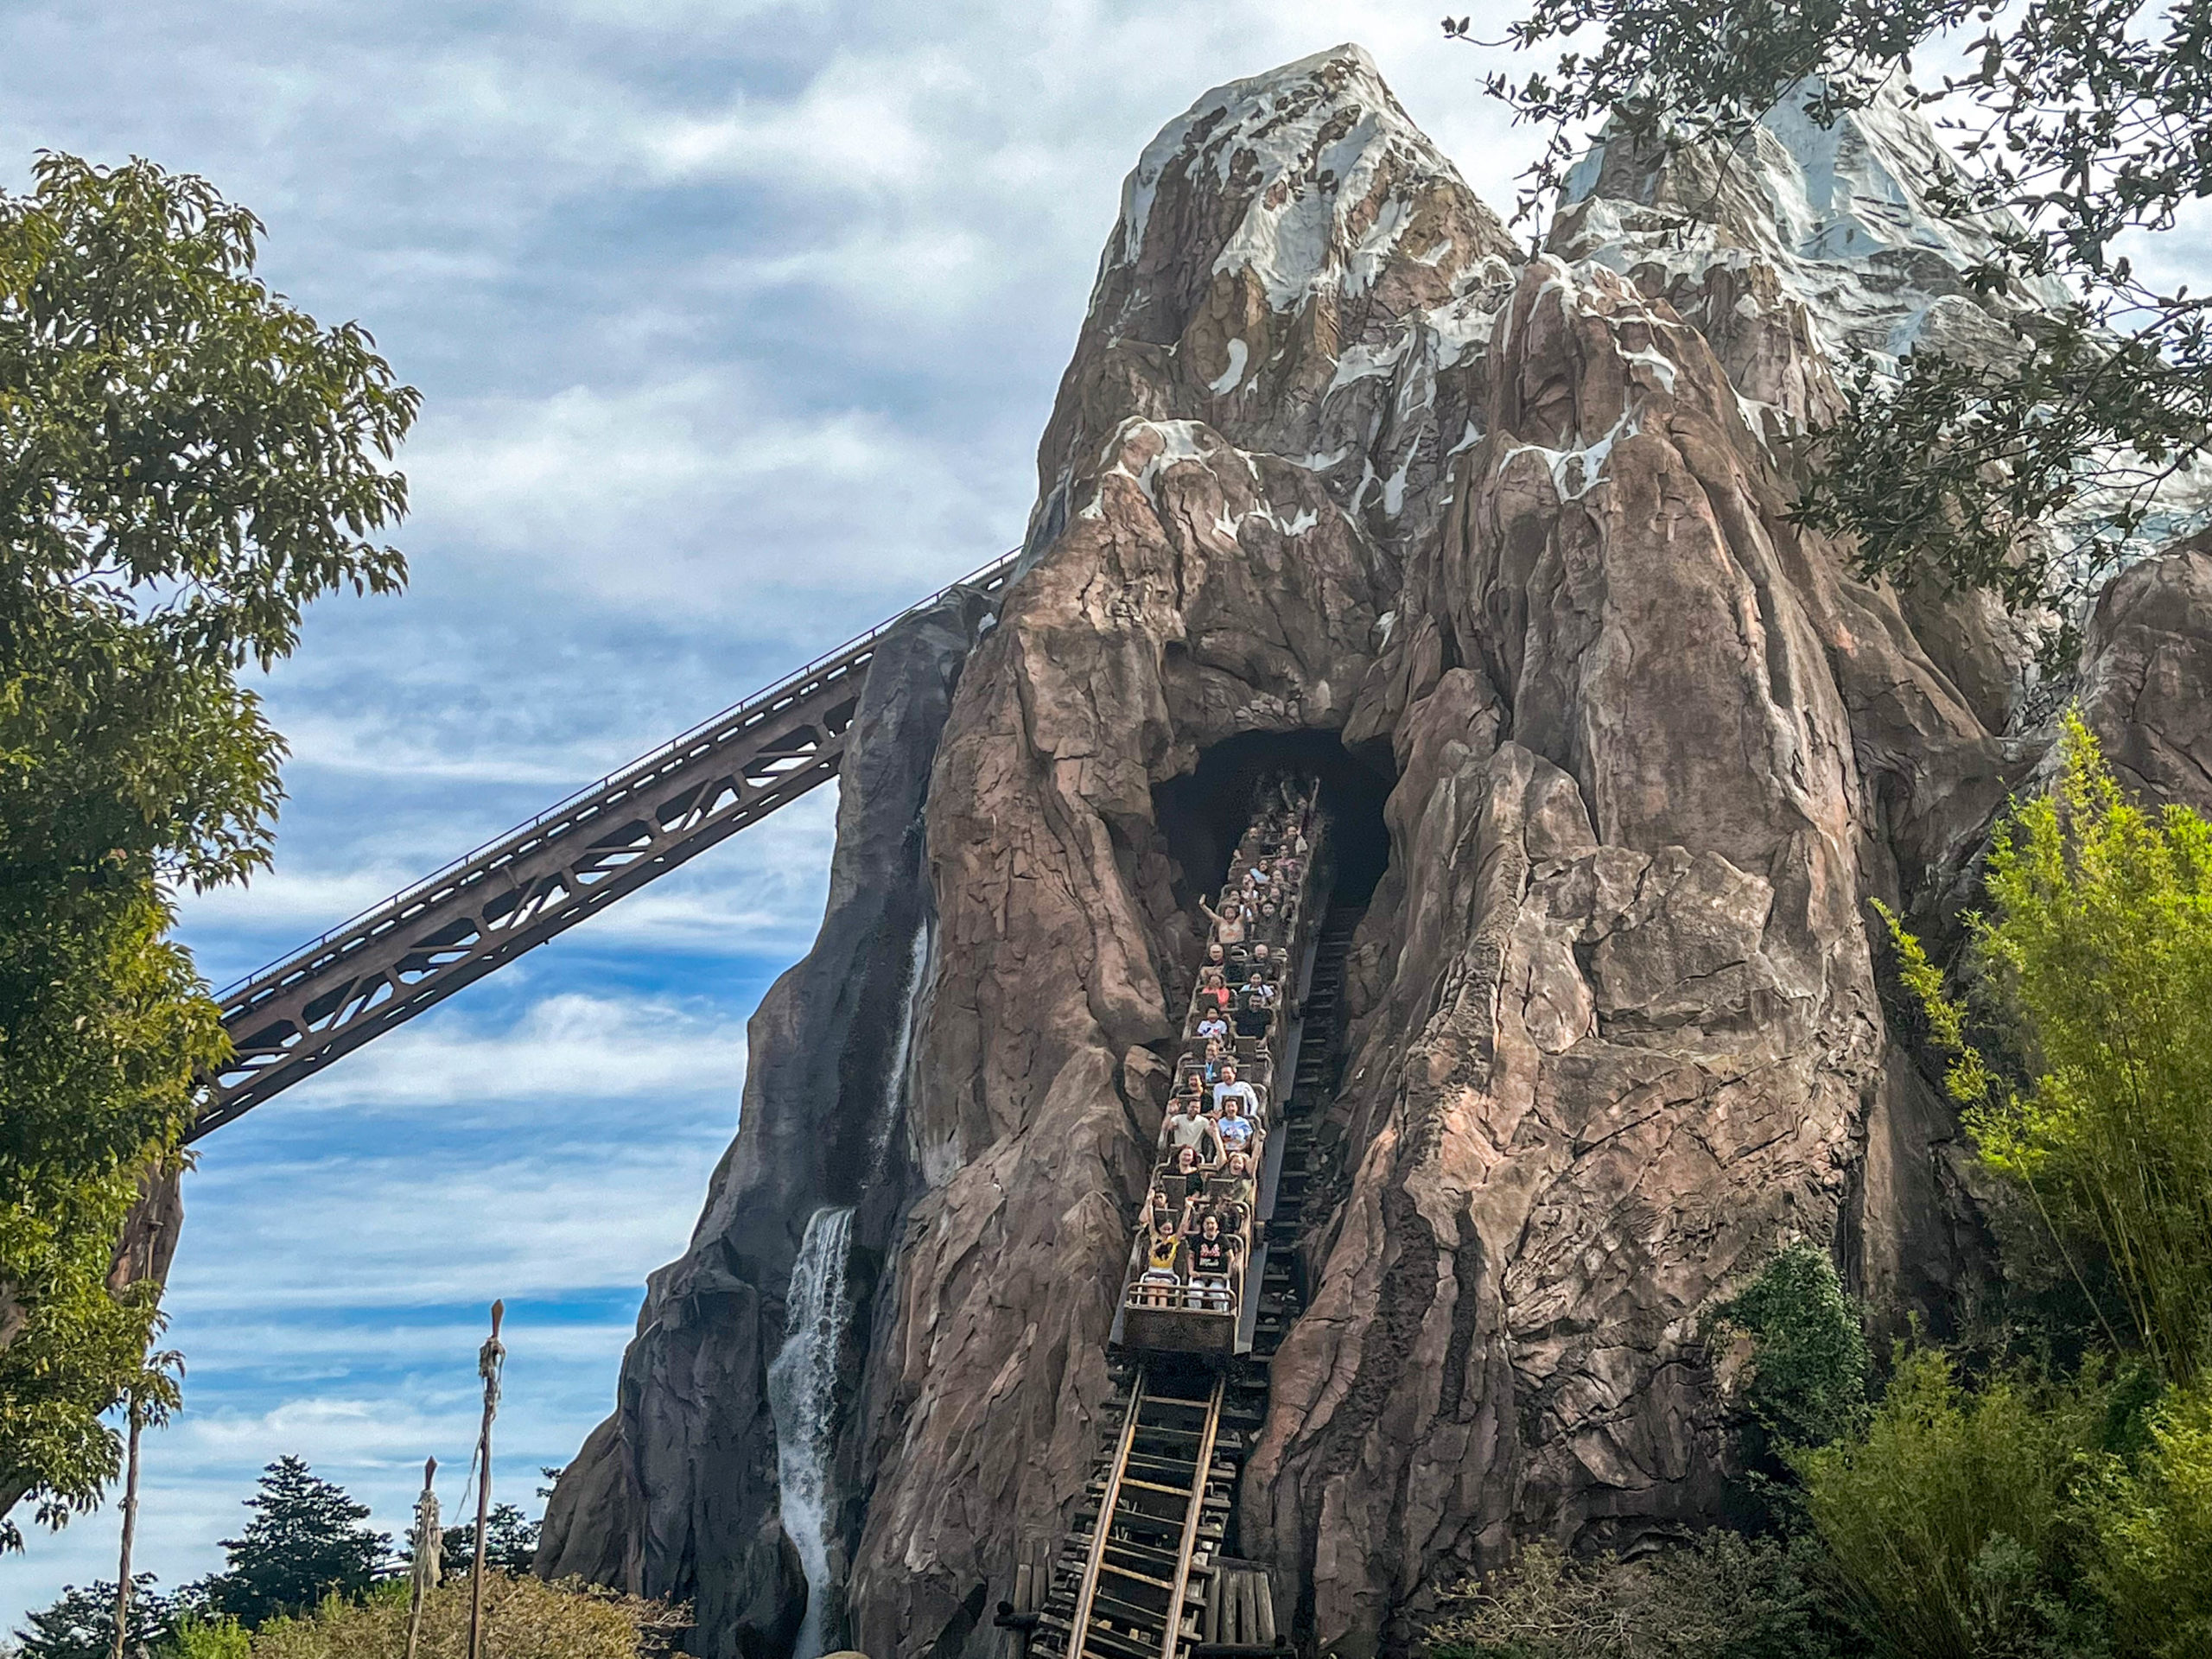
Expedition Everest
Overall, Animal Kingdom attractions averaged a wait of 43 minutes, which is four minutes or ten percent more than last time.
Disney’s Hollywood Studios
Okay, that was an unexpected turn of events based on what some people said about their park visits.
However, this sort of modest uptick isn’t unusual as we advance deeper into the month of May.
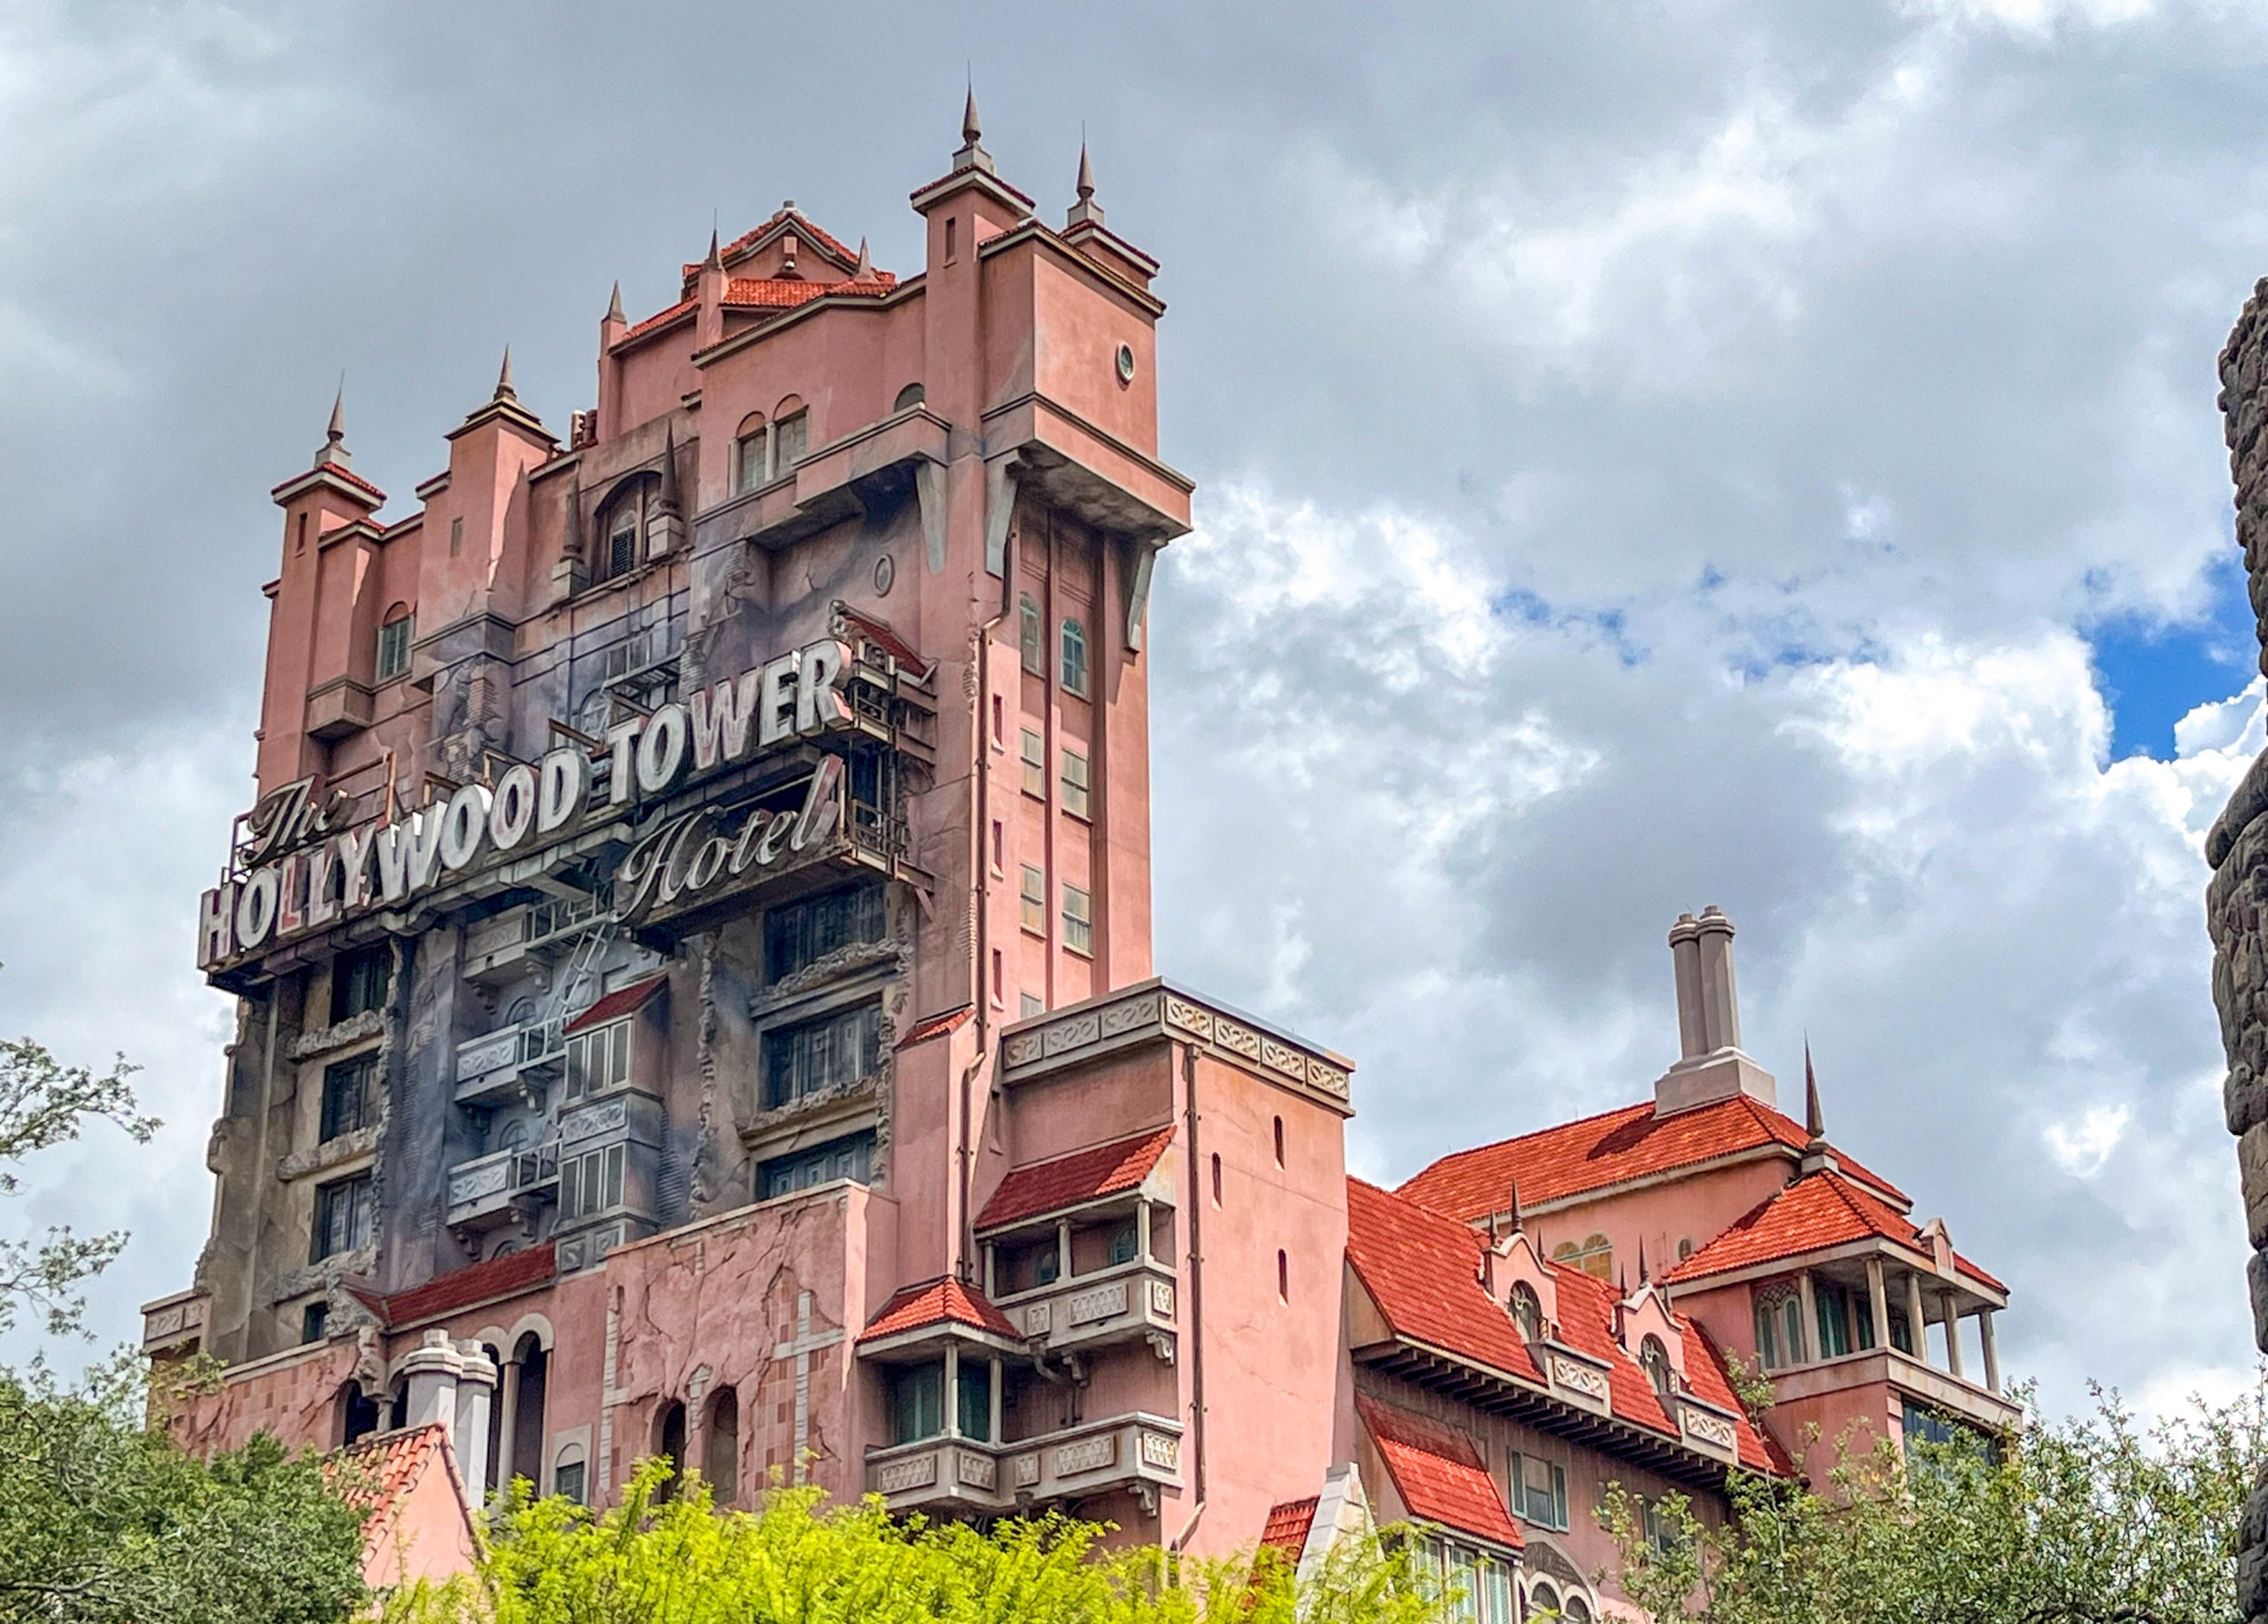
Tower of Terror
Also, Animal Kingdom may be a one-off. Let’s check the average wait times at Hollywood Studios for a second baseline:
- Slinky Dog Dash – 83 minutes, up 2
- Star Wars: Rise of the Resistance – 75 minutes, down 6
- Twilight Zone Tower of Terror – 63 minutes, up 1
- Millennium Falcon: Smugglers Run – 62 minutes, up 1
- Mickey & Minnie’s Runaway Railway – 56 minutes, up 4
- Toy Story Mania! – 51 minutes, up 3
- Red Carpet Dreams – 42 minutes, up 2
- Alien Swirling Saucers – 37 minutes, up 1
- Celebrity Spotlight – 23 minutes, up 4
- Lightning McQueen’s Racing Academy – 15 minutes, no change
- Star Tours – The Adventures Continue – 14 minutes, down 2
- Muppet*Vision 3D – 10 minutes, no change
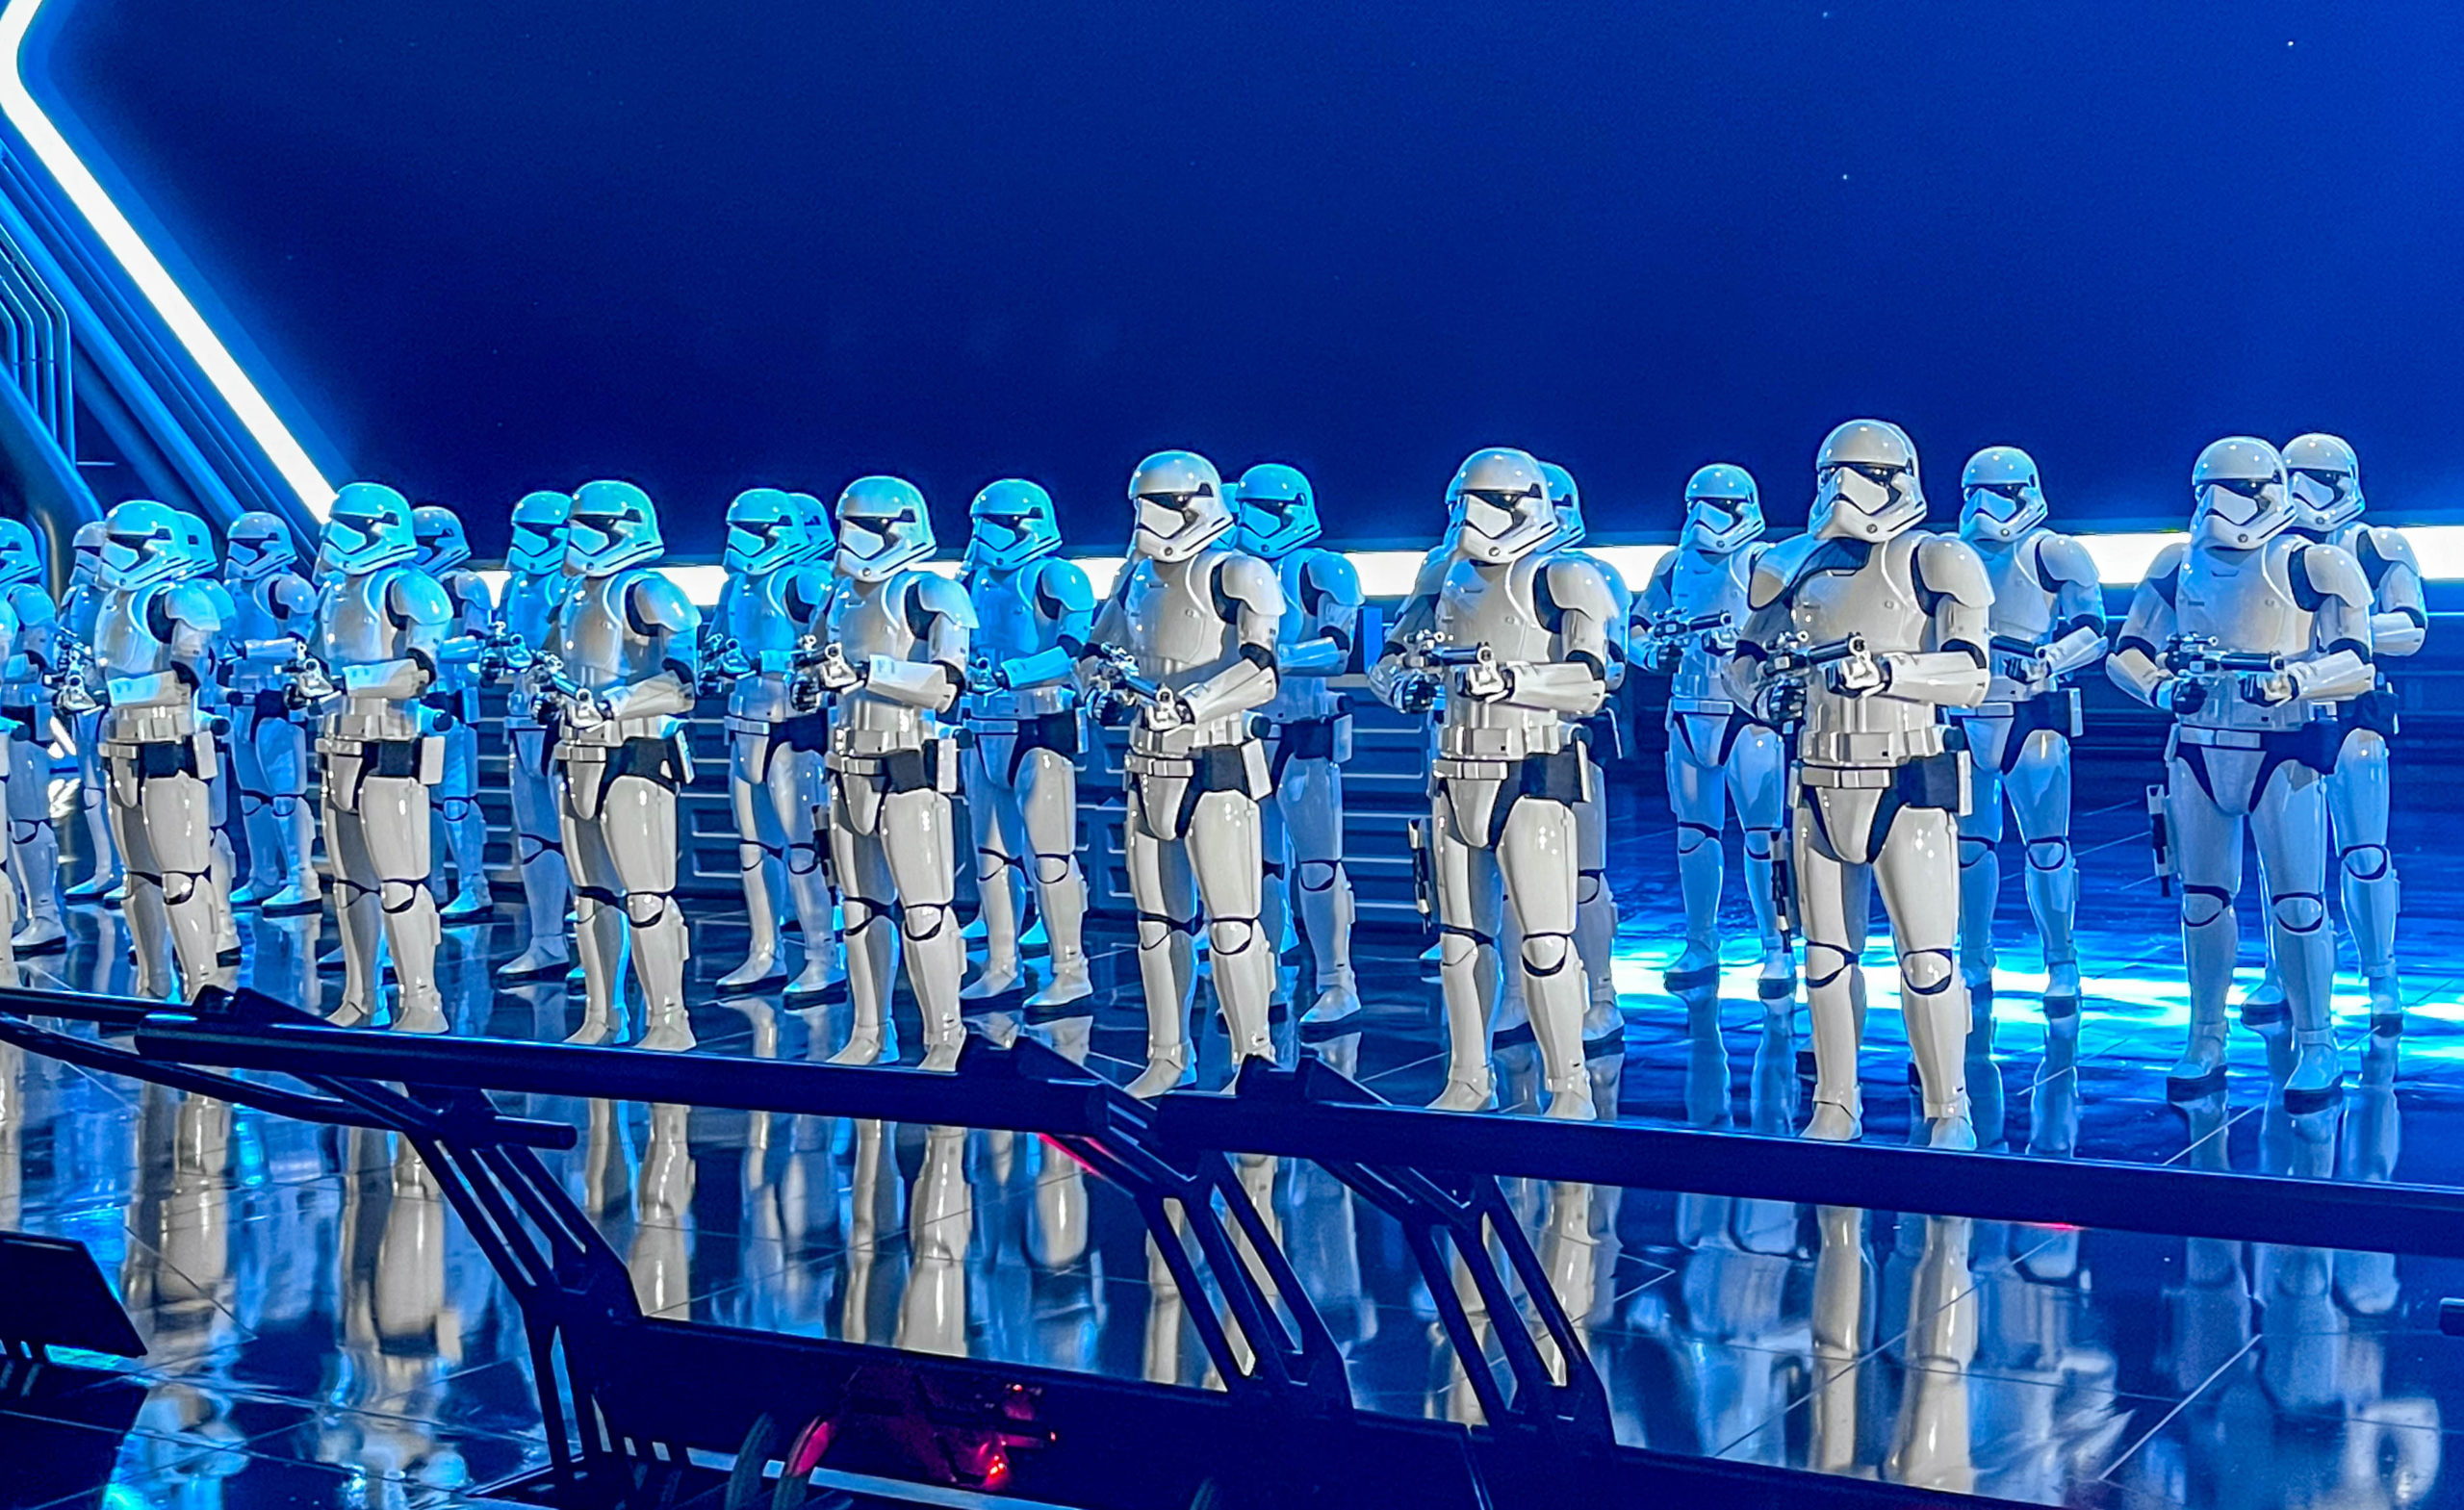
Rise of the Resistance
Overall, Hollywood Studios guests stood in line for an average of 41 minutes per attraction, which is just one minute more than last time.
EPCOT
Thus far, Animal Kingdom crowds have increased by four minutes, while Hollywood Studios was basically flat week-over-week.
We still lack a consensus on last week’s crowds. Hopefully, the next two parks will clarify the matter.
Spaceship Earth
Here are EPCOT’s average attraction wait times last week:
- Frozen Ever After – 77 minutes, up 3
- Remy’s Ratatouille Adventure – 75 minutes, up 7
- Test Track – 64 minutes, up 1
- Mission: SPACE – 47 minutes, up 2
- Soarin’ Around the World – 47 minutes, up 4
- Royal Sommerhus – 36 minutes, down 2
- Journey into Imagination with Figment – 20 minutes, up 6
- Spaceship Earth – 20 minutes, up 2
- Turtle Talk with Crush – 19 minutes, up 1
- The Seas with Nemo & Friends – 18 minutes, up 4
- Living with the Land – 17 minutes, up 4
- Gran Fiesta Tour Starring the Three Caballeros – 14 minutes, up 2
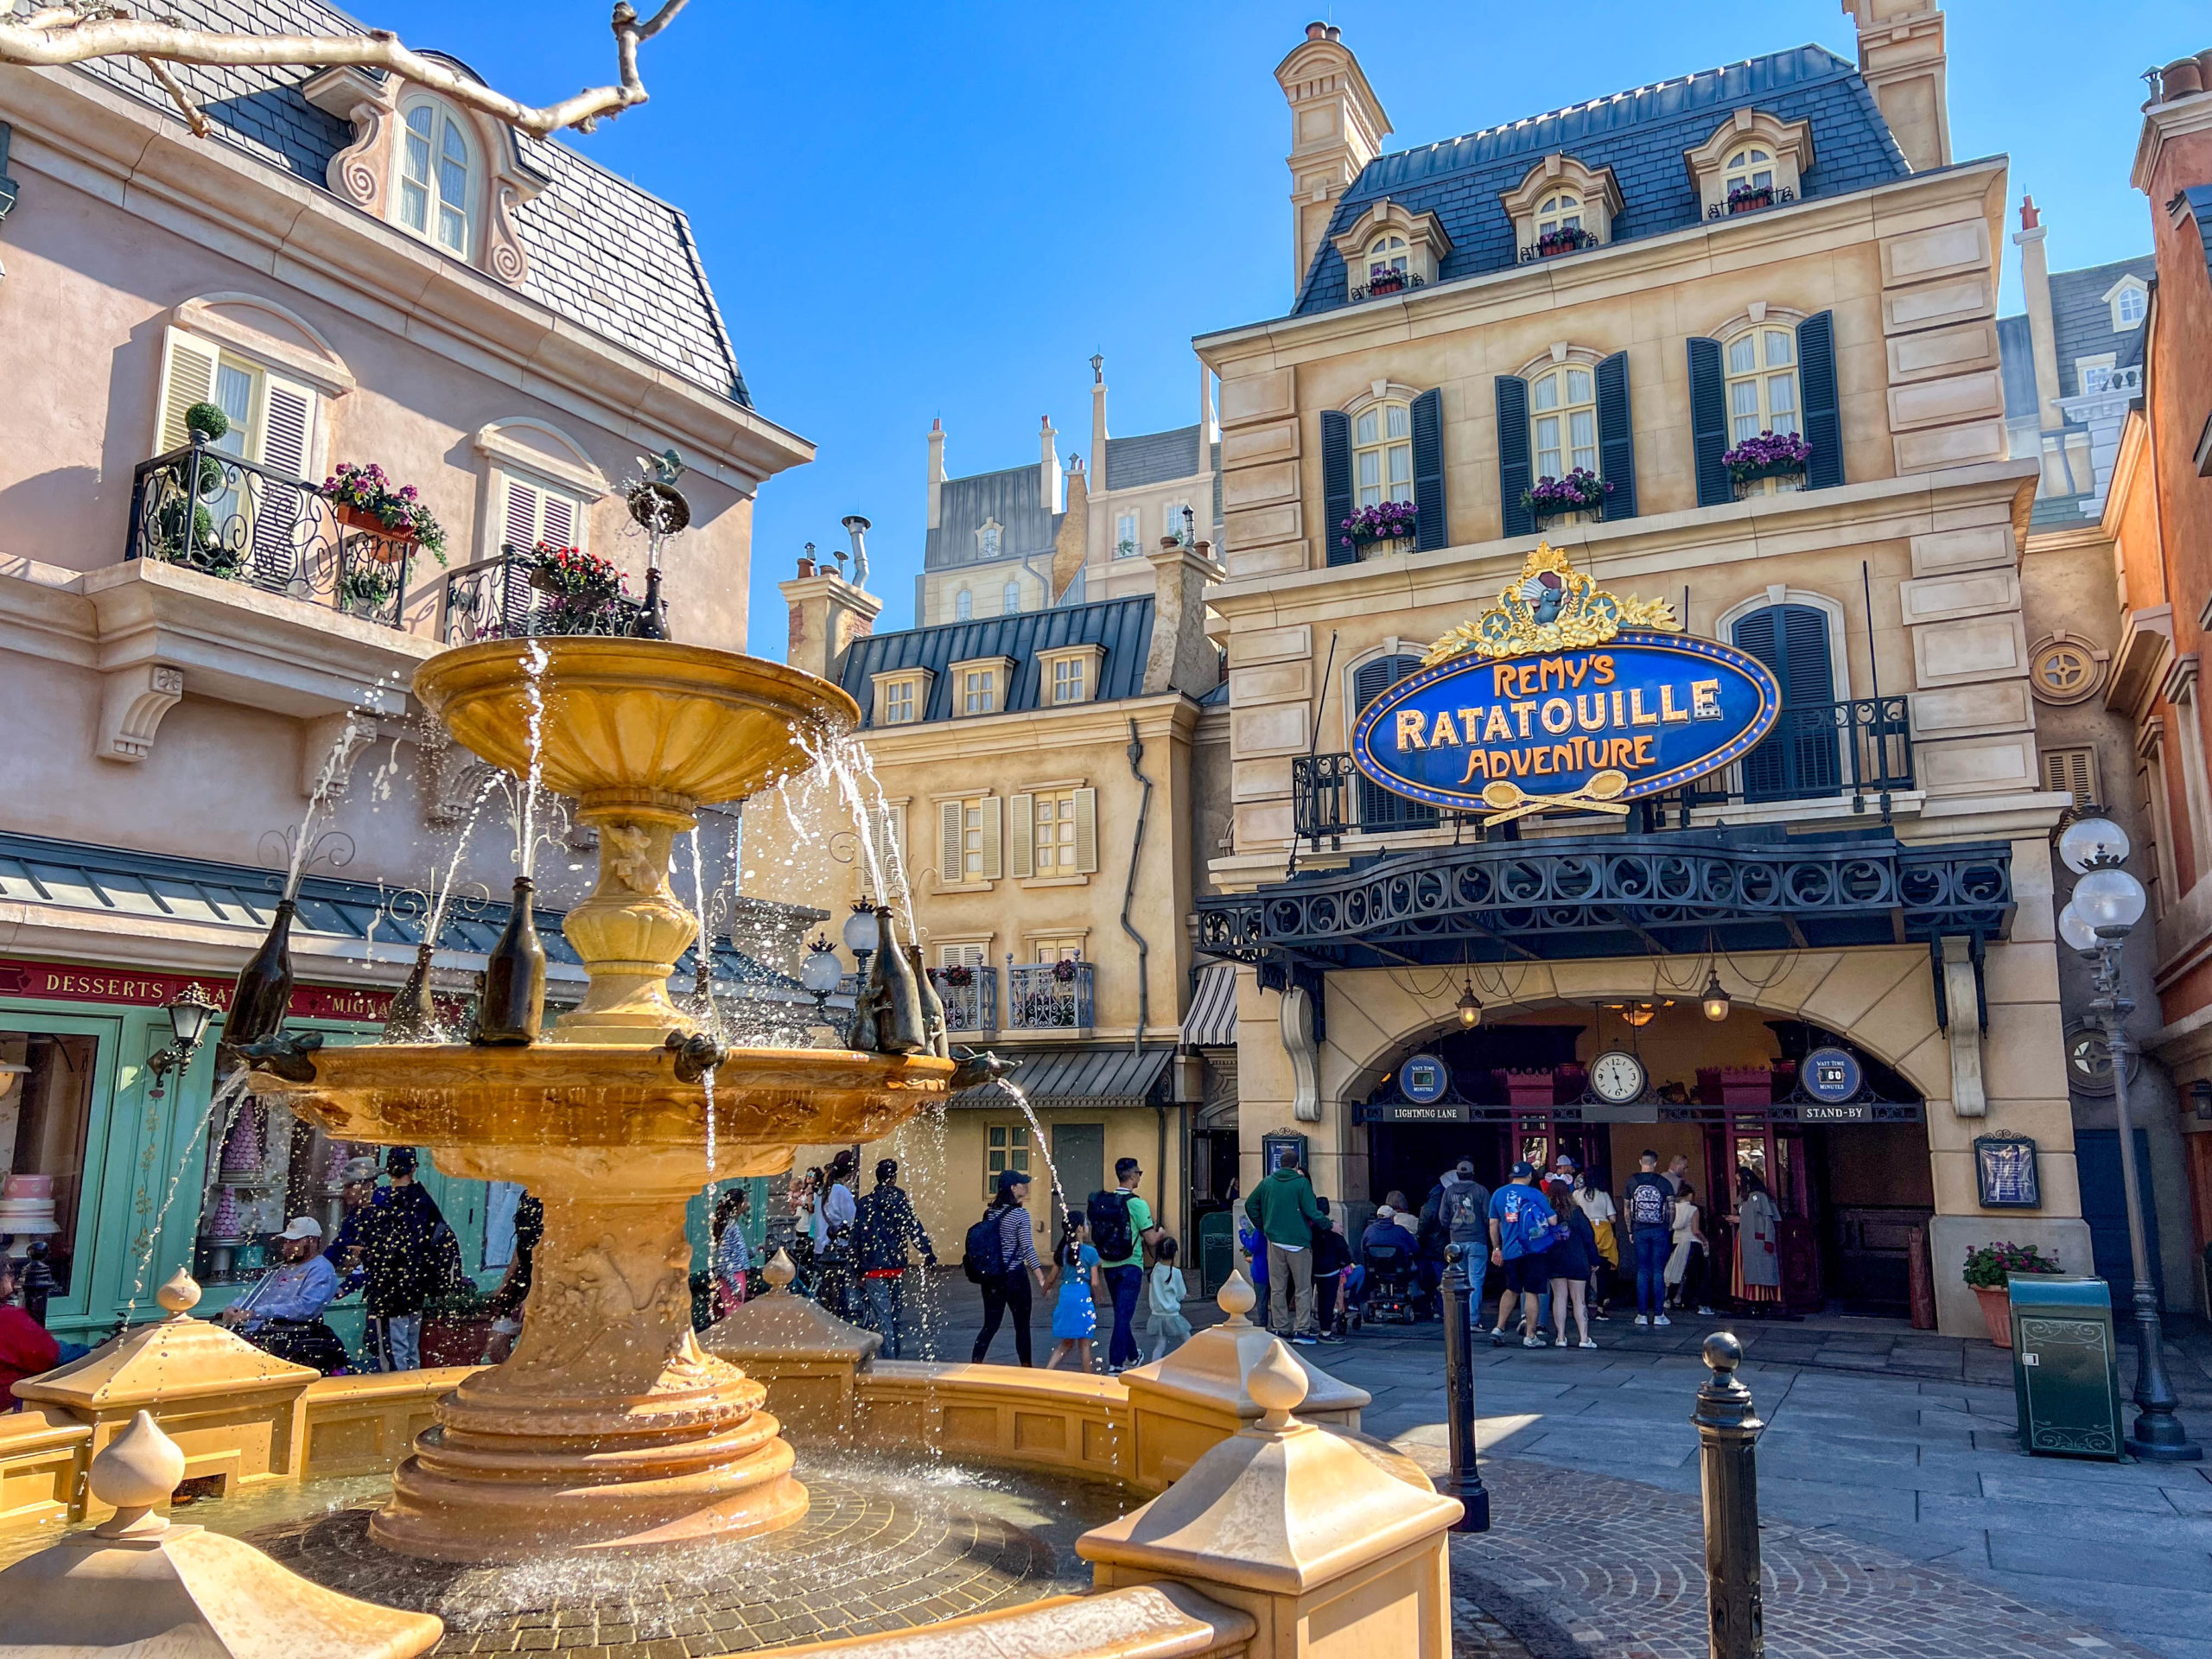
Remy’s Ratatouille Adventure
Overall, EPCOT guests spent an average of 37 minutes waiting for each attraction, two minutes more than last time.
Magic Kingdom
We appear to be ticking up at the parks this past week, but Magic Kingdom reports suggested an emptier park.
Were those tourists just lucky? Here are the park’s average wait times:
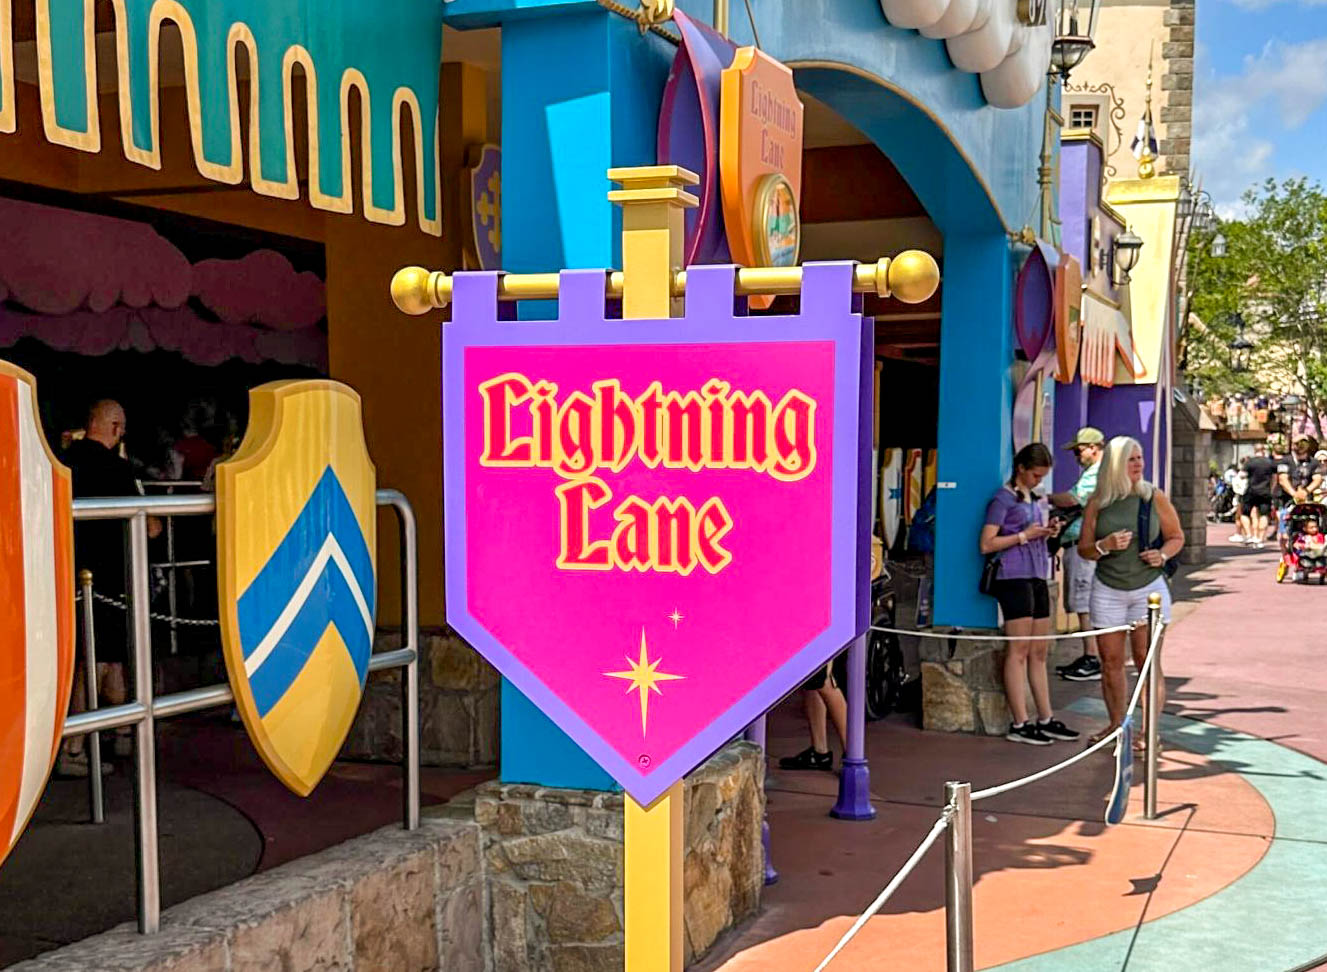
Lightning Lane
- Seven Dwarfs Mine Train – 73 minutes, up 5
- Peter Pan’s Flight – 61 minutes, up 2
- Jungle Cruise – 55 minutes, no change
- Space Mountain – 54 minutes, up 2
- Haunted Mansion – 43 minutes, up 4
- Town Square Theater – 41 minutes, up 1
- Princess Fairytale Hall – 40 minutes, up 3
- Big Thunder Mountain Railroad – 38 minutes, up 5
- The Many Adventures of Winnie the Pooh – 38 minutes, up 4
- Ariel’s Grotto – 37 minutes, down 3
- Pete’s Silly Sideshow – 36 minutes, up 3
- Buzz Lightyear’s Space Ranger Spin – 35 minutes, up 4
- Pirates of the Caribbean – 34 minutes, up 9
- Astro Orbiter – 29 minutes, up 2
- It’s a Small World – 29 minutes, up 6
- Under the Sea ~ Journey of the Little Mermaid – 28 minutes, up 6
- Enchanted Tales with Belle – 27 minutes, no change
- The Barnstormer – 22 minutes, up 5
- Dumbo the Flying Elephant – 21 minutes, up 5
- Mickey’s PhilharMagic – 18 minutes, no change
- The Magic Carpets of Aladdin – 17 minutes, up 2
- Monsters, Inc. Laugh Floor – 16 minutes, no change
- Mad Tea Party – 14 minutes, up 1
- Prince Charming Regal Carrousel – 14 minutes, up 3
- Tomorrowland Speedway – 14 minutes, no change
- Walt Disney World Railroad – 13 minutes, down 4
- Tomorrowland Transit Authority PeopleMover – 12 minutes, up 2
- Walt Disney’s Carousel of Progress – 5 minutes, no change
Final Thoughts
Overall, Magic Kingdom guests stood in line for an average of 29 minutes, which is three minutes more than last time.
So, all four parks increased their average wait times slightly from last week.
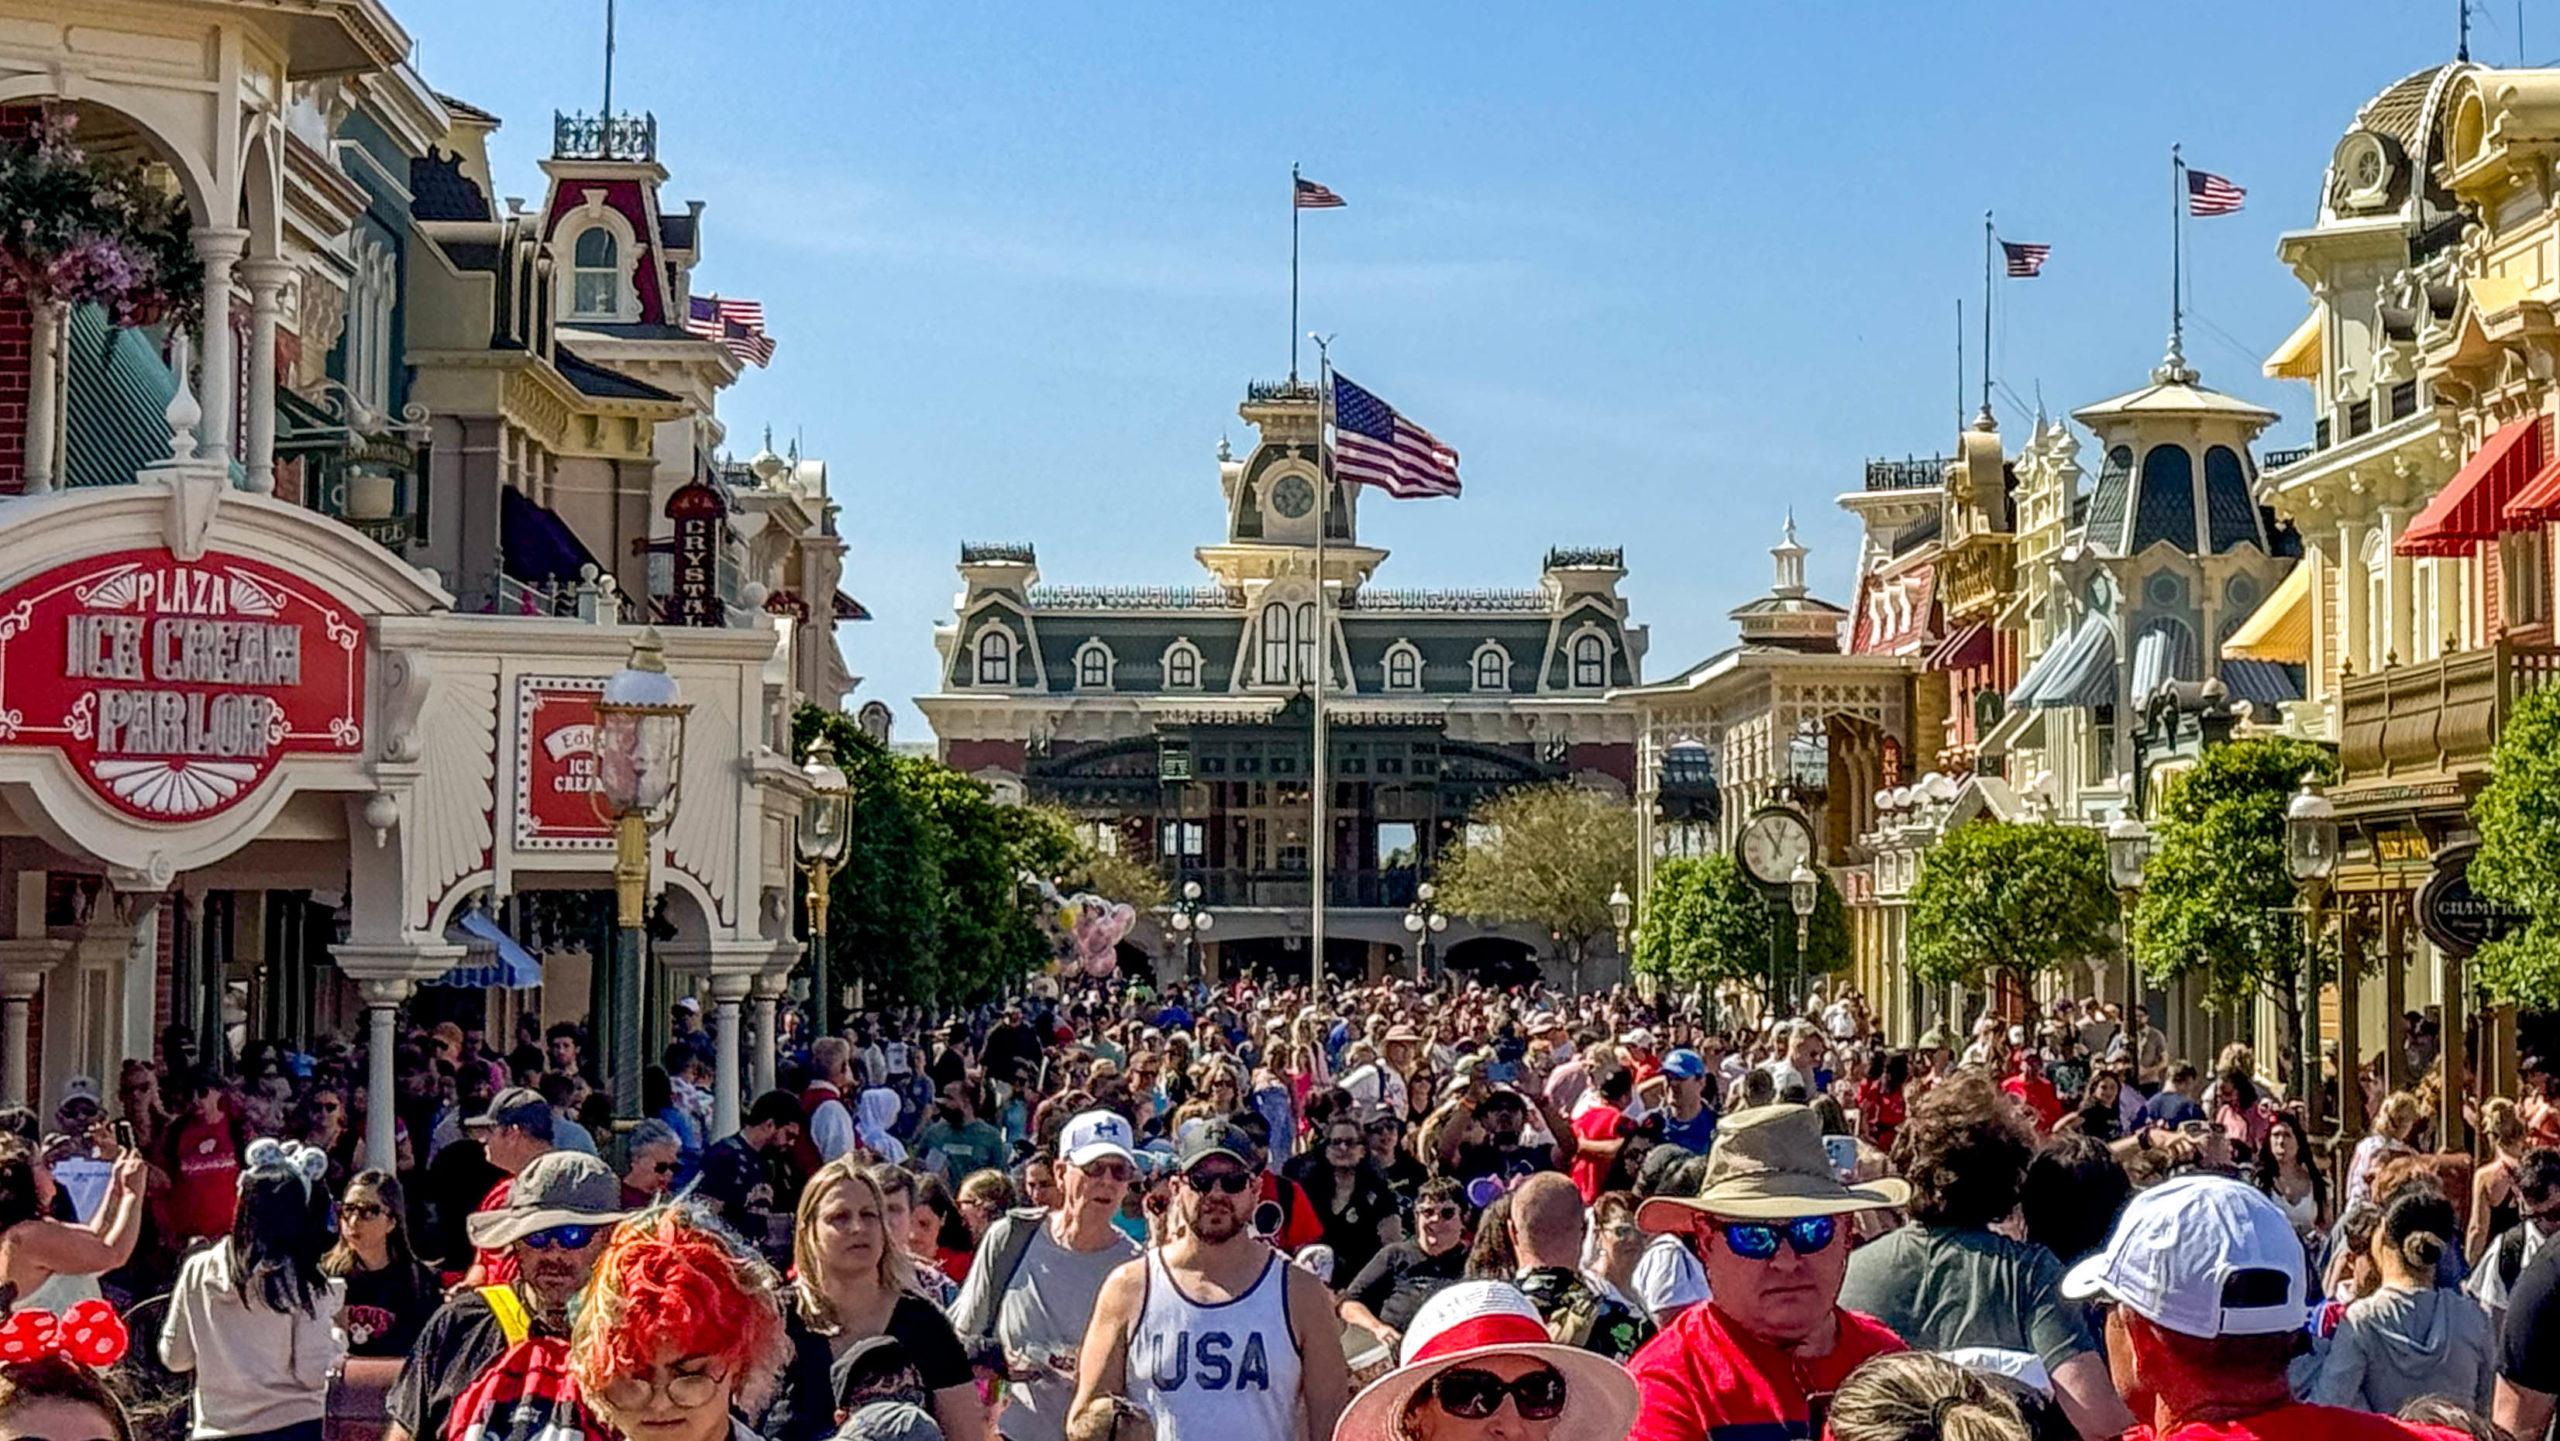
Crowds in Magic Kingdom
Most of the changes were modest in scope, but this May doesn’t appear to be as much “off-season” as expected.
![]()
Thanks for visiting MickeyBlog.com! Want to go to Disney? For a FREE quote on your next Disney vacation, please fill out the form below, and one of the agents from MickeyTravels, a Diamond Level Authorized Disney Vacation Planner, will be in touch soon!