Walt Disney World Wait Times for the Third Week of April 2024

We’re theoretically still in Walt Disney World’s busy season right now.
Realistically, the second half of April shouldn’t be crowded relative to what happens next, though.
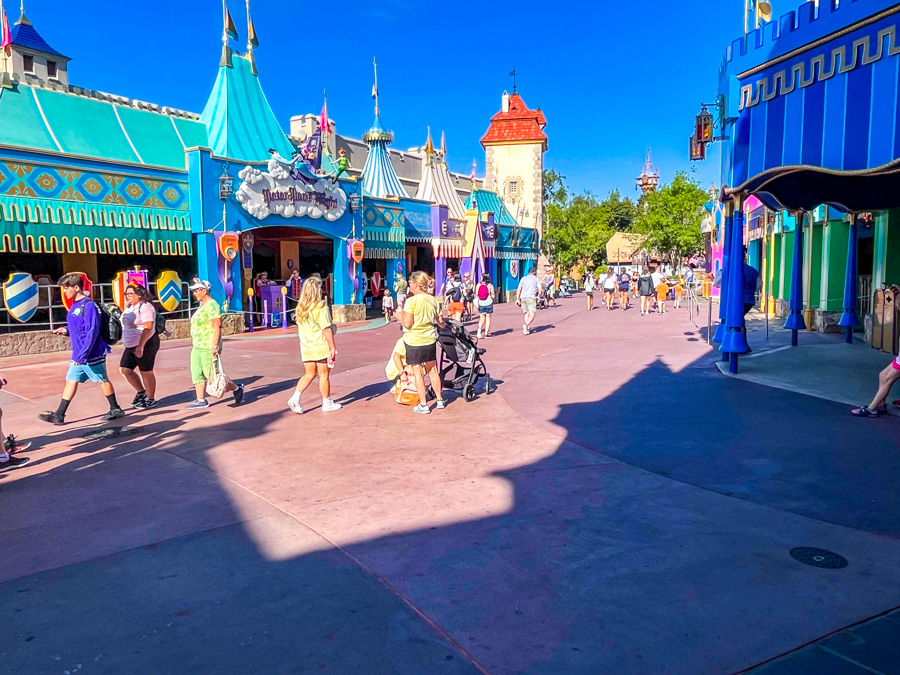
Magic Kingdom Low crowds
We’re in what I would describe as the calm before the storm.
In recent years, the six weeks starting with Memorial Day should be among the busiest from now until Thanksgiving.
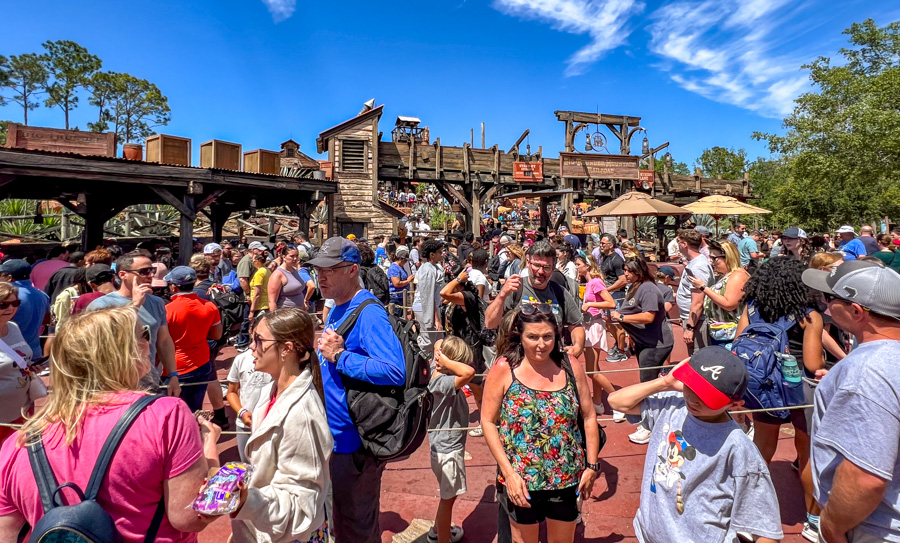
Magic Kingdom Spring Break crowds
So, you should enjoy the current crowds while the last. Alas, we still have some weekly fluctuation.
Were the crowds larger last week than the previous one?
Let’s find out the average Walt Disney World wait times for the third week of April 2024.
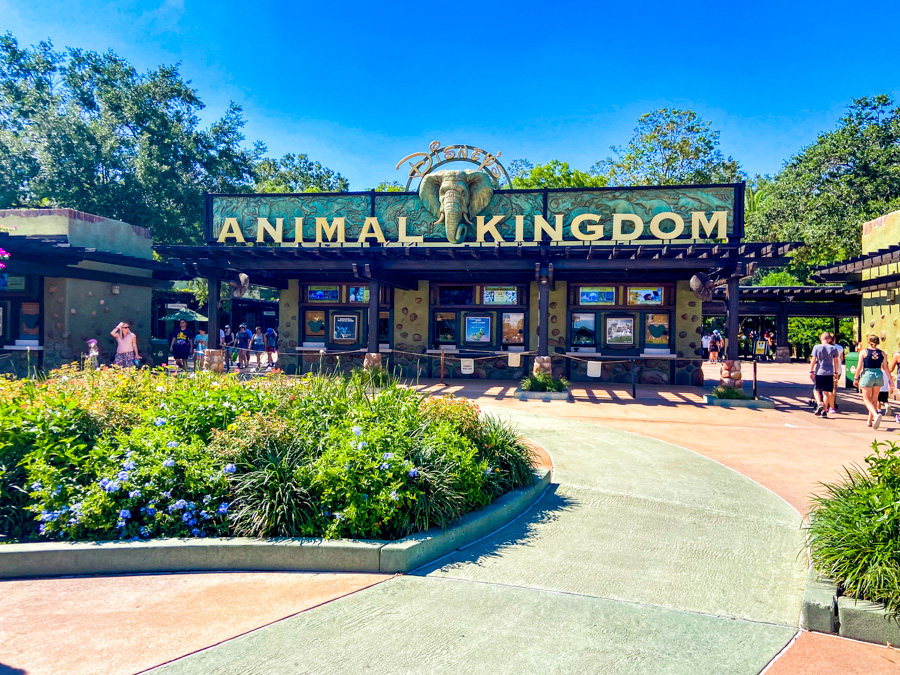
Disney’s Animal Kingdom
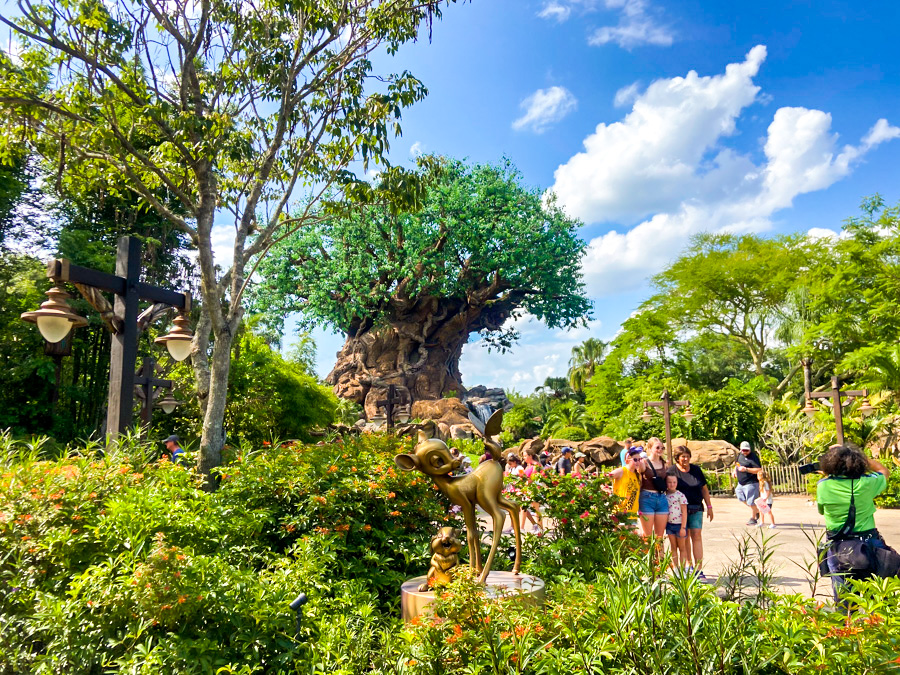
Animal Kingdom
As mentioned, I realize everyone expects smaller crowds at this time of year.
However, based on Disney ticket pricing and Disney Vacation Club Points Charts, that’s not necessarily the case.
Park officials have priced the second half of April as if it’s a popular visitation time, even by Disney World standards.
How did this impact the parks? Let’s find out by evaluating the average attraction wait times at Animal Kingdom:
- Avatar Flight of Passage – 88 minutes, up 4
- Na’vi River Journey – 57 minutes, up 1
- Adventurers Outpost – 50 minutes, up 5
- Kilimanjaro Safaris – 37 minutes, up 6
- Kali River Rapids – 36 minutes, up 12
- Expedition Everest – 31 minutes, down 2
- DINOSAUR – 22 minutes, up 2
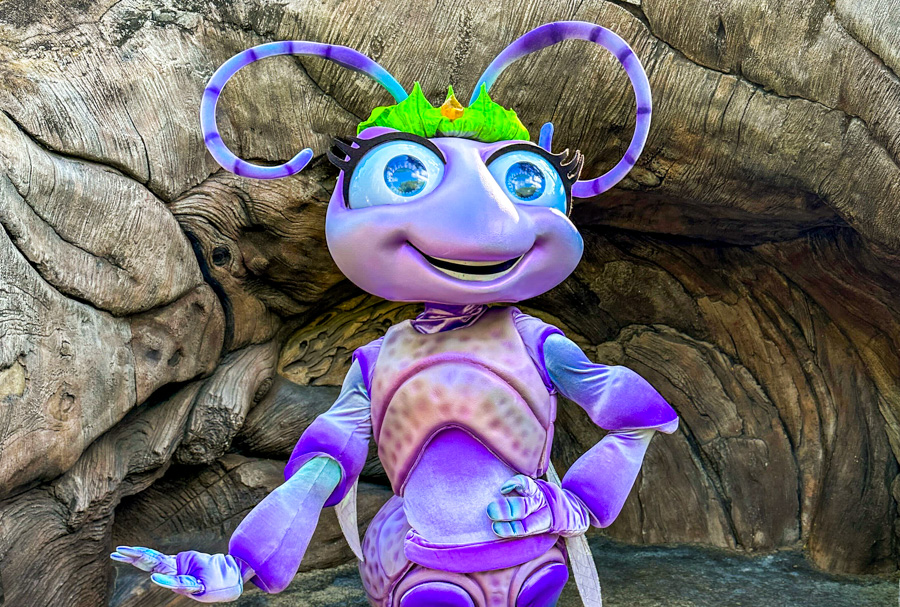
- It’s Tough to Be a Bug! – 10 minutes, no change
- TriceraTop Spin – 9 minutes, down 1
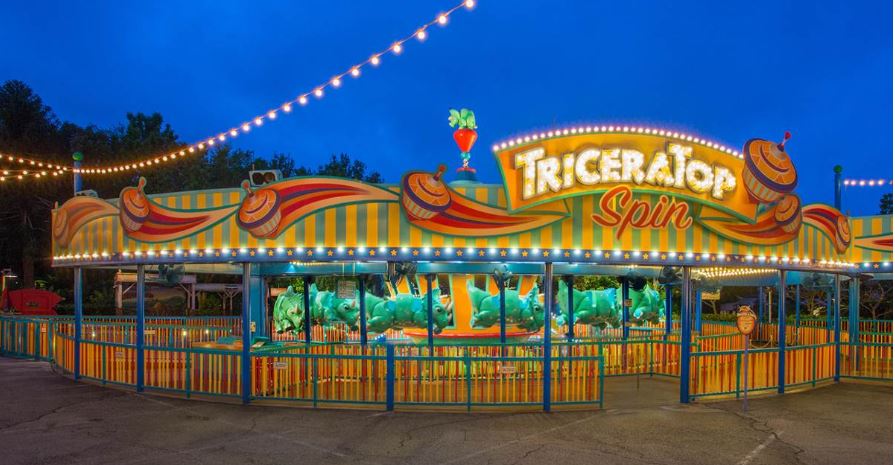
Photo: Disney
Overall, park guests stood in line for an average of 38 minutes, three more than last time.
Also, based on the anecdotal evidence I’ve been hearing from people, this is exactly what I expected this week.
So far, we’re tracking a modest uptick, but we can explain some of it at Animal Kingdom due to the weather.
Kali River Rapids lines always grow longer as the temperature increases.

Since we had near-record highs in Orlando over the weekend, the wet ride became more popular as the week advanced.
Disney’s Hollywood Studios
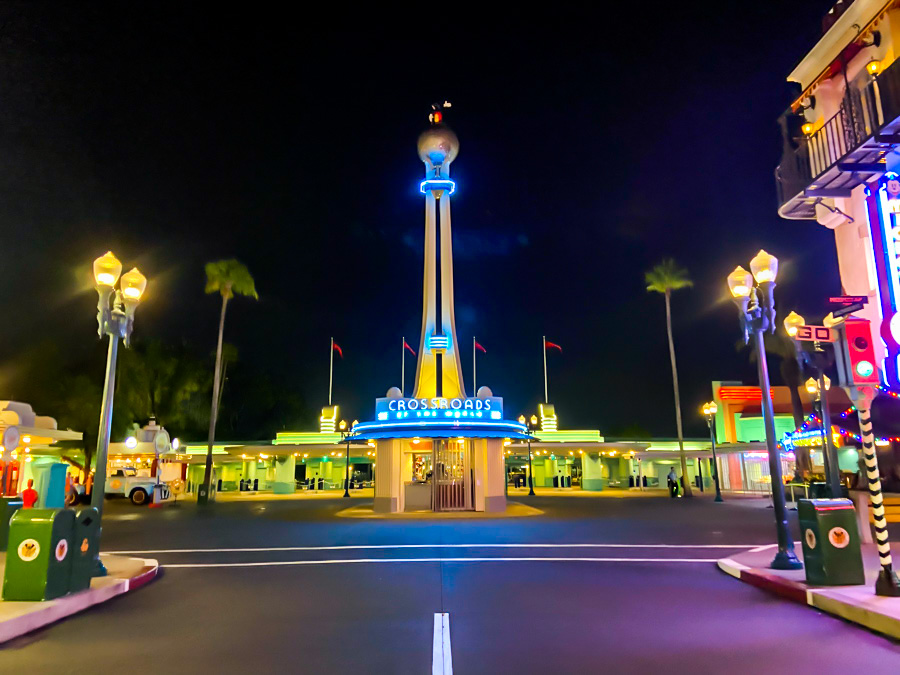
Currently, Hollywood Studios is the only Walt Disney World park that isn’t in the process of creating a new/updated attraction.
For this reason, the wait times we track here should remain steady for a while, fluctuating primarily due to the calendar.
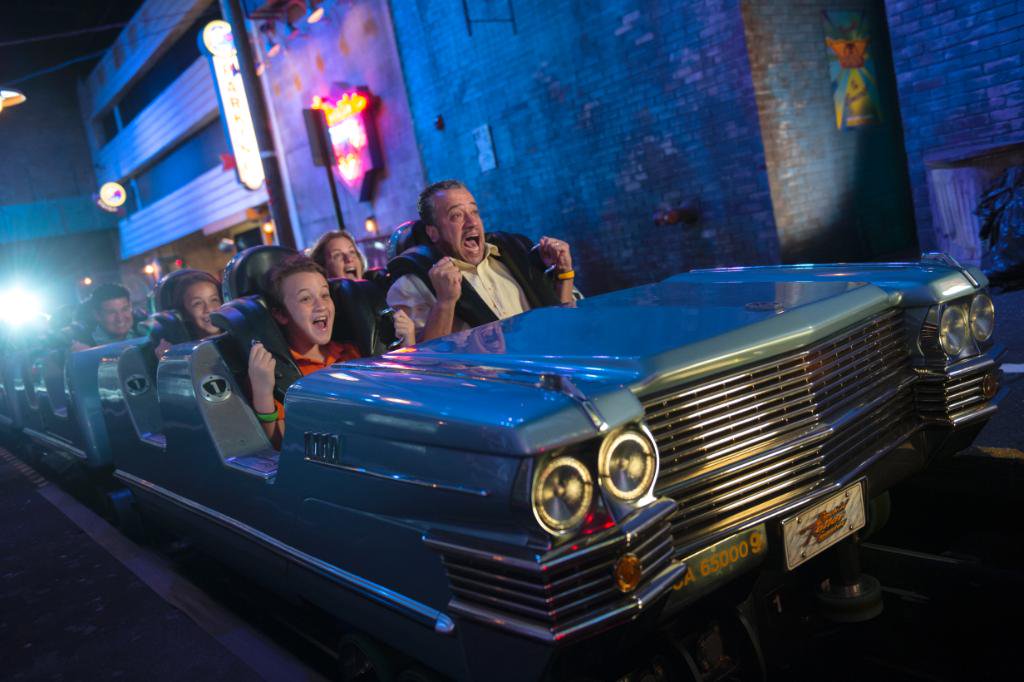
Image: Disney
The only exceptions should be when attractions suffer downtime and, as a reminder, that situation should get better, not worse.
Remember that Rock ‘n’ Roller Coaster Starring Aerosmith remains down for refurbishment.
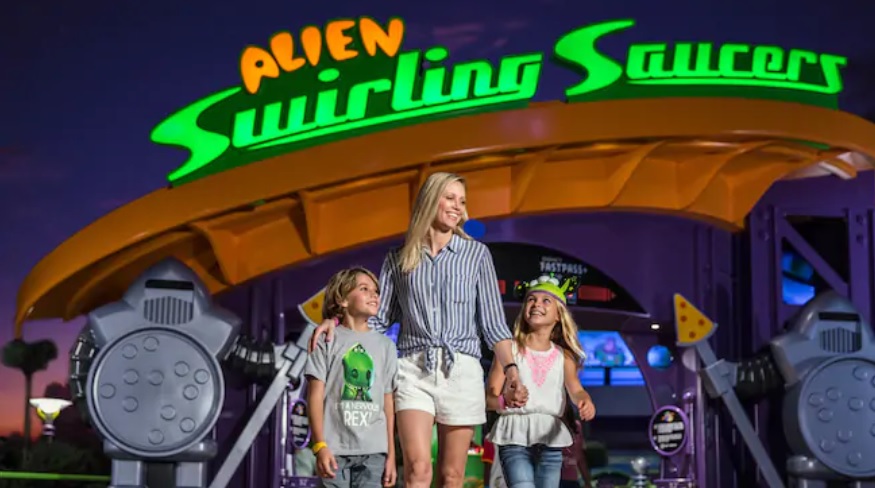
Photo: Disney
When that ride returns, overall wait times will steady a bit.
So, let’s baseline the park by listing its average wait times for the past week:
- Slinky Dog Dash – 83 minutes, down 30
- Star Wars: Rise of the Resistance – 76 minutes, down 2
- Millennium Falcon: Smugglers Run – 62 minutes, down 31
- Twilight Zone Tower of Terror – 61 minutes, up 8
- Mickey & Minnie’s Runaway Railway – 56 minutes, down 7
- Toy Story Mania! – 54 minutes, down 14
- Red Carpet Dreams – 39 minutes, up 6
- Alien Swirling Saucers – 36 minutes, up 8
- Celebrity Spotlight – 20 minutes, down 8
- Star Tours – The Adventures Continue! – 18 minutes, down 8
- Lightning McQueen’s Racing Academy – 15 minutes, no change
- Muppet*Vision 3D – 10 minutes, no change
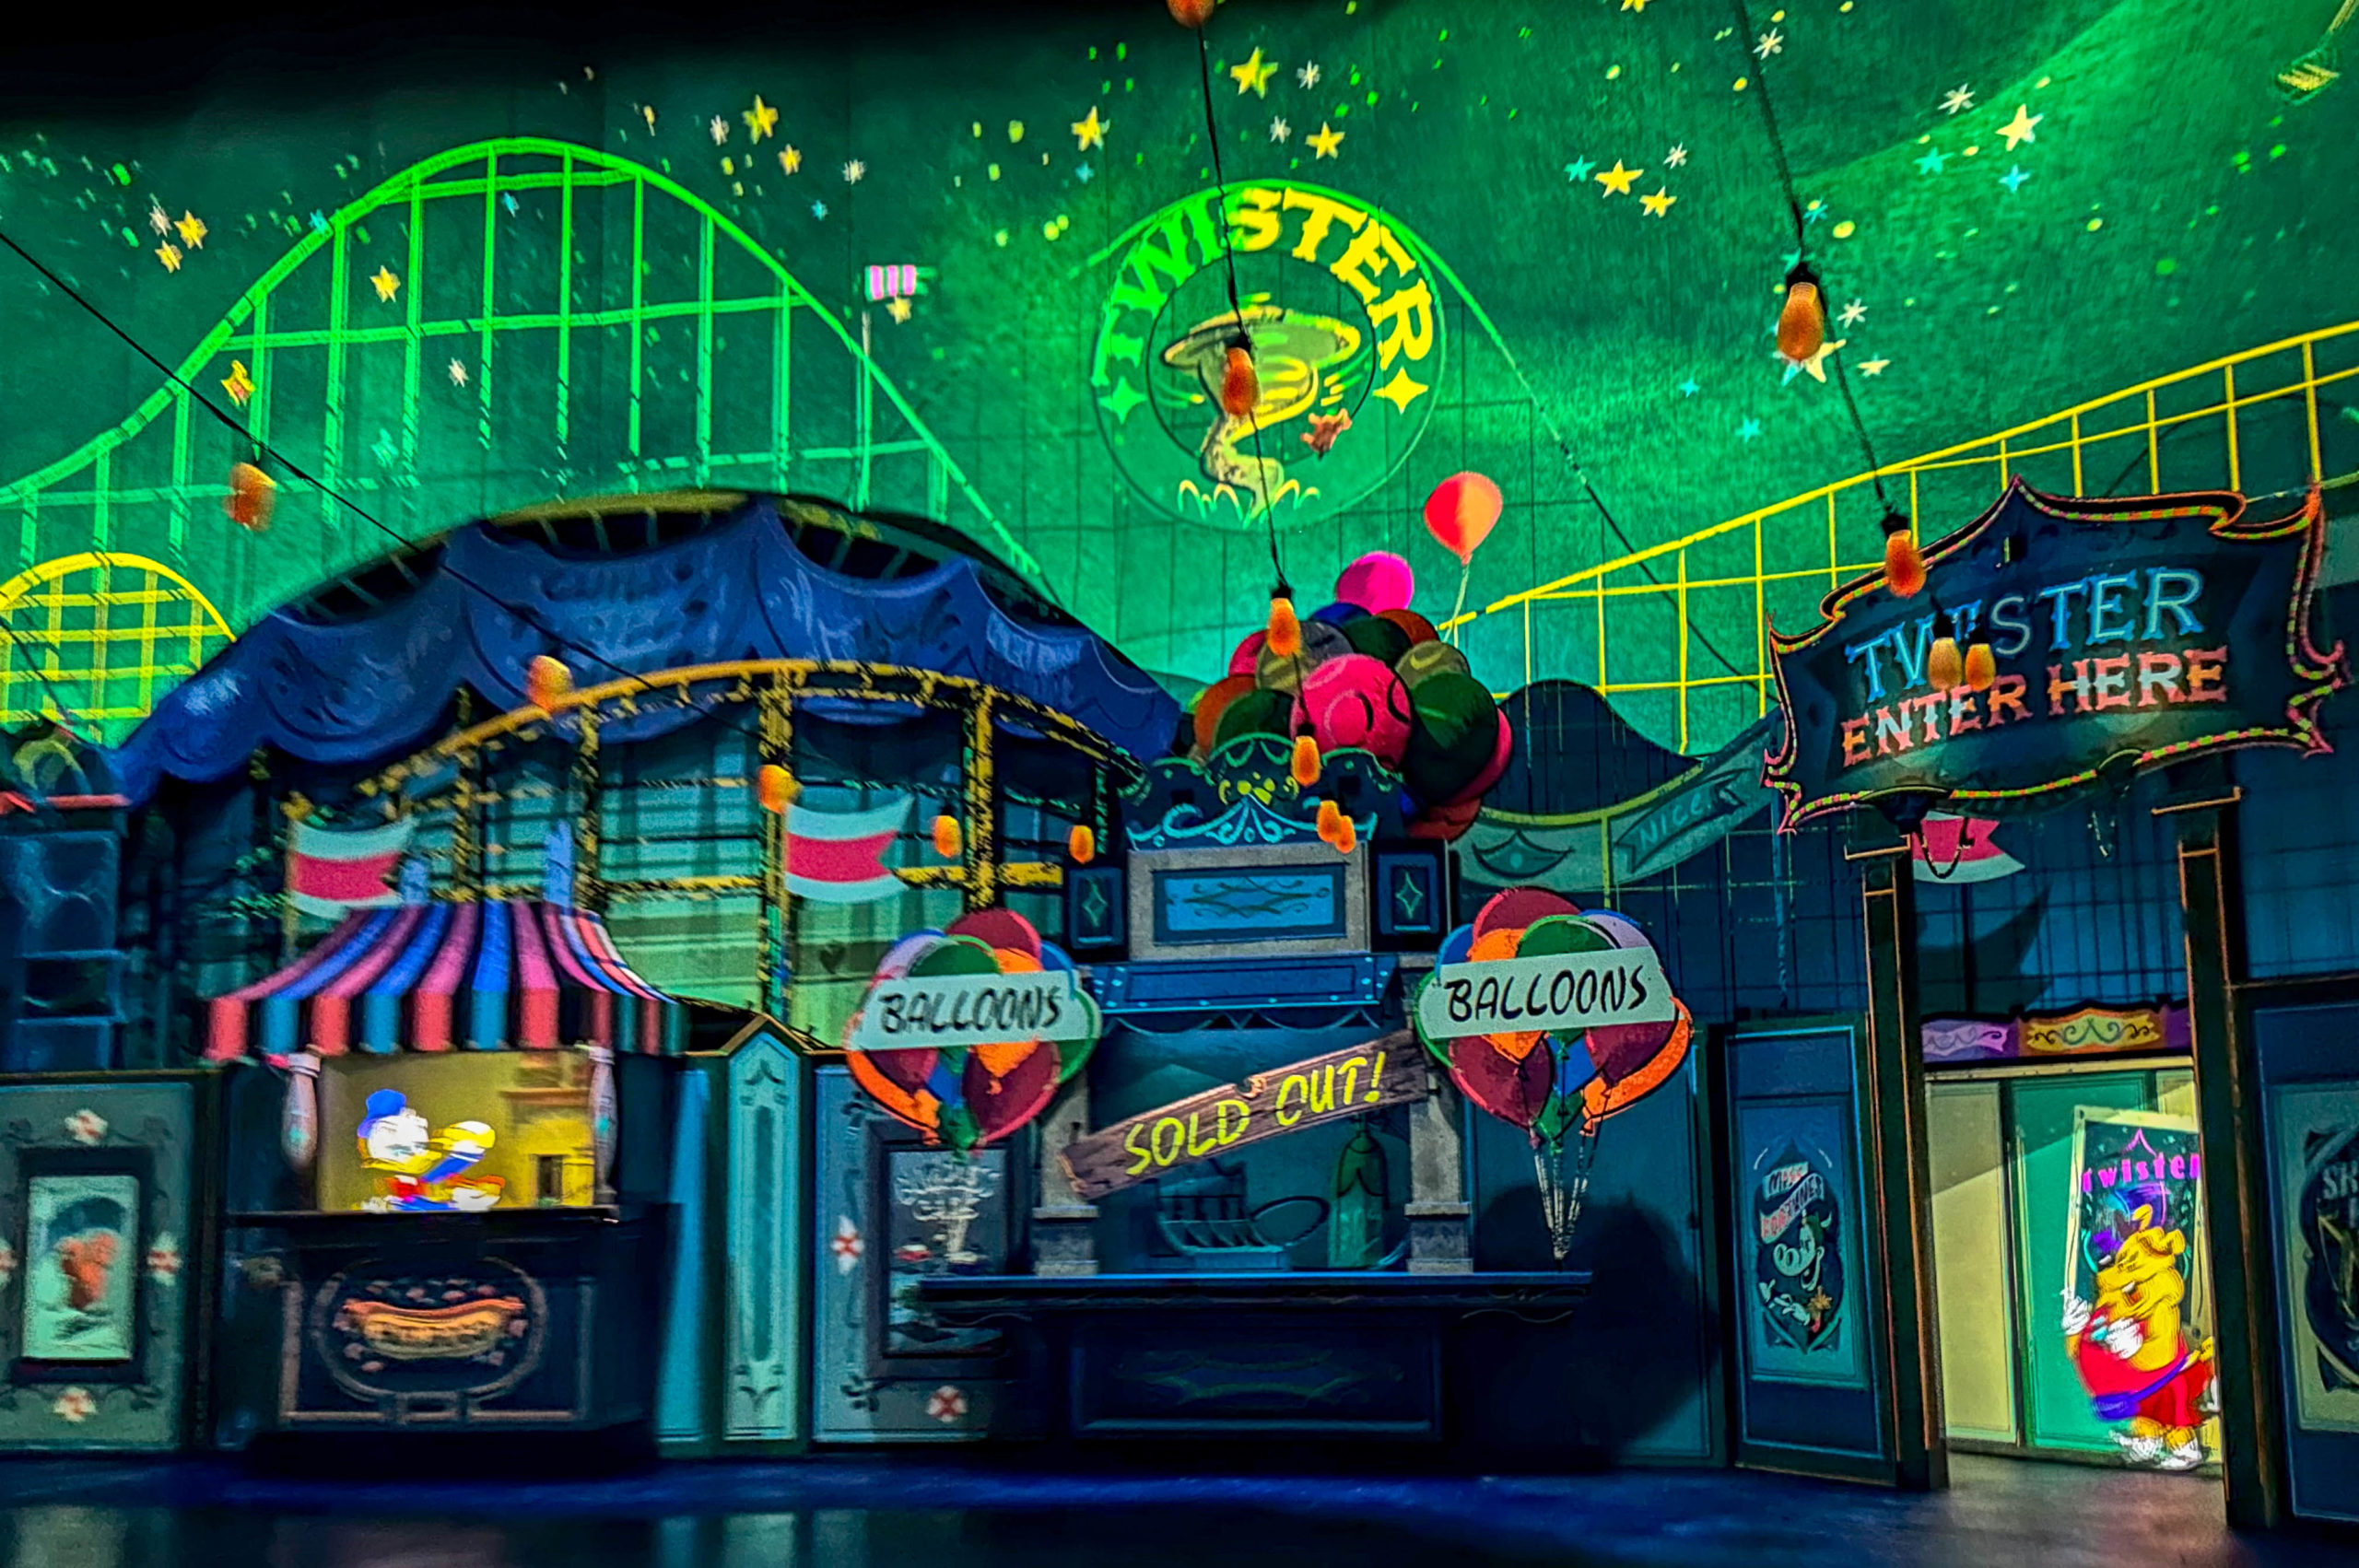
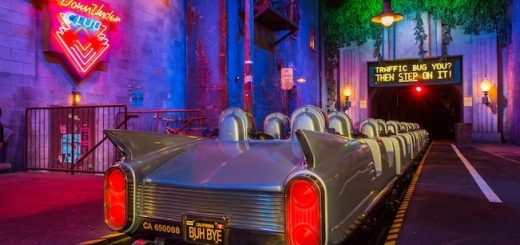
Carnival scene
Overall, Hollywood Studios guests waited for an average of 40 minutes per attraction, which is two minutes less than usual.
The data suggests that Hollywood Studios has had some uptime issues with a couple of high-profile attractions.
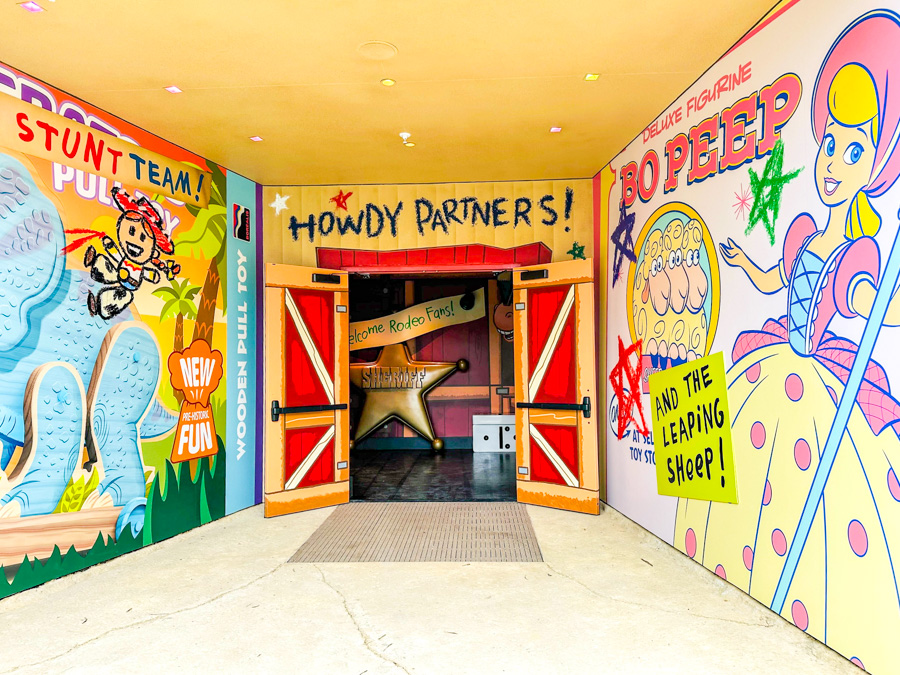
Let’s go inside!
The numbers go down when the rides run smoothly.
EPCOT
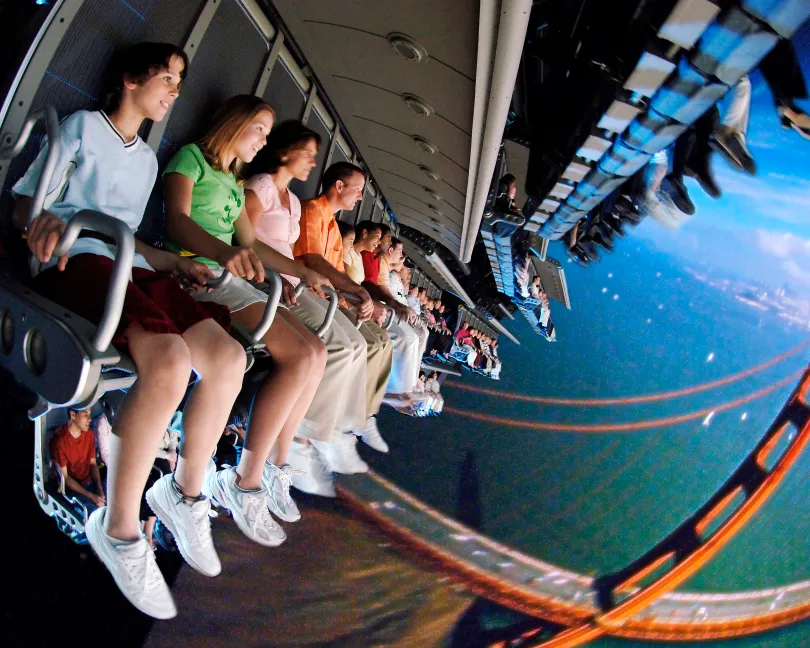
Photo: Disney
Thus far, most attractions are up a bit this week, while a couple have dropped dramatically.
How was the behavior at EPCOT? Here are the park’s average wait times last week:
- Frozen Ever After – 71 minutes, down 1
- Remy’s Ratatouille Adventure – 67 minutes, down 2
- Test Track – 60 minutes, down 3
- Mission: SPACE – 41 minutes, down 3
- Soarin’ Around the World – 40 minutes, up 1
- Royal Sommerhus – 34 minutes, down 1
- Turtle Talk with Crush – 18 minutes, no change
- Spaceship Earth – 17 minutes, up 1
- Journey into Imagination with Figment – 15 minutes, up 1
- The Seas with Nemo & Friends – 14 minutes, up 1
- Gran Fiesta Tour Starring the Three Caballeros – 12 minutes, up 1
- Living with the Land – 12 minutes, no change
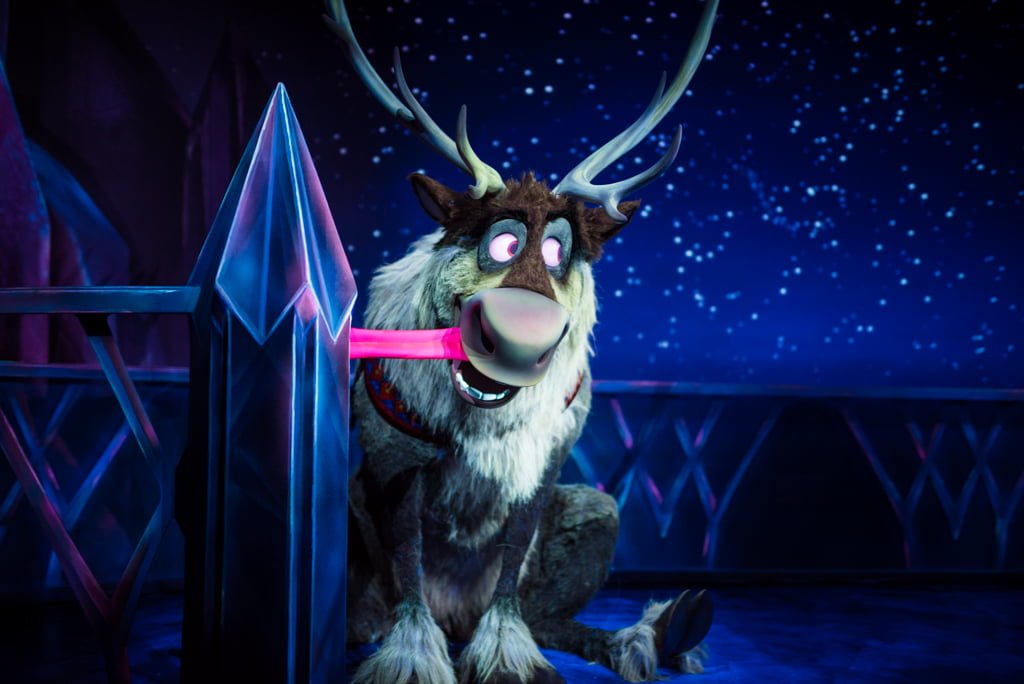
Photo: Disney
Overall, the average EPCOT attraction came with a wait time of 32 minutes, which is one minute less than last time.
Magic Kingdom
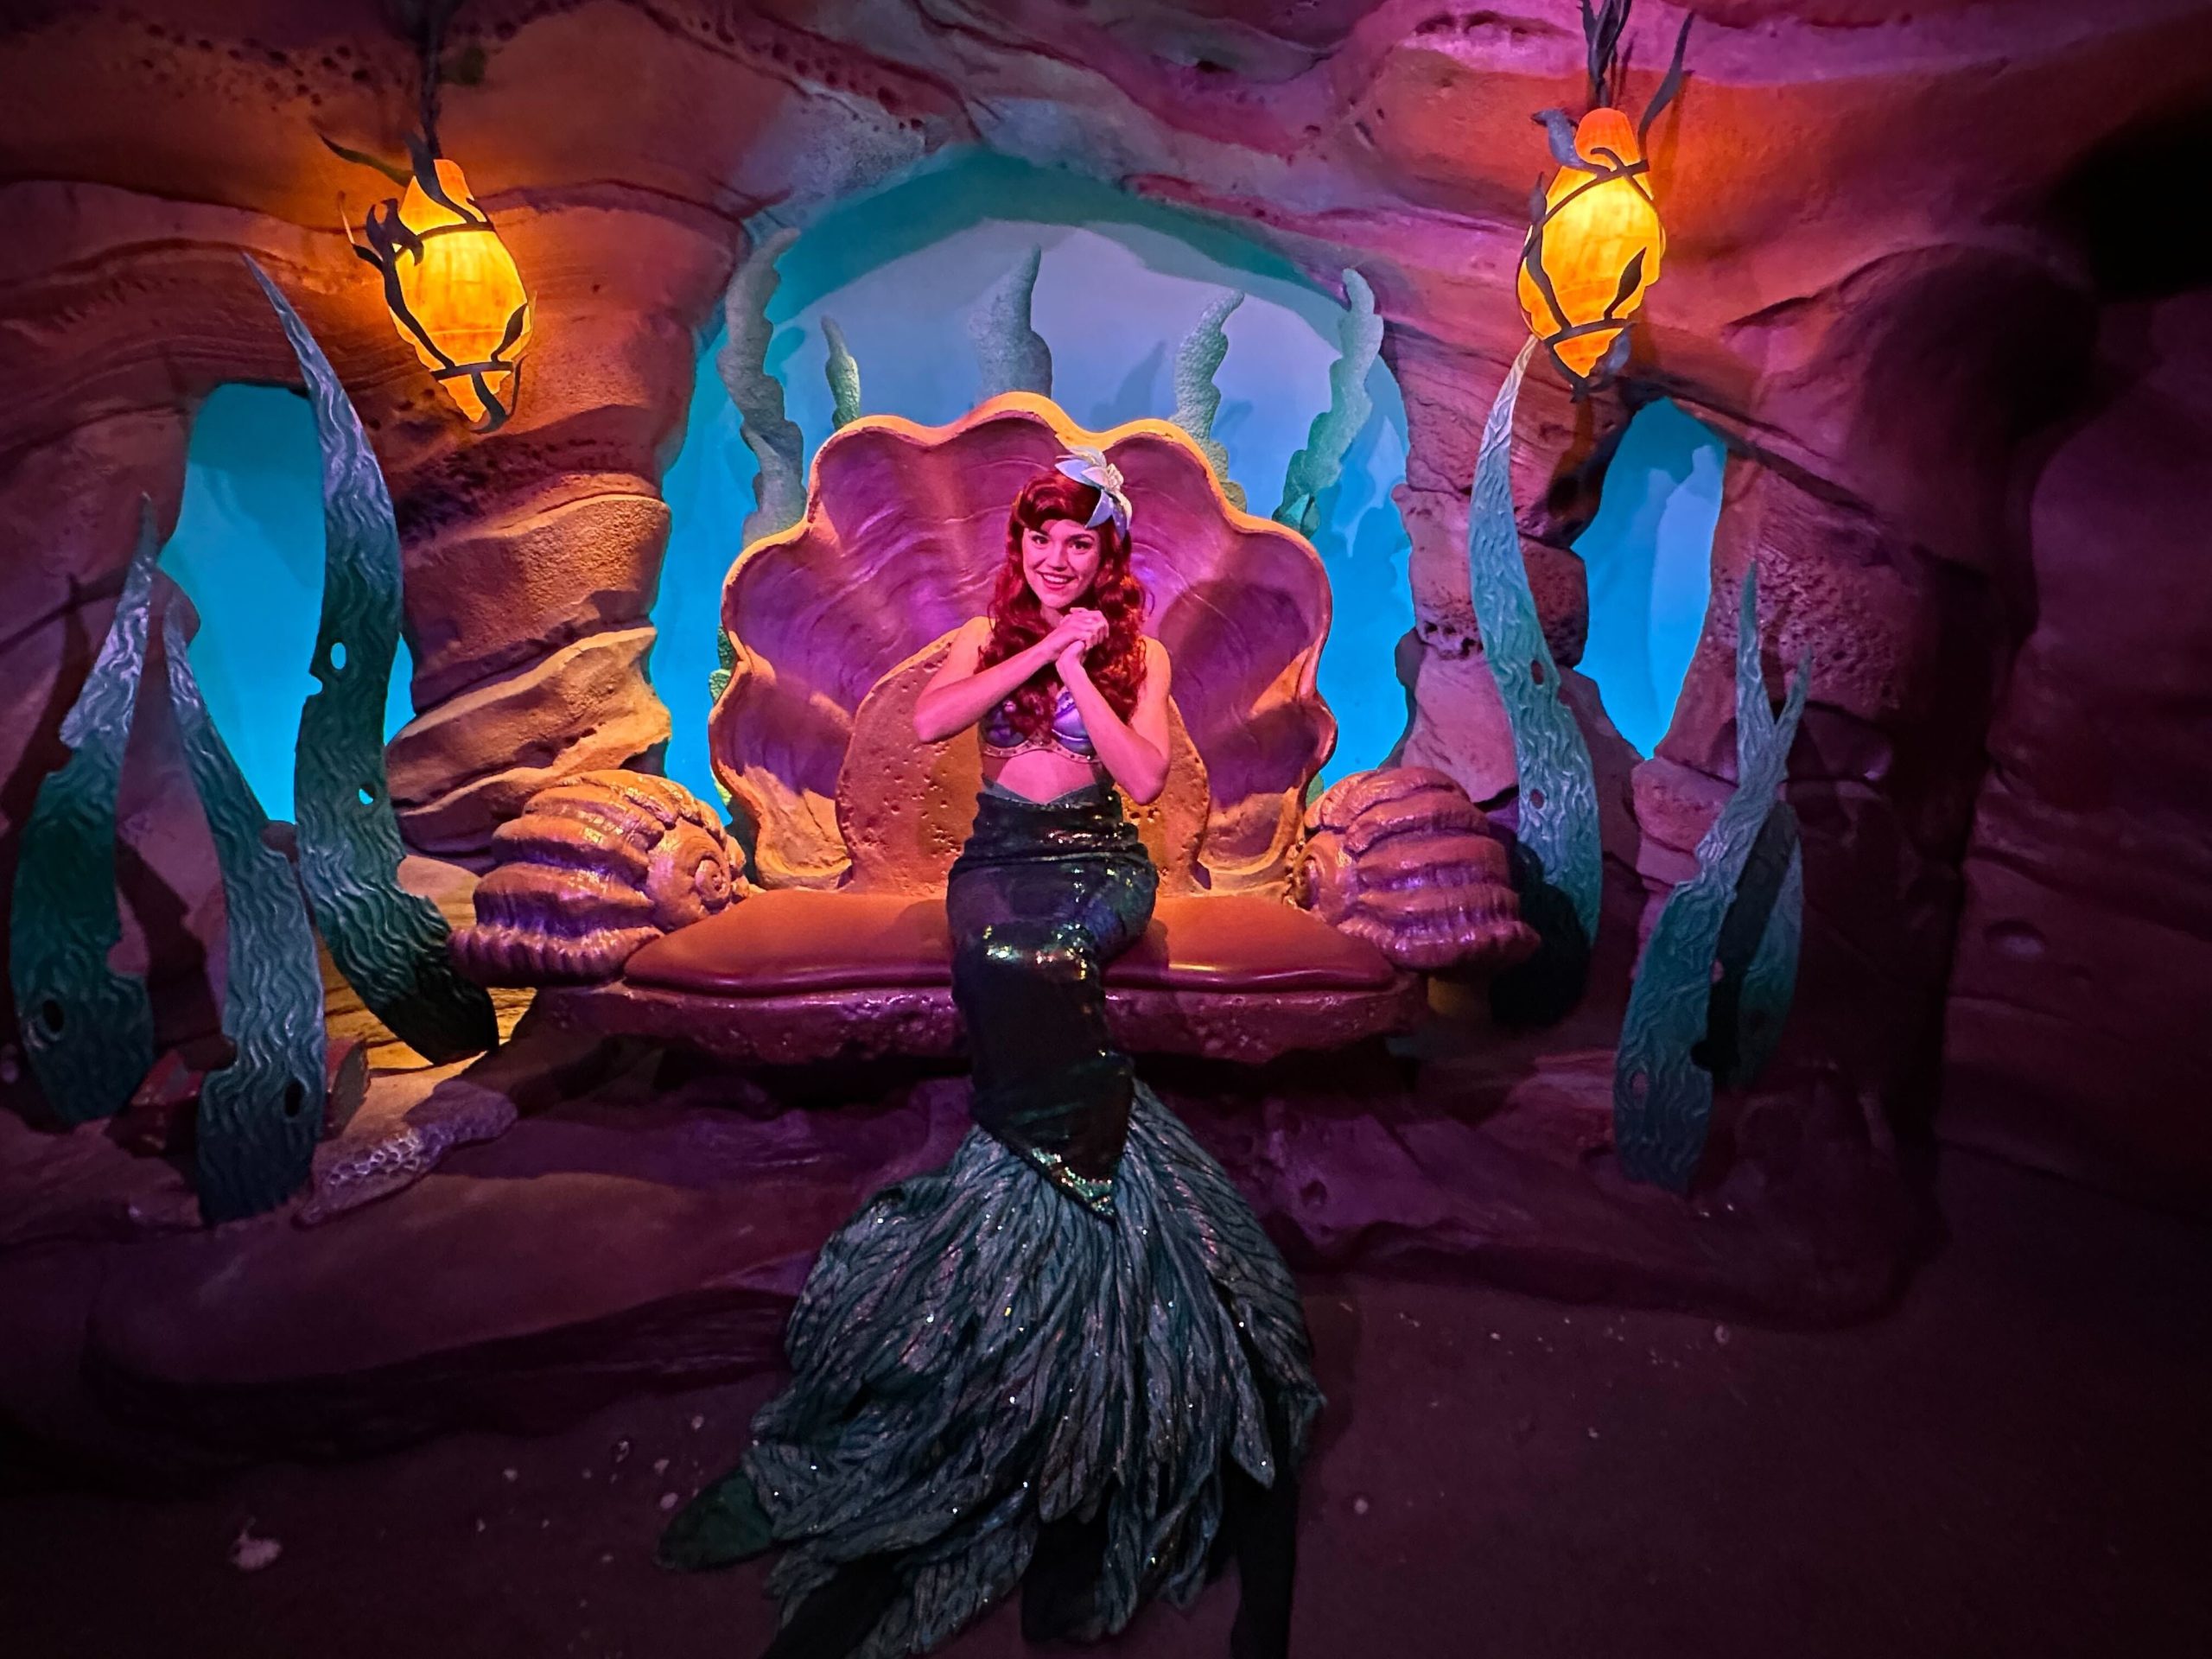
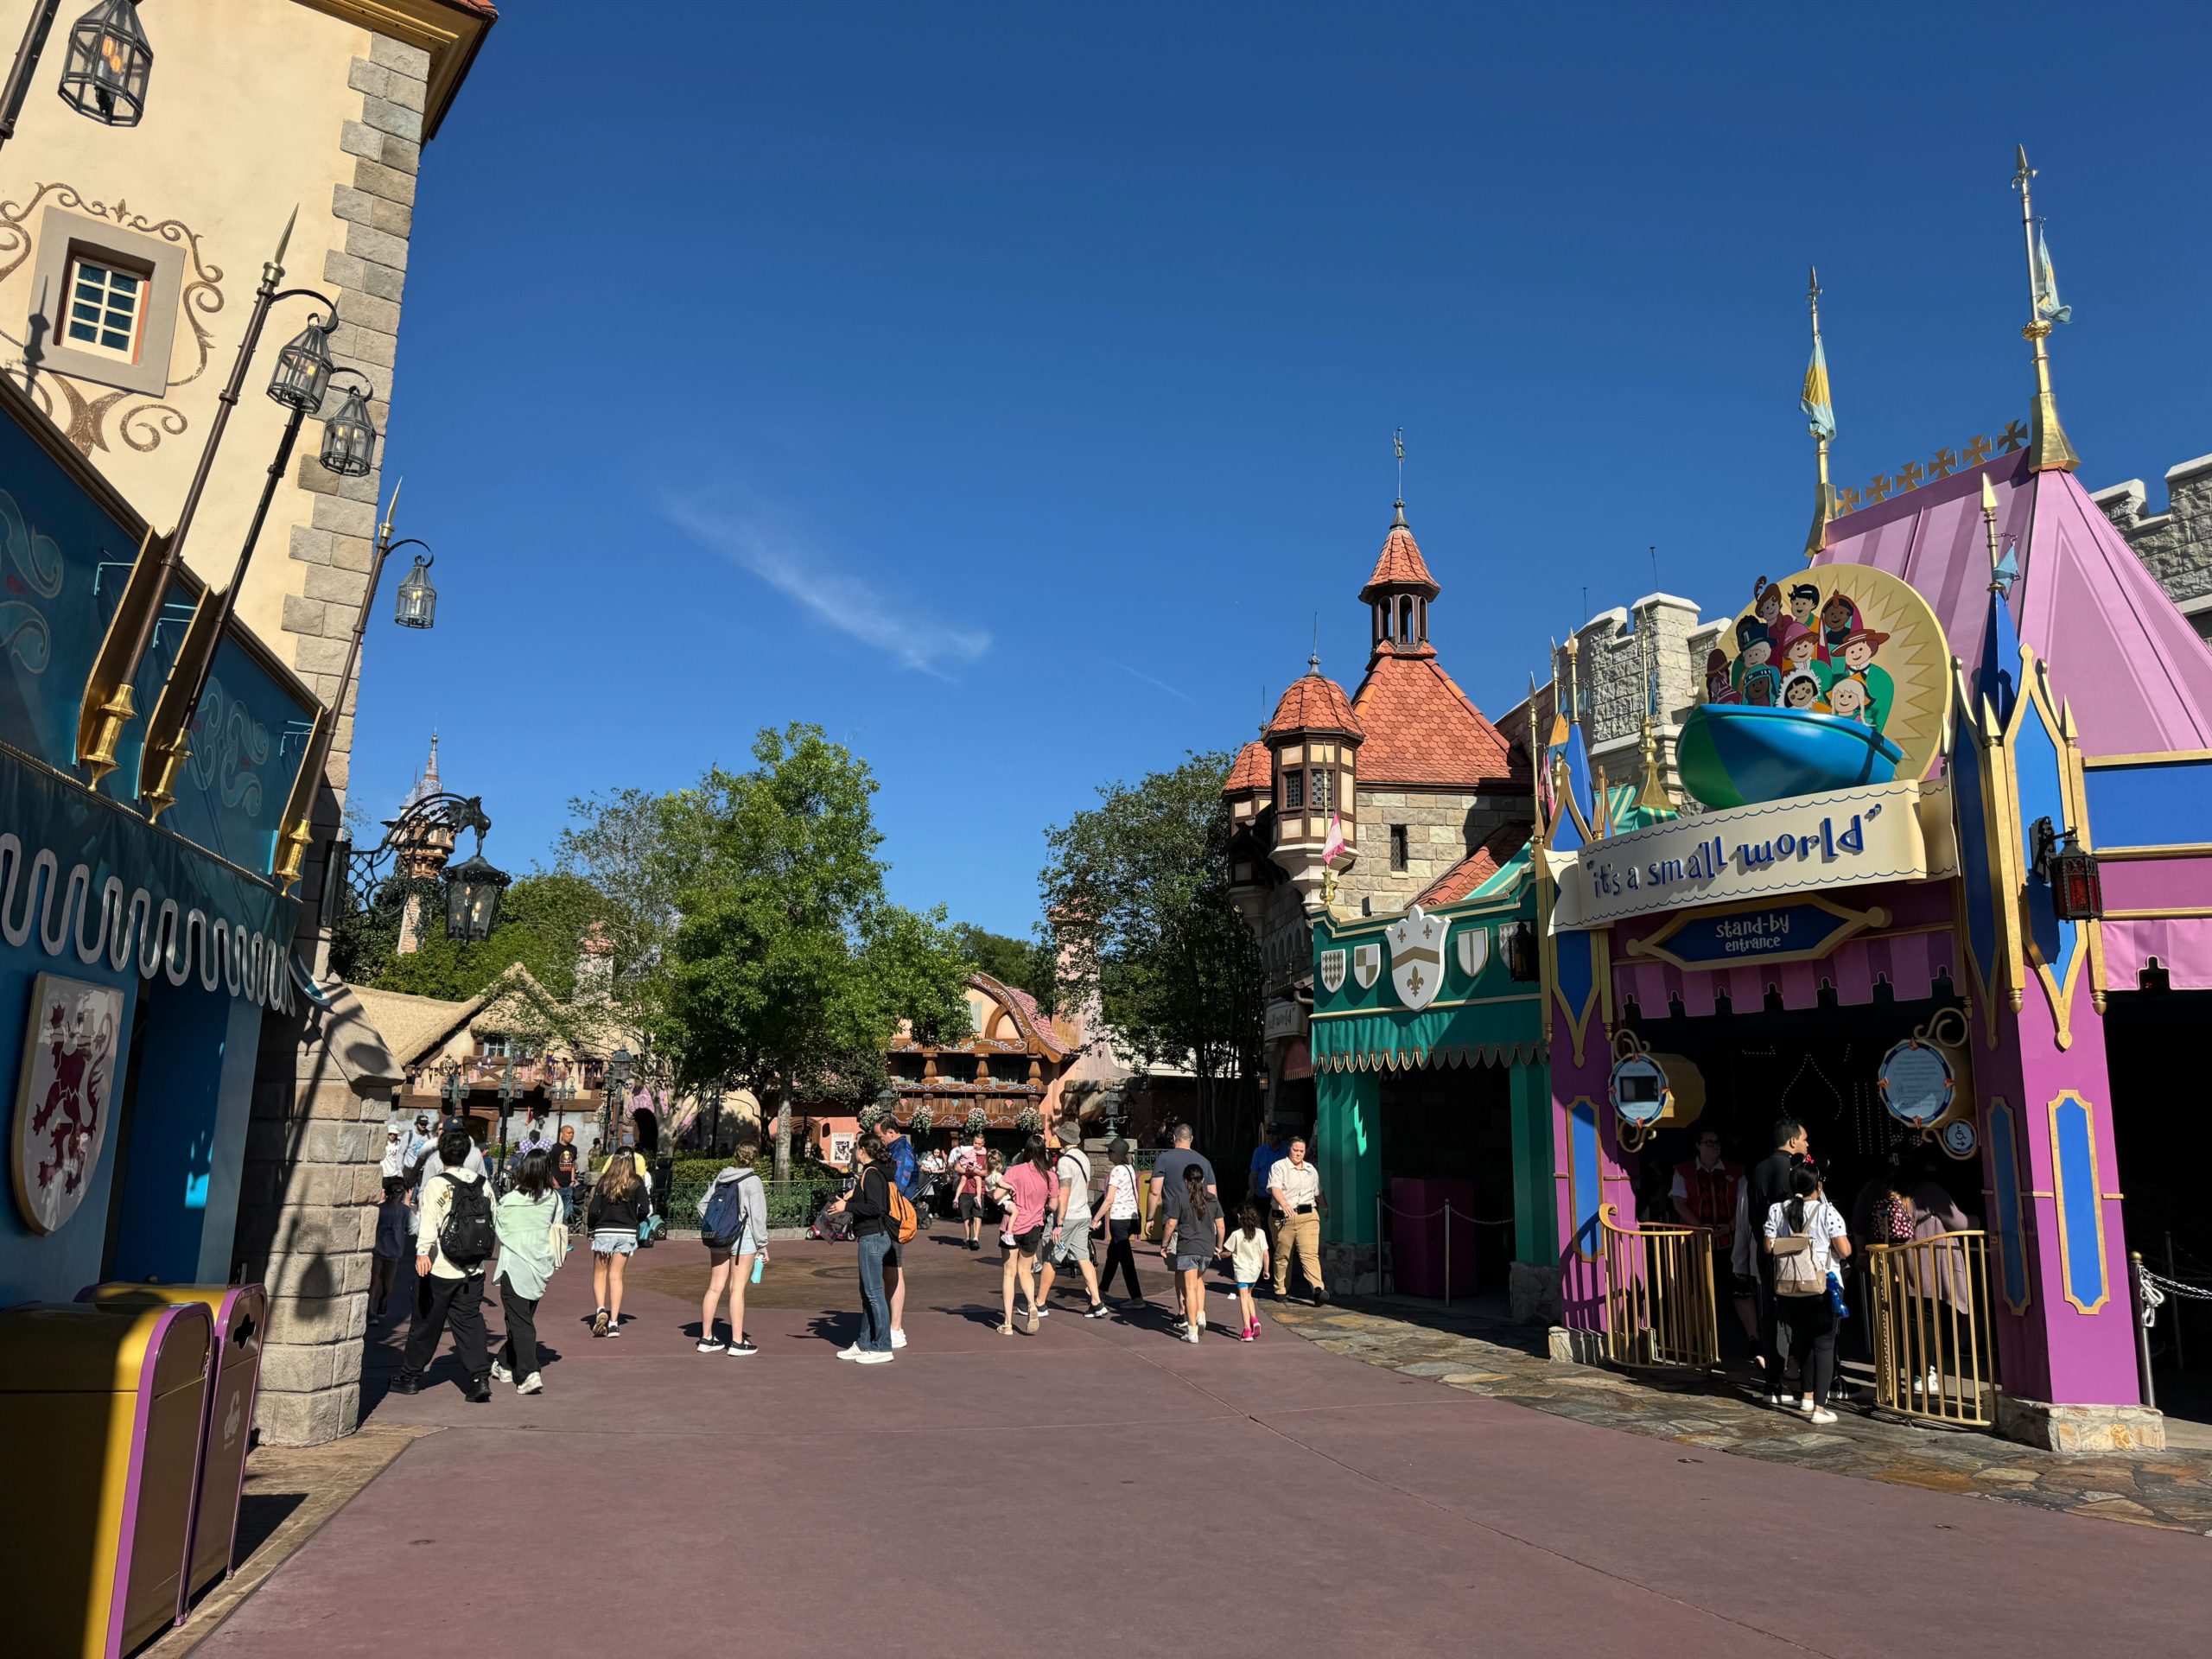
Ariel’s Grotto
Thus far, the parks have fluctuated modestly, but they align with the previous week’s data.
Was that the case at Magic Kingdom? Let’s check the average wait times at the park last week:
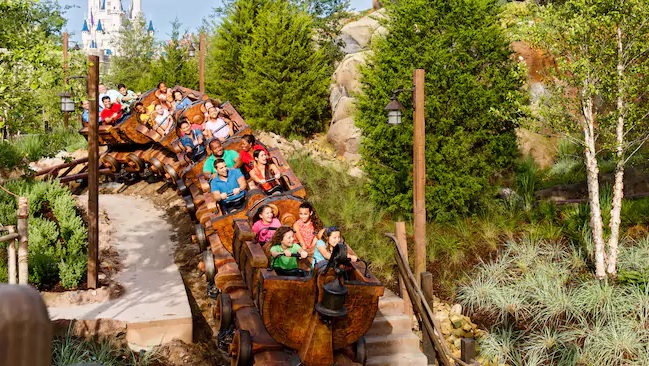
- Seven Dwarfs Mine Train – 69 minutes, down 1
- Peter Pan’s Flight – 57 minutes, down 4
- Jungle Cruise – 53 minutes, down 2
- Space Mountain – 48 minutes, no change
- Ariel’s Grotto – 39 minutes, down 2
- Haunted Mansion – 39 minutes, no change
- Princess Fairytale Hall – 39 minutes, up 1
- The Many Adventures of Winnie the Pooh – 37 minutes, up 1
- Town Square Theater – 37 minutes, down 2
- Buzz Lightyear’s Space Ranger Spin – 34 minutes, no change
- Big Thunder Mountain Railroad – 33 minutes, down 2
- Pete’s Silly Sideshow – 33 minutes, down 1
- Astro Orbiter – 29 minutes, down 1
- Pirates of the Caribbean – 28 minutes, up 3
- Enchanted Tales with Belle – 26 minutes, down 2
- It’s a Small World – 24 minutes, down 3
- Under the Sea ~ Journey of the Little Mermaid – 21 minutes, down 2
- The Barnstormer – 20 minutes, down 2
- Dumbo the Flying Elephant – 18 minutes, down 3
- Mickey’s PhilharMagic – 17 minutes, down 1
- The Magic Carpets of Aladdin – 16 minutes, down 4
- Prince Charming Regal Carrousel – 15 minutes, down 1
- Mad Tea Party – 14 minutes, no change
- Monsters, Inc. Laugh Floor – 14 minutes, up 1
- Tomorrowland Speedway – 14 minutes, down 4
- Tomorrowland Transit Authority PeopleMover – 13 minutes, no change
- Walt Disney World Railroad – 12 minutes, down 4
- Walt Disney’s Carousel of Progress – 5 minutes, no change
Final Thoughts
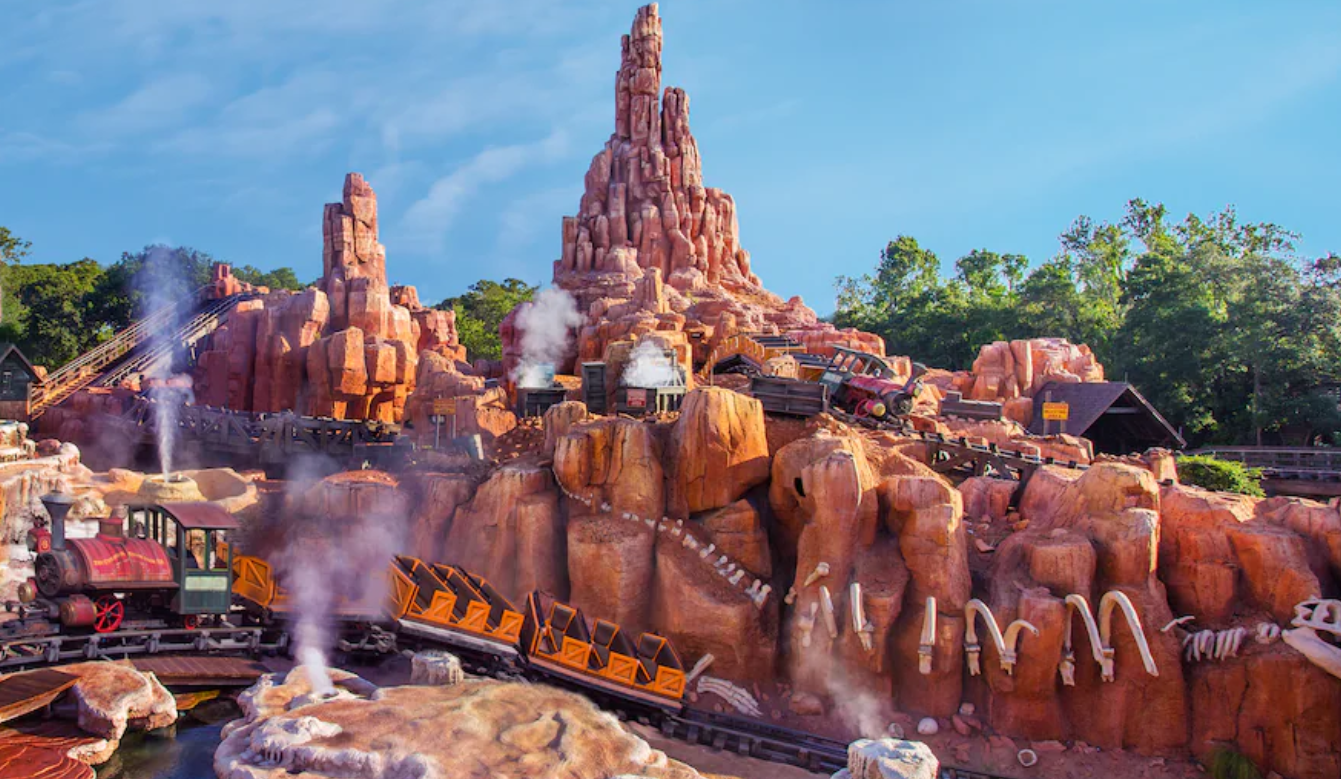
Photo: Disney
Overall, Magic Kingdom guests stood in line for an average of 26 minutes per attraction, one minute less than last time.
So, Disney’s pricing structure worked as intended. They controlled the attraction wait times so well that the parks generally stayed the same.
Credit: Disney
The average wait time dropped by one minute across four parks, or 0.25 minutes each.
That’s the kind of steady crowd control park officials want to see. It keeps the guests happy and the bank accounts overflowing.
MickeyBlog Logo
Thanks for visiting MickeyBlog.com! Want to go to Disney? For a FREE quote on your next Disney vacation, please fill out the form below, and one of the agents from MickeyTravels, a Diamond Level Authorized Disney Vacation Planner, will be in touch soon!