Walt Disney World Wait Times for Second Week of April 2024
Walt Disney World recently claimed one of its busiest months ever.
Due to the calendar configuration, it wasn’t the March crowds per se. Instead, it was bit odder.
People flocked to Orlando during the second week of March, with the crowds mostly staying the same through the first week of April.
Last week, we noticed an attendance dip as things returned to normal after Spring Break and Easter.
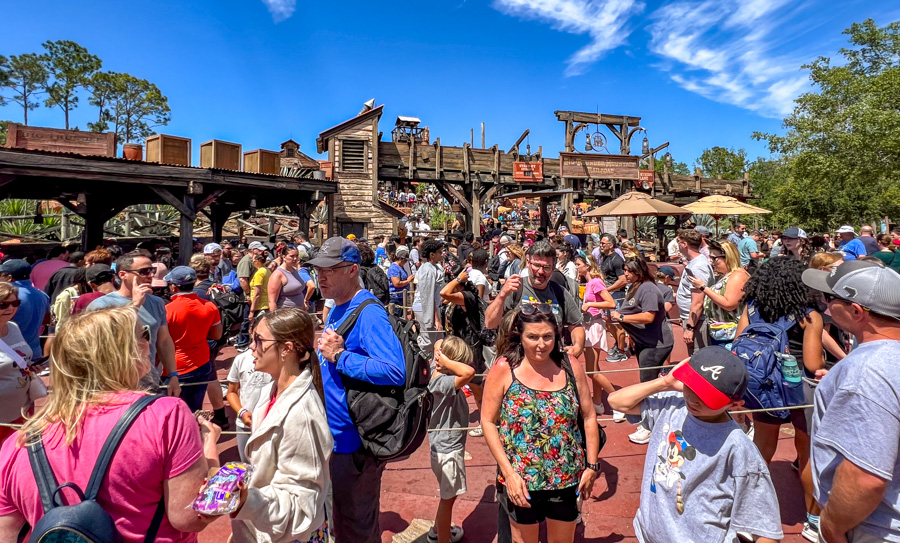
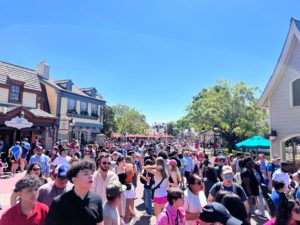
Magic Kingdom Spring Break crowds
How did this change impact the crowds? We’ll find out in the Walt Disney World wait times for the second week of April 2024.
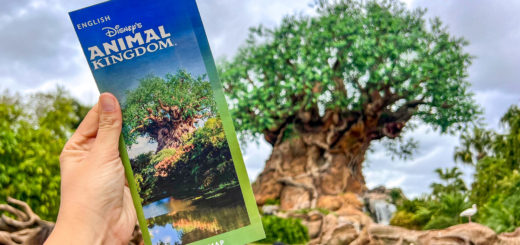
Disney’s Animal Kingdom

Photo: Disney
Okay, I attempt to remain unbiased with this data. So, I typically collect it but try not to peek.
This time, I went ahead and checked because the anecdotal information strongly hinted one way.

Credit: Disney
Sure enough, I’ll go ahead and tell you in advance that wait times at this park are waaaay down. Here are the numbers:
- Avatar Flight of Passage – 84 minutes, down 38
- Na’vi River Journey – 56 minutes, down 23
- Adventurers Outpost – 45 minutes, down 13
- Expedition Everest – 33 minutes, down 23
- Kilimanjaro Safaris – 31 minutes, down 23
- Kali River Rapids – 24 minutes, down 31
- DINOSAUR – 20 minutes, down 16
- It’s Tough to Be a Bug! – 10 minutes, down 5
- TriceraTop Spin – 10 minutes, down 9

Photo: Disney
So, almost all attractions dropped by at least nine minutes and, in many cases, substantially more.
Overall, the average line time at Animal Kingdom was 35 minutes per attraction, which is 20 minutes or 36 percent less than last time.
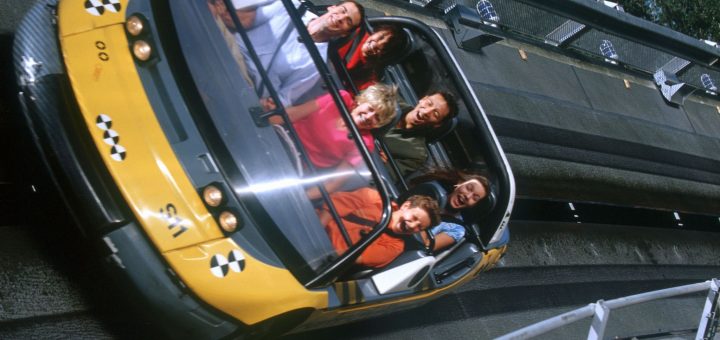
Disney’s Hollywood Studios
Were the other parks equally uncrowded last week?
We’ll find out quickly with the average wait times at Hollywood Studios:
- Slinky Dog Dash – 113 minutes, down 25
- Millennium Falcon: Smugglers Run – 93 minutes, down 22
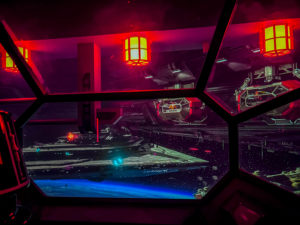
- Star Wars: Rise of the Resistance – 78 minutes, down 49
- Toy Story Mania! – 68 minutes, no change
- Mickey & Minnie’s Runaway Railway – 63 minutes, down 18
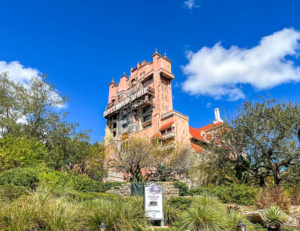
- Twilight Zone Tower of Terror – 53 minutes, down 32
- Red Carpet Dreams – 33 minutes, down 15
- Alien Swirling Saucers – 28 minutes, down 23
- Star Tours – The Adventures Continue! – 26 minutes, down 18
- Lightning McQueen’s Racing Academy – 15 minutes, no change
- Celebrity Spotlight – 13 minutes, down 16
- Muppet*Vision 3D – 10 minutes, no change
I should acknowledge one aspect of this data. Star Tours introduced new scenes on April 5th.
Typically, the wait time increases for several weeks afterward.
With the crowds down a sizable amount, we had two competing factors here. And the smaller crowds won.
Overall, guests waited for an average of 42 minutes, which is 15 minutes or 26 percent less than last time.
EPCOT
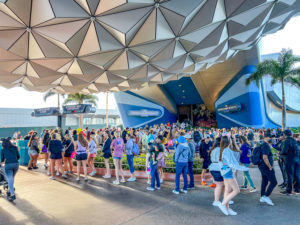
Spaceship Earth
I can confidently state that the wait times should be way down this week at this park.
During the previous week, EPCOT’s average attraction wait times were way high.

Photo: Disney
I reported what I had, but it seemed like a high reading. This week, I’m expecting normalcy to return. But did it?
Here are the average attraction wait times at EPCOT this past week:
- Frozen Ever After – 72 minutes, down 29
- Remy’s Ratatouille Adventure – 69 minutes, down 41
- Test Track – 63 minutes, down 27
- Mission: SPACE – 44 minutes, down 34
- Soarin’ Around the World – 39 minutes, down 29
- Royal Sommerhus – 35 minutes, down 9
- Turtle Talk with Crush – 18 minutes, down 4
- Spaceship Earth – 16 minutes, down 17
- Journey into Imagination with Figment – 14 minutes, down 10
- The Seas with Nemo & Friends – 13 minutes, down 13
- Living with the Land – 12 minutes, down 4
- Gran Fiesta Tour Starring the Three Caballeros – 11 minutes, down 7
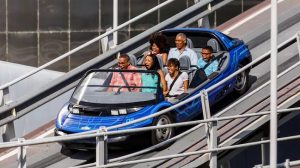
Image Credit: Disney
Overall, the average EPCOT attraction came with a wait of 33 minutes, which is 29 minutes or 53 percent less than last time.
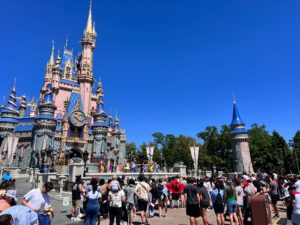
Magic Kingdom

Image Credit: Disney
Okay, the picture is clear at this point. So, here are Magic Kingdom’s average wait times for last week:
- Seven Dwarfs Mine Train – 70 minutes, down 32
- Peter Pan’s Flight – 61 minutes, down 20
- Jungle Cruise – 55 minutes, down 22
- Space Mountain – 48 minutes, down 28
- Ariel’s Grotto – 41 minutes, down 9
- Haunted Mansion – 39 minutes, down 28
- Town Square Theater – 39 minutes, down 6
- Princess Fairytale Hall – 38 minutes, down 13
- The Many Adventures of Winnie the Pooh – 36 minutes, down 9
- Big Thunder Mountain Railroad – 35 minutes, down 23
- Buzz Lightyear’s Space Ranger Spin – 34 minutes, down 14
- Pete’s Silly Sideshow – 34 minutes, down 10
- Astro Orbiter – 30 minutes, down 15
- Enchanted Tales with Belle – 28 minutes, down 11
- It’s a Small World – 27 minutes, down 13
- Pirates of the Caribbean – 25 minutes, down 16
- Under the Sea ~ Journey of the Little Mermaid – 23 minutes, down 16
- The Barnstormer – 22 minutes, down 19
- Dumbo the Flying Elephant – 21 minutes, down 20
- The Magic Carpets of Aladdin – 20 minutes, down 13
- Mickey’s PhilharMagic – 18 minutes, down 3
- Tomorrowland Speedway – 18 minutes, down 13
- Prince Charming Regal Carrousel – 16 minutes, down 4
- Walt Disney World Railroad – 16 minutes, down 9
- Mad Tea Party – 14 minutes, down 13
- Monsters, Inc. Laugh Floor – 13 minutes, down 7
- Tomorrowland Transit Authority PeopleMover – 13 minutes, down 8
- Walt Disney’s Carousel of Progress – 5 minutes, no change
Final Thoughts
Overall, Magic Kingdom guests waited for an average of 27 minutes per attraction, which is 12 minutes or 31 percent less than last time.
So, the crowd reports align with what we’re noticing with the data.
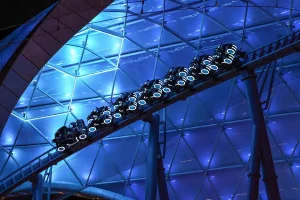
Photo: Disney
With Spring Break and Easter in the rearview mirror, Walt Disney World has entered what passes for a lull at the parks.
For the most part, everything will hover in this range for the next several weeks, making this data the new normal for a while.
MickeyBlog Logo
Thanks for visiting MickeyBlog.com! Want to go to Disney? For a FREE quote on your next Disney vacation, please fill out the form below, and one of the agents from MickeyTravels, a Diamond Level Authorized Disney Vacation Planner, will be in touch soon!