Disneyland Wait Times for March 2024

We once thought of winter as the slow time on the annual park calendar.
In recent years, that’s no longer the case. People don’t allow a little thing like cold weather to deter them from a park visit.
So, Disneyland’s wait times for March 2024 should reflect the drawing power of The Happiest Place on Earth.
About Disneyland Resort
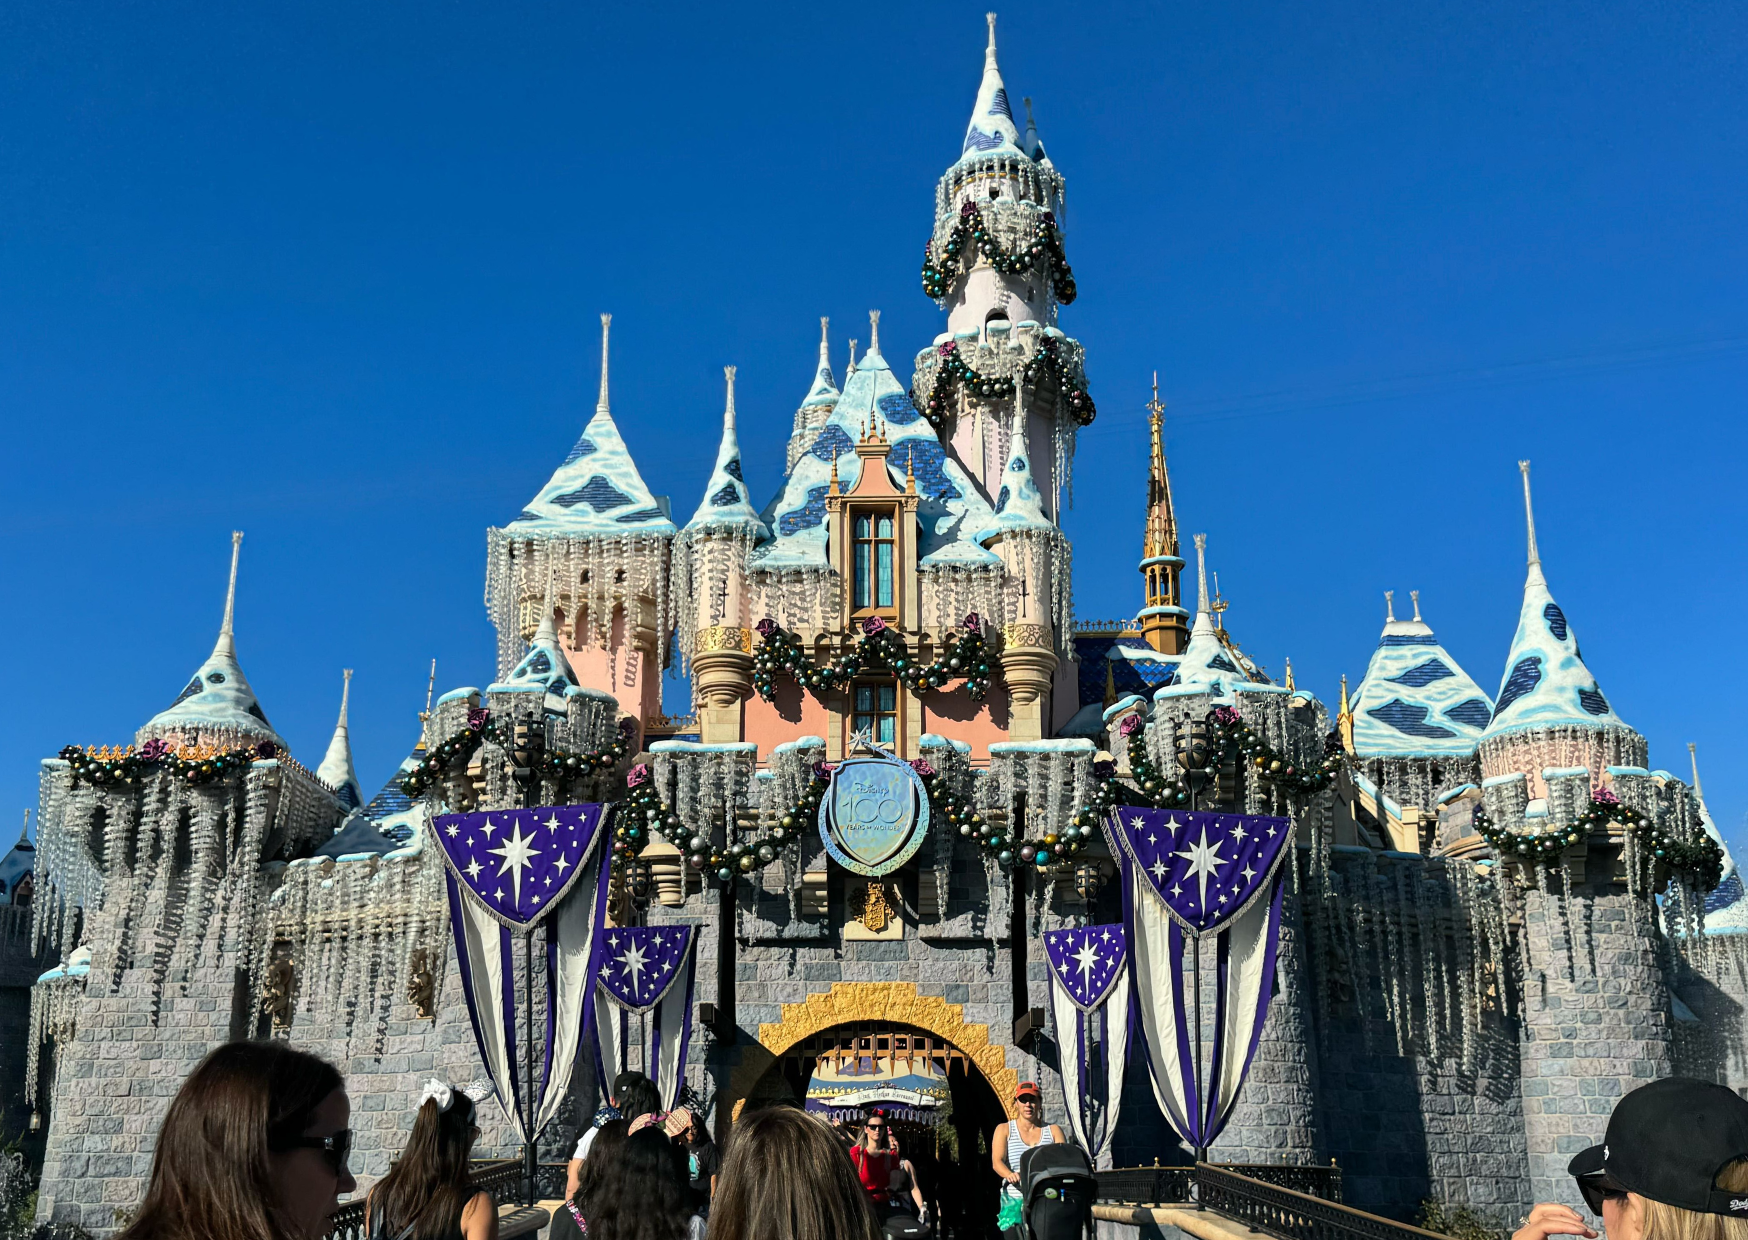
Sleeping Beauty Castle
Disneyland Resort finished a historic 2023 and immediately started planning for its future in 2024.
As I type this, Imagineers are hard at work on converting Splash Mountain into Tiana’s Bayou Adventure.
Similarly, Haunted Mansion closed in early January.

Disney
Generally, Disney does this annually to return the attraction to its normal state after Haunted Mansion Holiday ends.
However, this time proved different. Disney is adding segments to the Haunted Mansion attraction queue.
In addition, a new merchandise store themed to Madame Leota will open when the attraction returns.
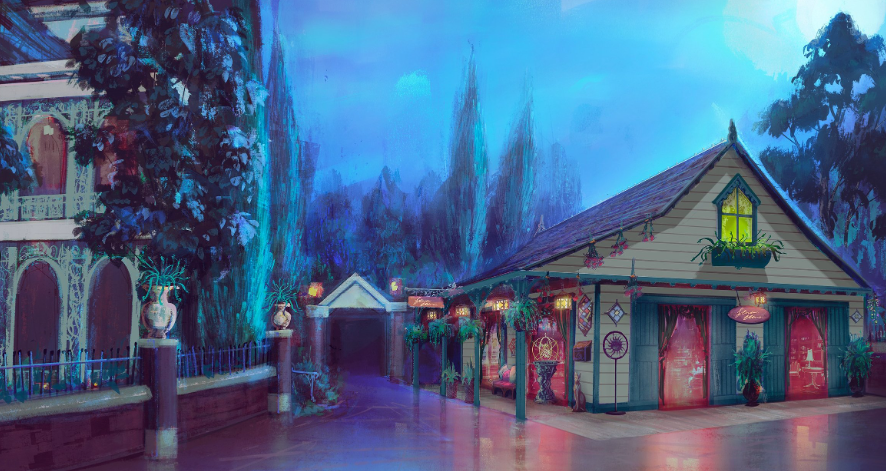
Photo: Disney
Changes like this cement the difference between Disneyland in 2023 and 2024.
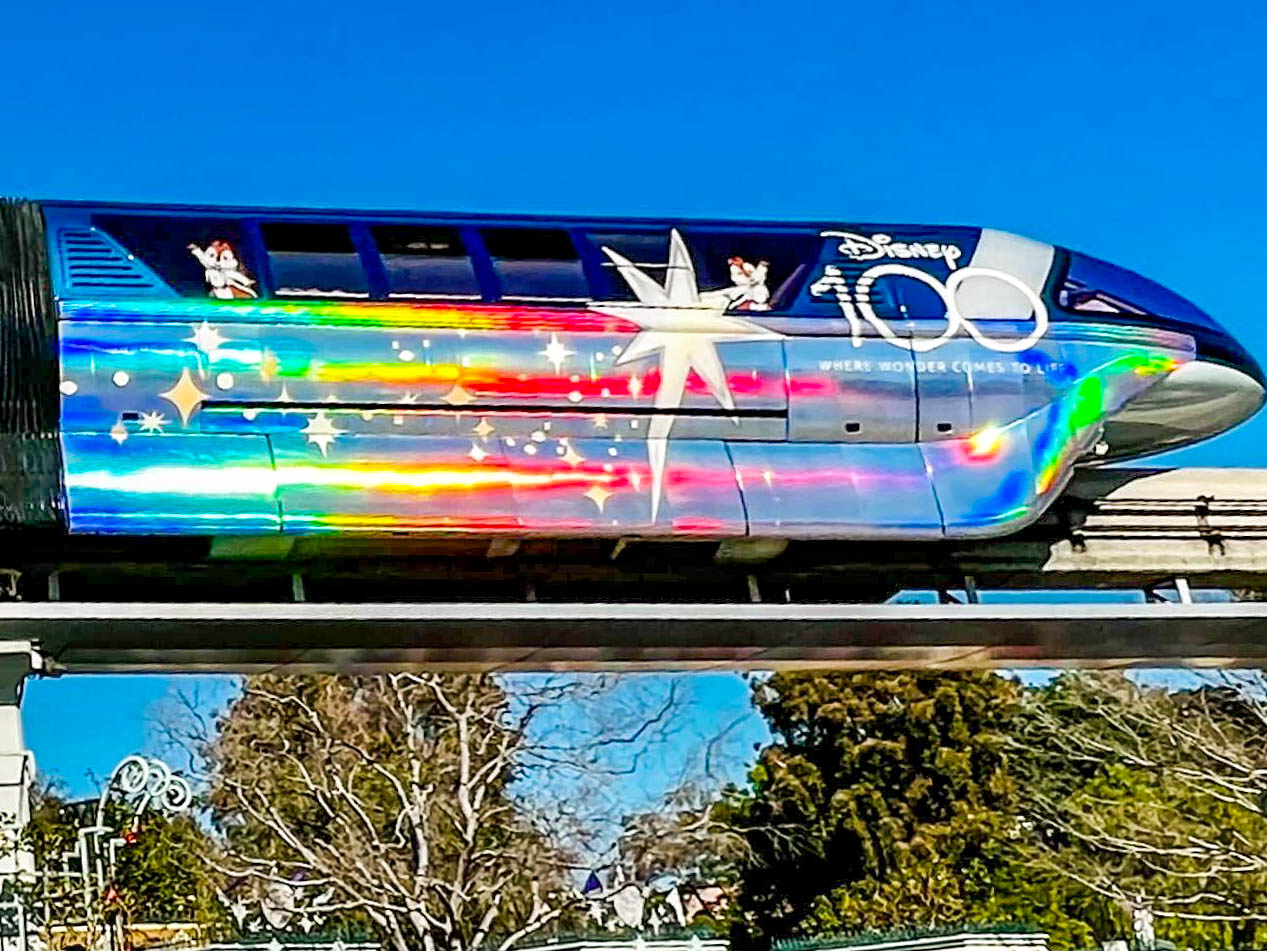
Last year, the park celebrated Disney100, the centennial birthday of The Walt Disney Company.
Now that Disney has entered its second century, park officials are working hard on the Disneyland of tomorrow.
Average Wait Times at Disneyland Park
D23
Okay, keeping the above in mind, here are the average wait times at Disneyland Park last month:
- Star Wars: Rise of the Resistance – 69 minutes, down 1
- Space Mountain – 60 minutes, up 7
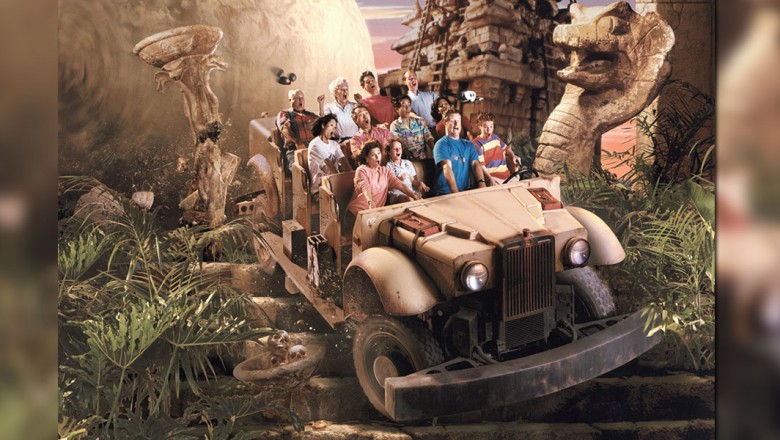
- Indiana Jones Adventure – 52 minutes, up 4
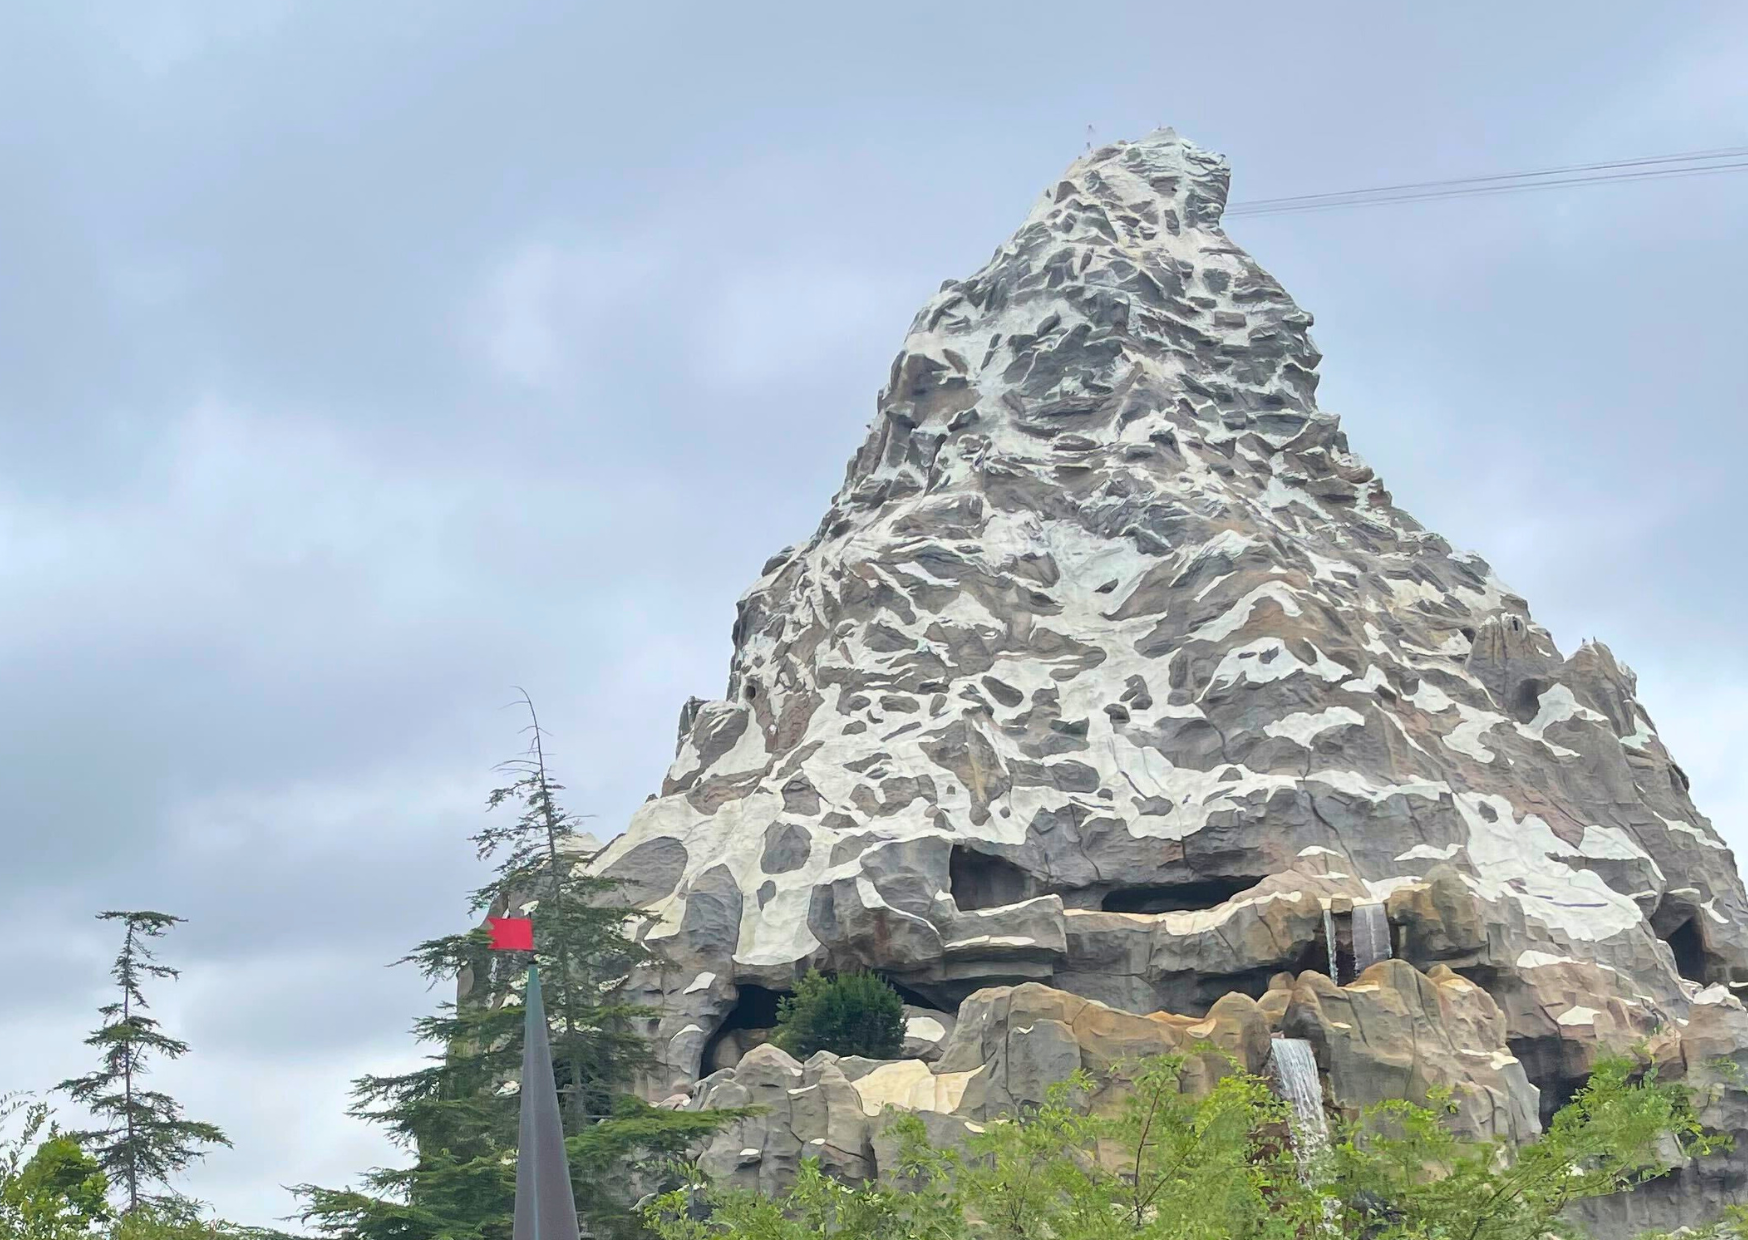
- Matterhorn Bobsleds – 51 minutes, up 2
- Roger Rabbit’s Car Toon Spin – 49 minutes, up 2
- Mickey & Minnie’s Runaway Railway – 45 minutes, no change
- Peter Pan’s Flight – 42 minutes, down 1
- Millennium Falcon: Smugglers Run – 41 minutes, down 1
- Chip ‘n’ Dale’s GADGETcoaster – 40 minutes, up 3
- Alice in Wonderland – 35 minutes, up 2
- Dumbo the Flying Elephant – 34 minutes, down 1
- Meet Mickey Mouse at Mickey’s House – 33 minutes, no change
- Buzz Lightyear Astro Blasters – 32 minutes, up 7
- Pirates of the Caribbean – 32 minutes, up 3
- Autopia – 31 minutes, up 5
- Star Tours – The Adventures Continue! – 32 minutes, up 1
- Jungle Cruise – 30 minutes, up 3
- Finding Nemo Submarine Voyage – 26 minutes, up 1
- Toad’s Wild Ride – 24 minutes, up 3
- Snow White’s Enchanted Wish – 24 minutes, up 1
- Casey Jr. Circus Train – 23 minutes, up 3
- Storybook Land Canal Boats – 21 minutes, up 2
- It’s a Small World – 20 minutes, up 4
- Pinocchio’s Daring Journey – 19 minutes, up 2
- Mad Tea Party – 18 minutes, up 3
- The Many Adventures of Winnie the Pooh – 16 minutes, up 2
- King Arthur Carrousel – 15 minutes, up 3
- Davy Crockett’s Explorer Canoes – 14 minutes, up 1
- Disneyland Monorail – 10 minutes, up 1
About Disneyland Park Wait Times
Overall, guests at The Happiest Place on Earth waited in line for an average of 32 minutes per attraction.
So, park visitors waited for two minutes or seven percent more than last time.
As a reminder, when we discuss the “March wait times,” we’re really evaluating the most recent month of data.
What we can tell from these attraction wait times is that Disneyland Park has remained steady during the past three months.
During December, the average attraction wait time was 34 minutes, followed by 30 minutes in January.
Now, we’re back to 32 minutes, indicating that guests wouldn’t notice much difference between holiday lines versus February ones.
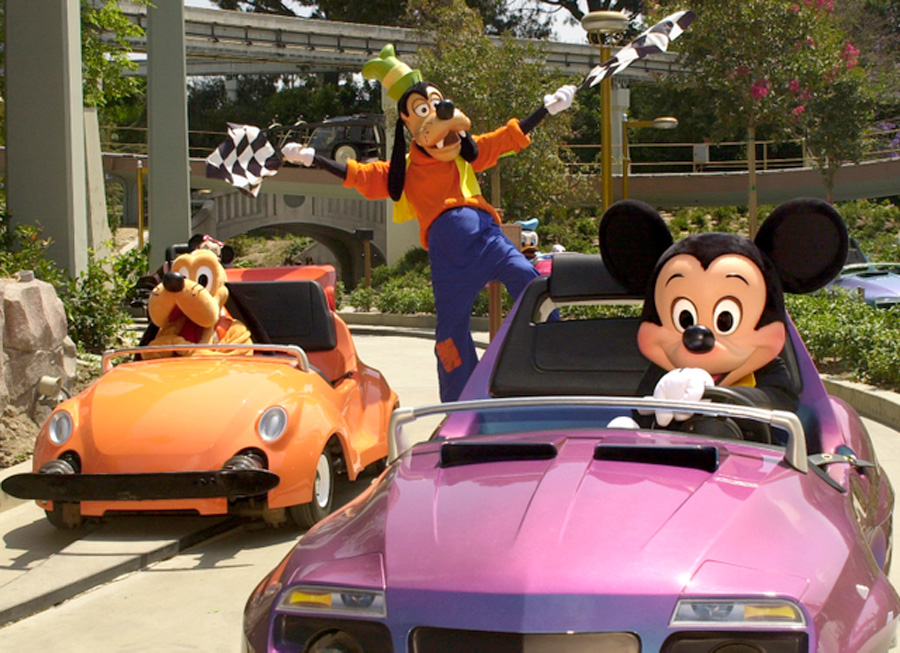
Photo: Disney
And again, this happened despite Disneyland Park lacking one of its most beloved attractions, Haunted Mansion.
In short, the park crowds remained steady and strong throughout the winter season.
About Disney California Adventure
Notably, Disney California Adventure (DCA) hasn’t experienced as much behind-the-scenes activity lately.
Like Haunted Mansion Holiday, a few attraction overlays required conversions to remove their holiday overlays.
However, those changes appear primarily cosmetic at DCA as opposed to a rather involved endeavor for Haunted Mansion.
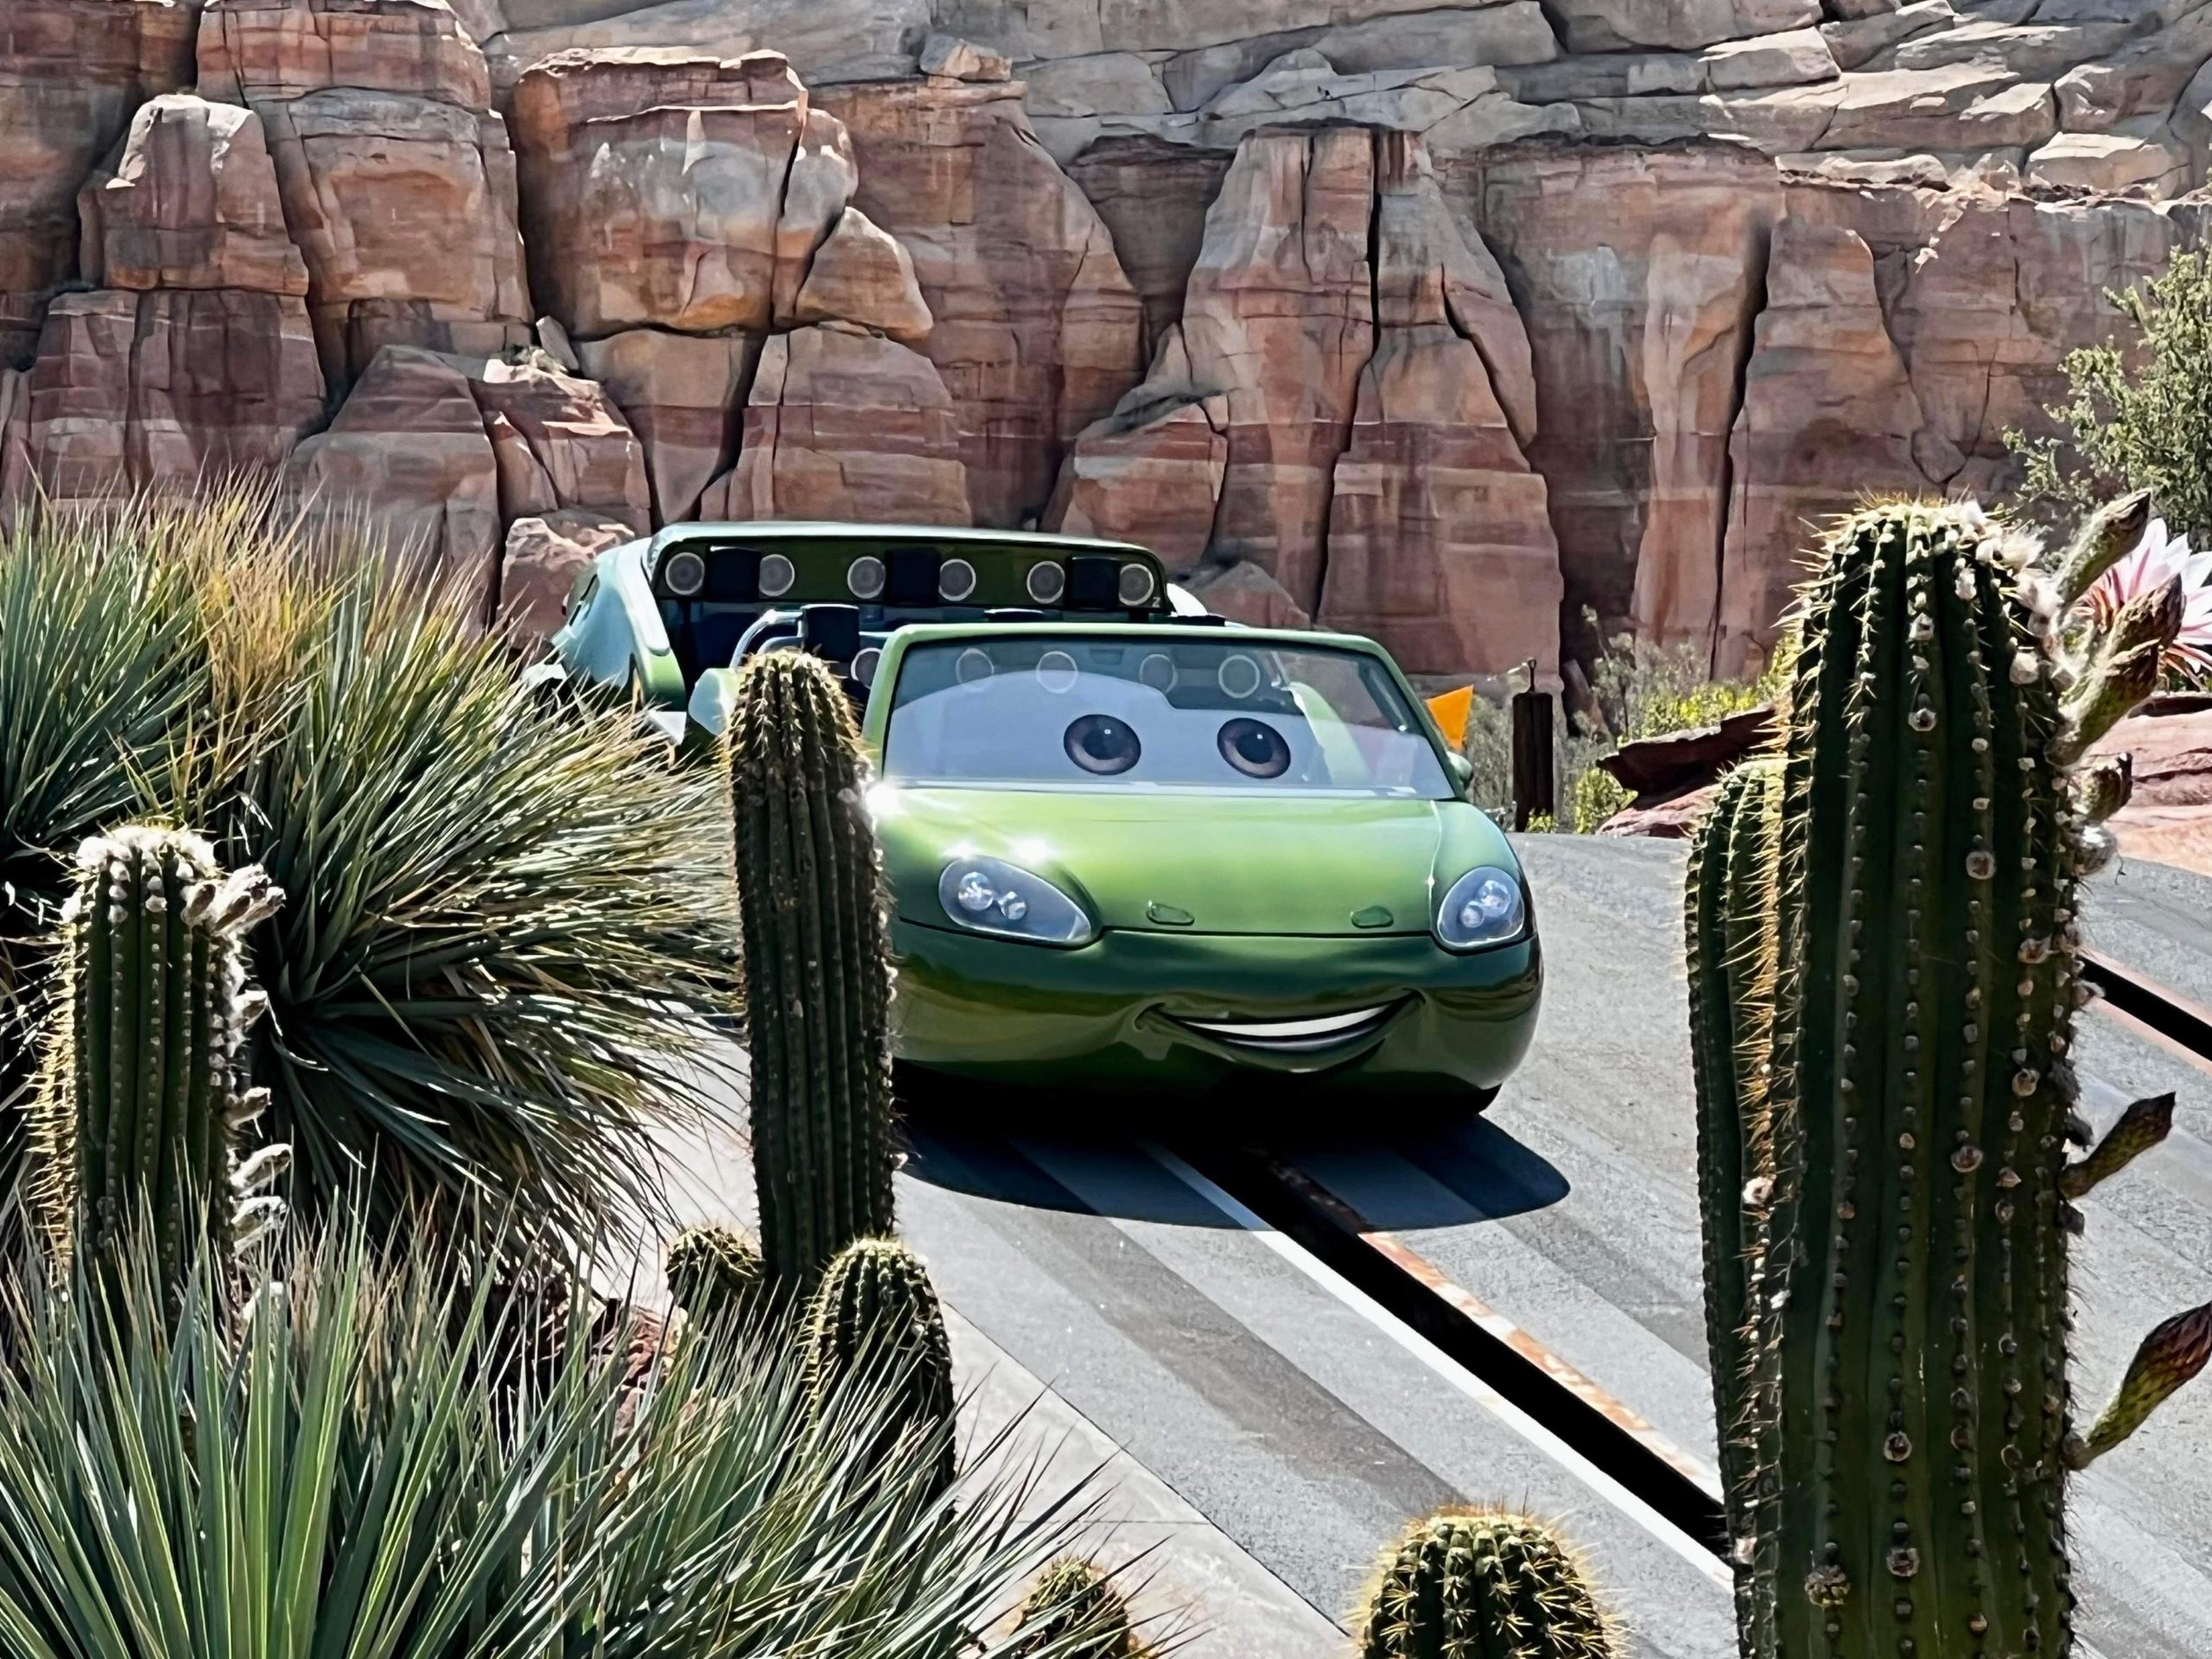
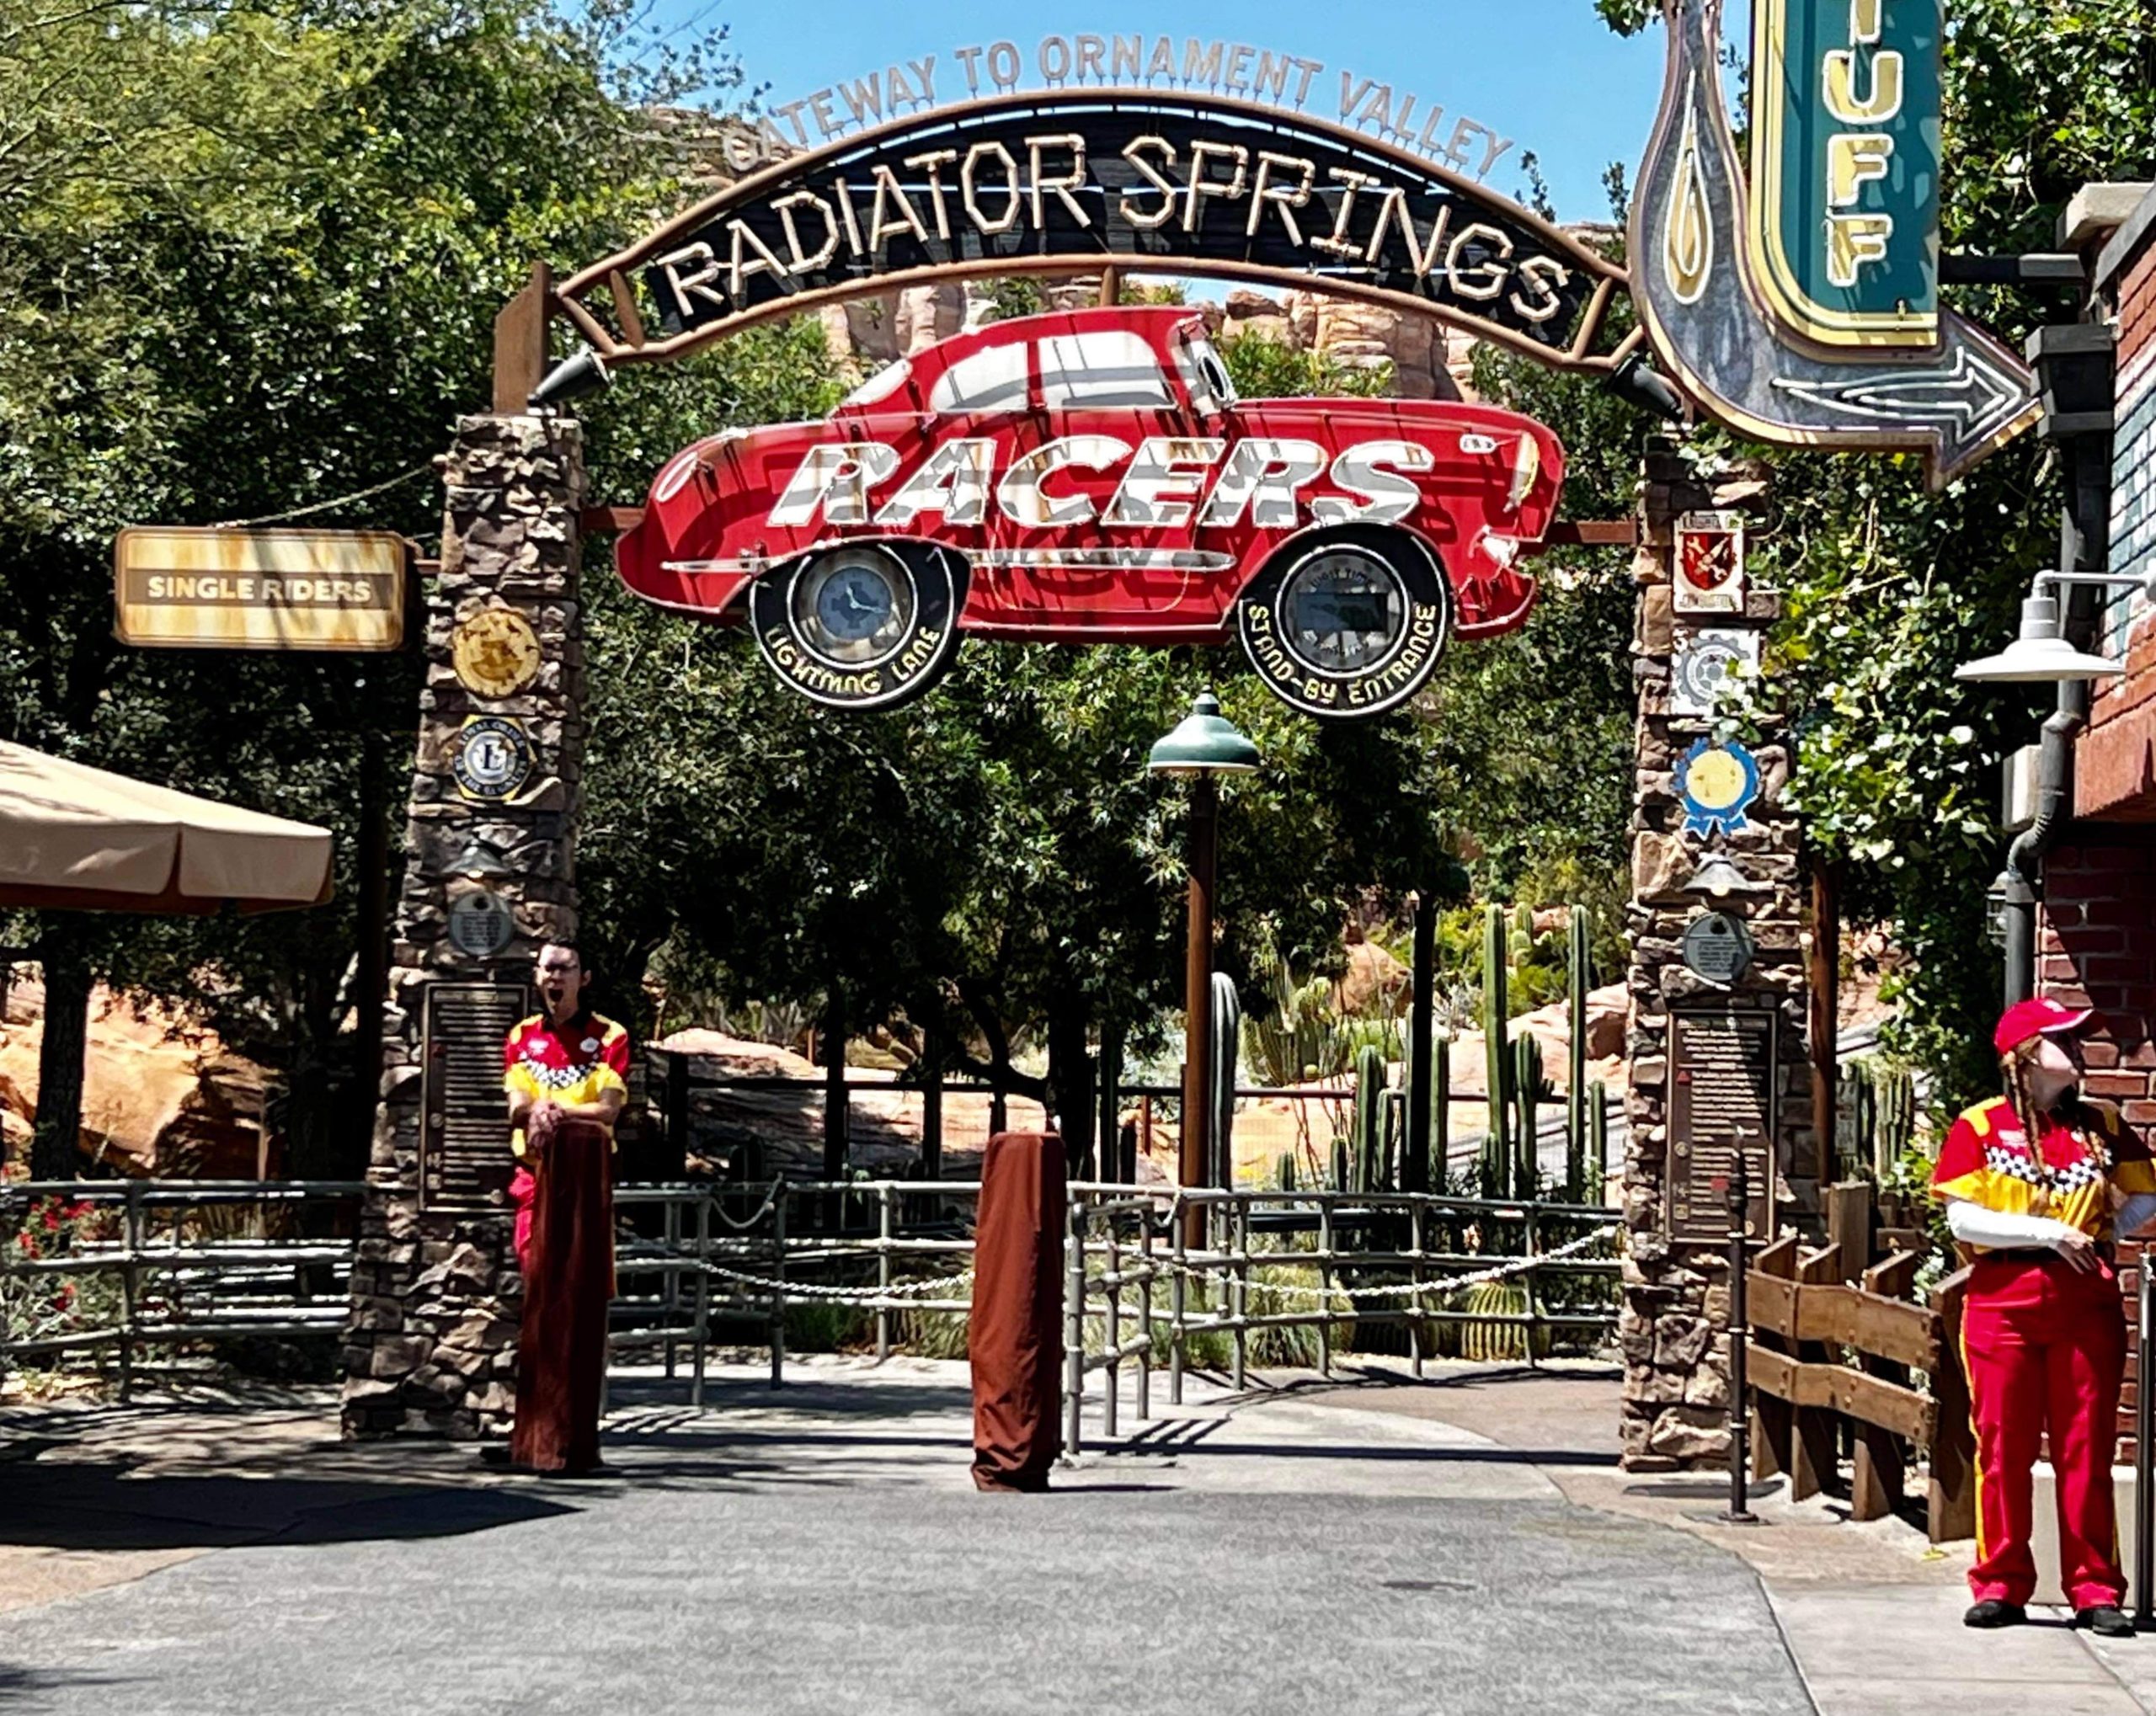
Radiator Spring Racers
So, most of what we’re tracking at this park is simply the drop from holiday crowds in December to the annual winter slowdown.
Whether that’s the reason or not, DCA’s average attraction wait times fell from 34 minutes in December to 27 minutes in January.
I’d expect some sort of performance squarely in the middle of that range over the past month. Am I right?
Average Wait Times at Disney California Adventure
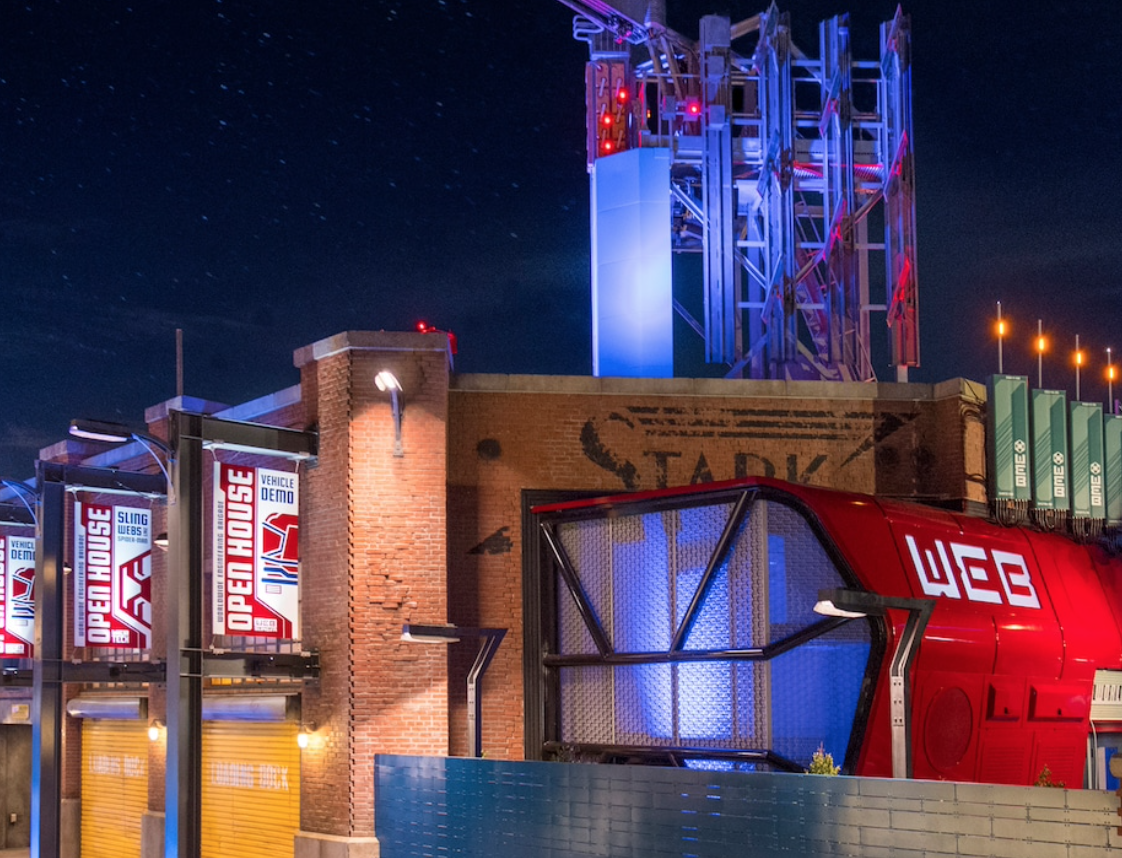
Photo: Disneyland
Here are the average wait times at Disney California Adventure for the past month:
- Radiator Springs Racers – 91 minutes, up 25
- Toy Story Mania! – 56 minutes, up 8
- Guardians of the Galaxy – Mission: BREAKOUT! – 54 minutes, up 8
- WEBSLINGERS: A Spider-Man Adventure – 50 minutes, up 6
- Goofy’s Sky School – 46 minutes, up 12
- Soarin’ Around the World – 46 minutes, up 11
- Monsters, Inc. Mike & Sulley to the Rescue! – 45 minutes, up 8
- Luigi’s Rollickin’ Roadsters – 39 minutes, up 8
- The Incredicoaster – 37 minutes, up 13
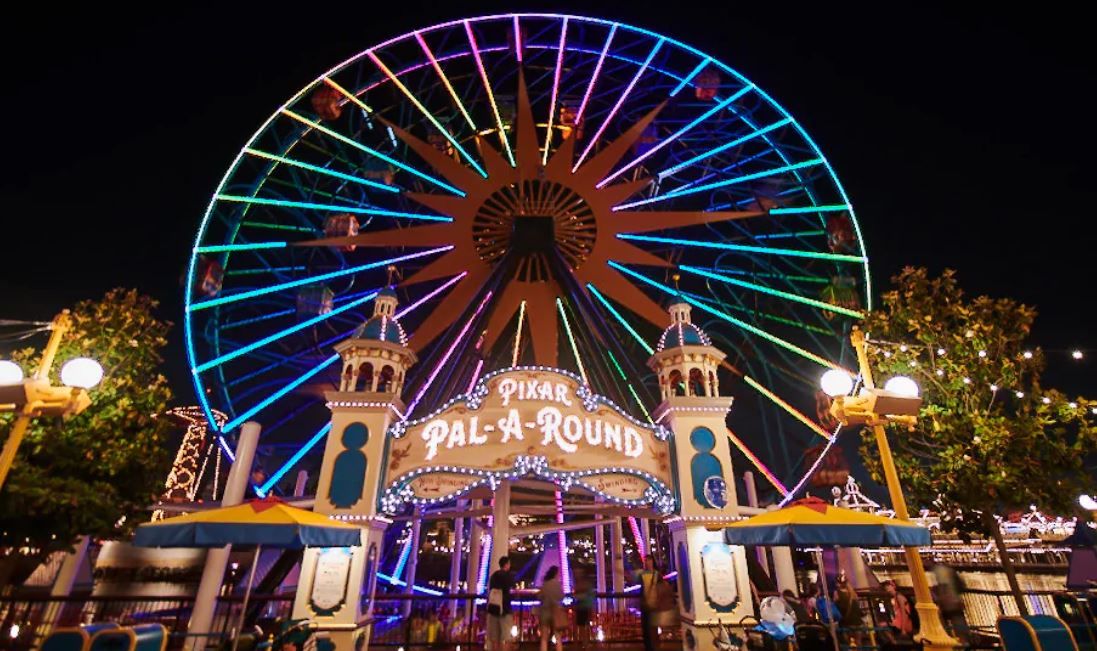
- Pixar Pal-A-Round – 35 minutes, up 7
- Inside Out Emotional Whirlwind – 27 minutes, up 3
- Mater’s Junkyard Jamboree – 23 minutes, up 6
- The Little Mermaid ~ Ariel’s Undersea Adventure – 21 minutes, up 6
- Silly Symphony Swings – 17 minutes, up 6
- Golden Zephyr – 15 minutes, up 6
- Jumpin’ Jellyfish – 15 minutes, up 4
- Mickey’s PhilharMagic – 13 minutes, no change
- Jessie’s Critter Carousel – 9 minutes, up 1
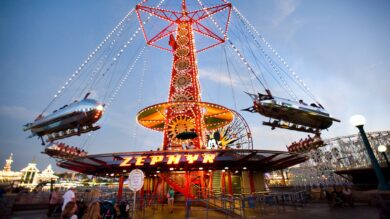
Photo: Park Savers
Okay, the data tells the story here. Virtually everything is up, some attractions are way up, and an E-ticket attraction has returned to normal.
We had a monthlong blip with Radiator Springs Racers, where it required some of the shortest waits in years.
Sadly, that tiny bit of wonderful has ended, and it’s the story of the park as well.
Guests stood in line for an average of 33 minutes, which is six minutes more than January…and nearly as much as December!
The offseason seemingly grows shorter each year at Disneyland Resort!
MickeyBlog Logo
Thanks for visiting MickeyBlog.com! Want to go to Disney? For a FREE quote on your next Disney vacation, please fill out the form below, and one of the agents from MickeyTravels, a Diamond Level Authorized Disney Vacation Planner, will be in touch soon!
Feature Photo: Disney