Walt Disney World Wait Times for First Week of October 2023

Halloween Month has arrived!
Friends, this is not a drill. When you say Boo to You for the next few weeks, you can really mean it.
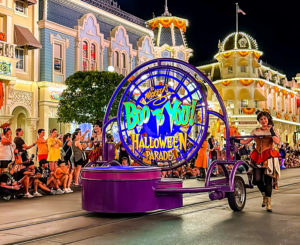
All those Halloween decorations you put up in August don’t look ridiculous now. They’re calendar-appropriate!
Not coincidentally, Disney theme parks should start experiencing more crowds now that September is in the books. But will they?

Photo: Playbuzz.com
We’ve had some unexpected hiccups with Walt Disney World wait times recently. So, I’m not quite sure what to expect, but here goes!
Here are the average wait times for the first week of October 2023.
Disney’s Animal Kingdom
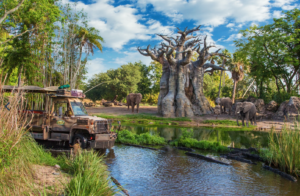
Photo: Disney
While Disney has promised changes coming to Animal Kingdom, let’s be blunt. These improvements are several years away.
So, we can expect status quo at Animal Kingdom for a while to come.

Photo: Disney
That means Avatar Flight of Passage and Na’vi River Journey will remain the in-demand attractions here until at least 2026.
Here are Animal Kingdom’s wait times for the first week of October:
- Avatar Flight of Passage – 65 minutes, up 2
- Na’vi River Journey – 62 minutes, no change
- Adventurers Outpost – 46 minutes, up 3
- Kilimanjaro Safaris – 42 minutes, up 15
- Expedition Everest – 30 minutes, up 8
- Kali River Rapids – 25 minutes, up 7
- DINOSAUR – 21 minutes, up 7
- It’s Tough to Be a Bug! – 10 minutes, no change
- TriceraTop Spin – 10 minutes, up 1
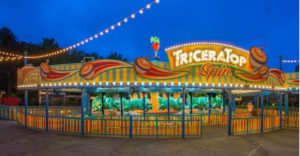
Photo: Disney
Overall, guests at Animal Kingdom waited for an average of 34 minutes per attraction, which is three minutes more than last time.
Disney’s Hollywood Studios
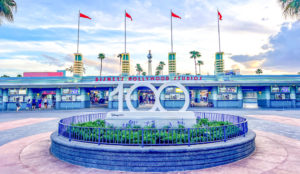
Entrance to Disney’s Hollywood Studios
To Disney’s credit, Hollywood Studios has been humming along without incident lately.
Star Wars: Rise of the Resistance isn’t experiencing 101 error codes as often, which causes a ripple effect.
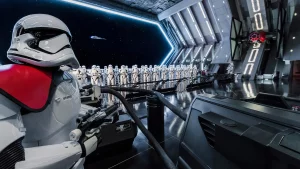
Photo: Disney
As long as this attraction is working well, the other wait times at the park remain under control.
When the E-ticket attraction isn’t operational, the wheels come off elsewhere, as Hollywood Studios suddenly loses a ton of throughput.
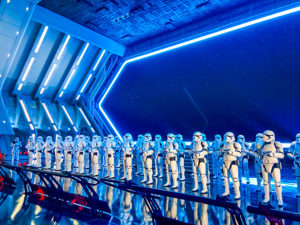
Credit: Disney
So, a reliable Rise of the Resistance has meant a huge difference overall. It’s like a park-wide halo effect.
Not coincidentally, Slinky Dog Dash typically winds up with the longest wait time when Rise of the Resistance remains functional.
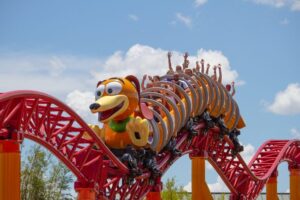
Photo: TheCoasterKings.com
Reinforcing those points, here are the wait times for the past week:
- Slinky Dog Dash – 92 minutes, up 13
- Star Wars: Rise of the Resistance – 76 minutes, up 6
- Rock ‘n’ Roller Coaster Starring Aerosmith – 61 minutes, up 8
- Mickey & Minnie’s Runaway Railway 58 minutes, up 2
- Toy Story Mania! – 56 minutes, no change
- Millennium Falcon: Smugglers Run – 54 minutes, up 6
- Twilight Zone Tower of Terror – 51 minutes, up 3
- Red Carpet Dreams – 40 minutes, up 1
- Alien Swirling Saucers – 38 minutes, up 2
- Celebrity Spotlight – 20 minutes, up 6
- Lightning McQueen’s Racing Academy – 15 minutes, no change
- Star Tours – The Adventures Continue! – 14 minutes, up 3
- Muppet*Vision 3D – 10 minutes, no change
Overall, guests stood in line for an average of 41 minutes per attraction, which is two minutes more than last time.
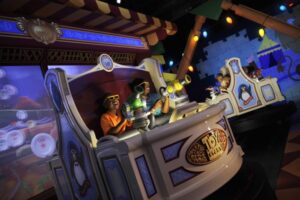
Photo: Disney
So, we are ticking up a bit more in terms of wait times, but only three Hollywood Studios attractions require waits of an hour or more.
That fact could change quickly, though. Four other attractions are hovering in the 50s, and October usually experiences higher park traffic.
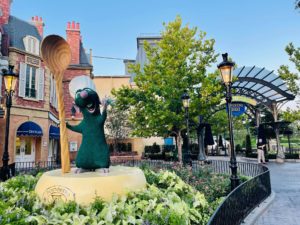
EPCOT

New PhotoPass spot?
As a reminder, plenty is happening at EPCOT. Most recently, Disney changed Journey of Water | Inspired by Moana to a soft opening.
For half the week, guests could experience the new attraction. Once again, it doesn’t factor into wait times yet, but it could soon.

Moana
Similarly, the Moana character greeting isn’t listed yet. It’s technically in a soft opening right now, too.
I’m playing it by ear on whether to include them in a couple of weeks.

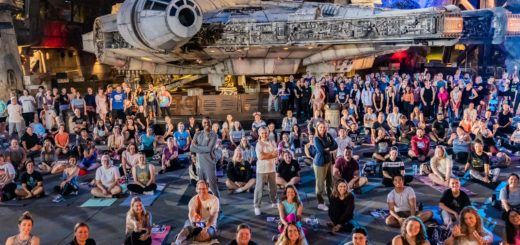
Soarin’ Over California
Until then, we’ve still got the Disney100 celebration, the temporary return of Soarin’ Over California, and the EPCOT International Food & Wine Festival ongoing.
Did all these factors increase wait times at EPCOT? Let’s find out.
- Frozen Ever After – 70 minutes, down 4
- Remy’s Ratatouille Adventure – 64 minutes, down 3
- Test Track – 63 minutes, up 6
- Soarin’ Over California – 47 minutes, down 6
- Royal Sommerhus – 37 minutes, up 1
- Journey into Imagination with Figment – 21 minutes, up 4
- Mission: SPACE – 20 minutes, up 2
- Turtle Talk with Crush – 19 minutes, no change
- The Seas with Nemo & Friends – 18 minutes, up 4
- Spaceship Earth – 17 minutes, up 2
- Living with the Land – 14 minutes, no change
- Gran Fiesta Tour Starring the Three Caballeros – 13 minutes, no change
Overall, guests at EPCOT stood in line for an average of 33 minutes per attraction, which is one minute more than last time.
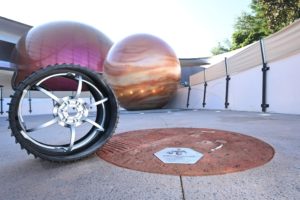
By the way, guests also had renewed interest in Mission: SPACE. Here’s a stunning feature Disney just added to the ride.
Disney has given guests PLENTY of reasons to visit EPCOT right now.
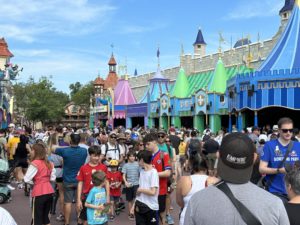
Magic Kingdom
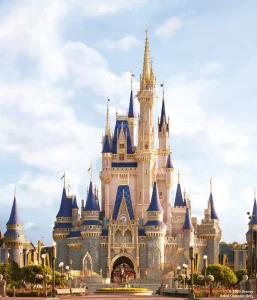
Photo: Disney Parks
Thus far, the other three parks have increased their wait times slightly. Did the trend hold at Magic Kingdom? Let’s check:
- Seven Dwarfs Mine Train – 80 minutes, up 8
- Peter Pan’s Flight – 72 minutes, up 10
- Space Mountain – 57 minutes, up 17
- Jungle Cruise – 52 minutes, up 4
- Haunted Mansion – 48 minutes, up 6
- Princess Fairytale Hall – 47 minutes, up 12
- Big Thunder Mountain Railroad – 43 minutes, up 14
- Buzz Lightyear’s Space Ranger Spin – 41 minutes, up 9
- Pirates of the Caribbean – 40 minutes, up 9
- Town Square Theater – 40 minutes, up 9
- Ariel’s Grotto – 39 minutes, up 2
- The Many Adventures of Winnie the Pooh – 37 minutes, up 4
- Pete’s Silly Sideshow – 35 minutes, down 1
- Astro Orbiter – 34 minutes, up 8
- Enchanted Tales with Belle – 31 minutes, up 4
- It’s a Small World – 26, up 5
- Under the Sea ~ Journey of the Little Mermaid – 24 minutes, up 4
- The Barnstormer – 21 minutes, up 5
- Dumbo the Flying Elephant – 21 minutes, up 6
- Tomorrowland Speedway – 20 minutes, up 2
- The Magic Carpets of Aladdin – 18 minutes, up 4
- Mad Tea Party – 17 minutes, up 5
- Mickey’s PhilharMagic – 15 minutes, down 3
- Monsters, Inc. Laugh Floor – 15 minutes, no change
- Tomorrowland Transit Authority PeopleMover – 14 minutes, up 1
- Prince Charming Regal Carrousel – 13 minutes, up 3
- Walt Disney World Railroad – 13 minutes, down 3
- Country Bear Jamboree – 5 minutes, no change
- Walt Disney’s Carousel of Progress – 5 minutes, no change
Final Thoughts
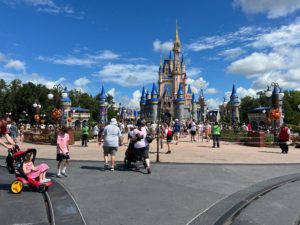
Overall, guests at Magic Kingdom waited for an average of 32 minutes per attraction, which is six minutes more than last time.
Obviously, crowds are growing larger during early October, which is to be expected.
I don’t know how dramatic the expansion will be this year compared to previous years, though. This September seemed more crowded than usual.
Photo: MickeyBlog
Thanks for visiting MickeyBlog.com! Want to go to Disney? For a FREE quote on your next Disney vacation, please fill out the form below, and one of the agents from MickeyTravels, a Diamond Level Authorized Disney Vacation Planner, will be in touch soon!
Feature Photo: LA Times