Walt Disney World Wait Times for Third Week of June 2023

With summer vacation underway at most North American schools, now is when everyone heads to Walt Disney World!
Theme park attendance should soar over the next eight weeks, which will rank among the busiest overall in 2023.
As our Father’s Day photos demonstrate, that doesn’t signify massive attendance throughout the day. Overall, crowds will increase, though.
How much did that factor into park attendance this week? Here are the Walt Disney World wait times for the third week of June 2023.
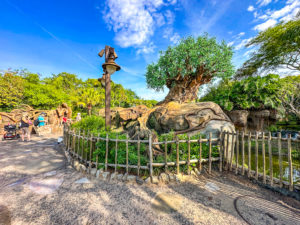
Disney’s Animal Kingdom
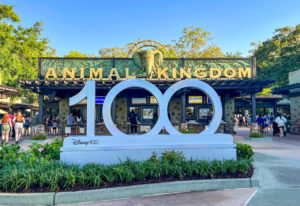
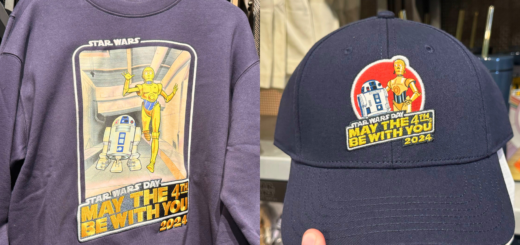
Disney100 Sign
Let’s start with Animal Kingdom, which we just learned was Walt Disney World’s least trafficked park in 2022.
Disney officials must address this park’s desperate need for a new attraction, as it fell one million guests behind EPCOT, which finished third.
Before the pandemic, Disney’s Hollywood Studios and Animal Kingdom claimed similar attendance levels.
In calendar 2022, Hollywood Studios, home of Star Wars: Galaxy’s Edge, had surpassed Animal Kingdom by 21 percent or 1.9 million guests.
Disney needs to act here and sounds like it will soon. Pandora – The World of Avatar recently turned six years old. It’s time to act.
For now, Avatar Flight of Passage will remain the alpha. Last week, the trip through the skies of Pandora averaged a wait of 89 minutes.
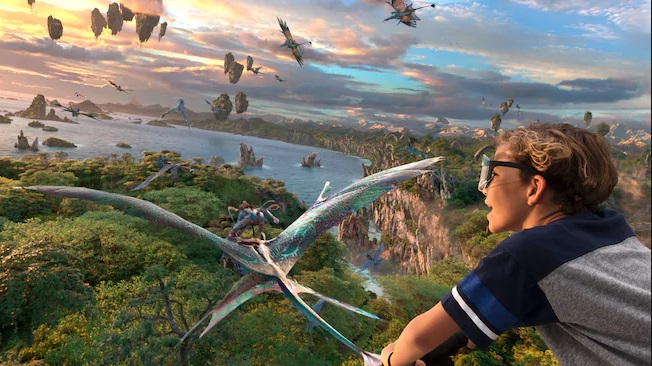
Credit: Disney
That’s eight minutes less than last time, which is a bit unexpected.
At Na’vi River Journey, guests stood in line for 76 minutes, which is two minutes more than last time.
This is a rare instance when the rides don’t align with their traffic patterns.
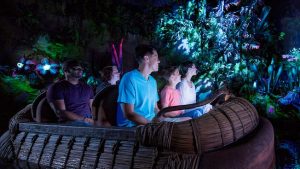
Photo: Disney
How did the rest of Animal Kingdom hold? Here were the other average wait times last week:
- Kali River Rapids – 45 minutes, up 4
- Kilimanjaro Safaris – 40 minutes, up 2
- Adventurers Outpost – 39 minutes, down 5
- DINOSAUR – 34 minutes, no change
- Expedition Everest – 33 minutes, down 9
- It’s Tough to Be a Bug! – 13 minutes, no change
- TriceraTop Spin – 10 minutes, down 1
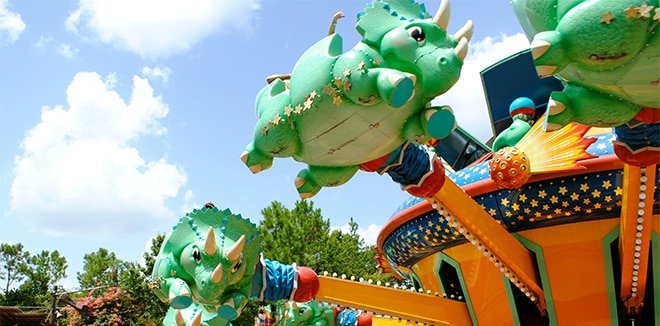
Photo: Disney
Overall, guests stood in line for an average of 44 minutes per attraction, just like the previous week.
However, the inconsistent behavior among individual attractions belies the consistent average wait overall.
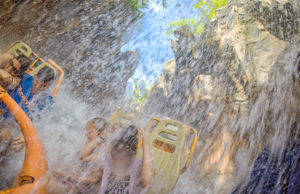
Photo by Judd Helms via WDW Magazine
Some of this behavior is predictable. For instance, Kali River Rapids crowds increase during the warm summer months.
Then, there are examples like Avatar Flight of Passage and Expedition Everest that are more challenging to explain.
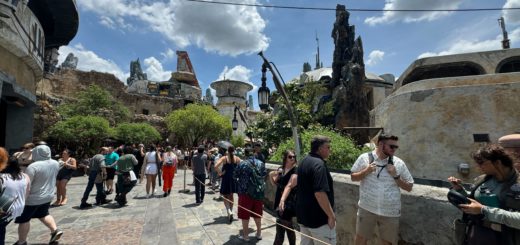
Disney’s Hollywood Studios
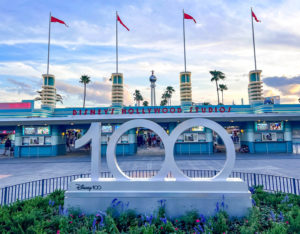
Given the odd fluctuations at Animal Kingdom, I honestly have no idea what to expect here.
These are the average wait times at Hollywood Studios last week:
- Slinky Dog Dash – 106 minutes, up 10
- Star Wars: Rise of the Resistance – 90 minutes, up 6
- Millennium Falcon: Smugglers Run – 74 minutes, down 2
- Rock ‘n’ Roller Coaster Starring Aerosmith – 67 minutes, up 2
- Mickey & Minnie’s Runaway Railway – 66 minutes, down 1
- Toy Story Mania! – 64 minutes, down 2
- Twilight Zone Tower of Terror – 49 minutes, no change
- Alien Swirling Saucers – 44 minutes, up 3
- Red Carpet Dreams – 39 minutes, down 1
- Star Tours – The Adventures Continue – 27 minutes, up 1
- Celebrity Spotlight – 19 minutes, down 1
- Lightning McQueen’s Racing Academy – 18 minutes, up 3
- Muppet*Vision 3D – 14 minutes, up 1
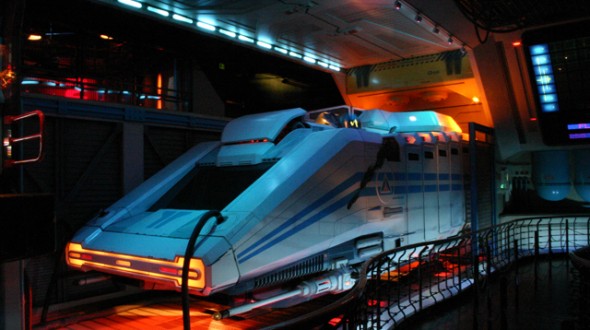
Photo Credit: www.geek.com
Overall, guests waited for an average of 46 minutes per attraction at Hollywood Studios, the same as the previous week.
Once again, there’s no clear pattern to this behavior, just a bunch of data noise.
EPCOT
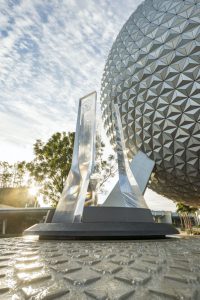
EPCOT
Image Credit: Disney
So, we have two theme parks with the same average wait times for two consecutive weeks.
However, the individual attractions have bounced around a lot. Let’s see whether EPCOT follows this pattern.
(Matt Stroshane, photographer)
Here are the park’s average waits for the past week:
- Frozen Ever After – 76 minutes, down 4
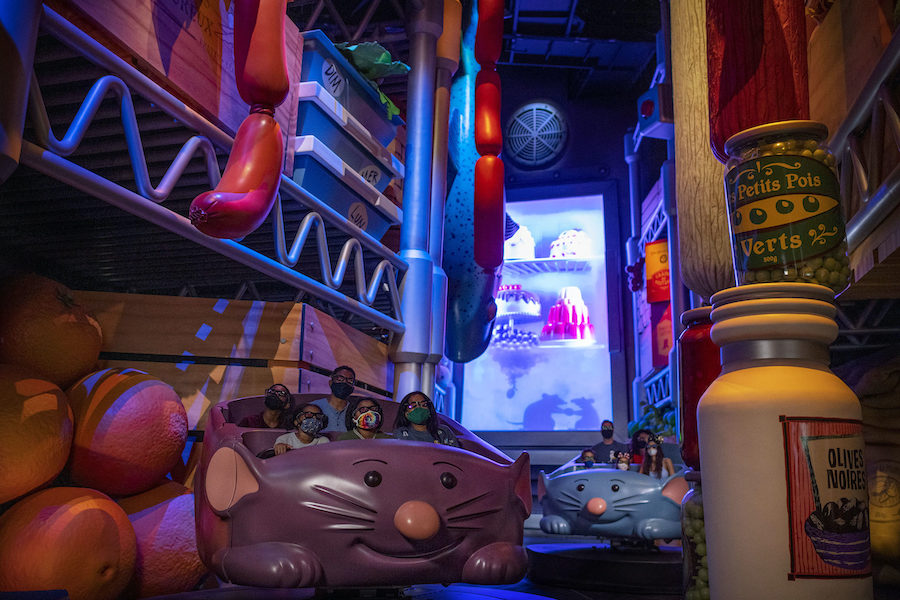
- Remy’s Ratatouille Adventure – 68 minutes, down 2
- Test Track – 67 minutes, down 5
- Soarin’ Around the World – 40 minutes, down 6
- Royal Sommerhus – 34 minutes, down 3
- Mission: SPACE – 22 minutes, down 4
- Spaceship Earth – 20 minutes, down 2
- Turtle Talk with Crush – 18 minutes, down 1
- Journey into Imagination with Figment – 17 minutes, down 6
- The Seas with Nemo & Friends – 16 minutes, no change
- Living with the Land – 15 minutes, down 5
- Gran Fiesta Tour Starring the Three Caballeros – 13 minutes, no change
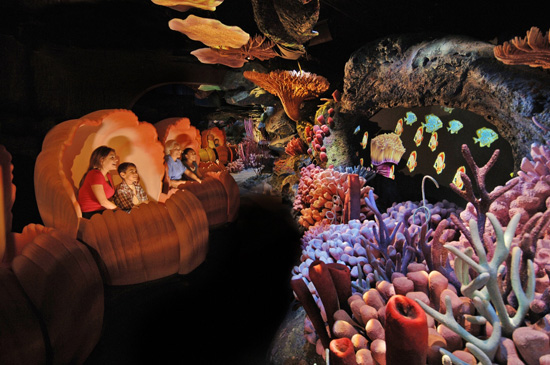
Photo: Disney
Overall, guests at EPCOT stood in line for an average of 34 minutes per attraction, which is four minutes less than the previous week.
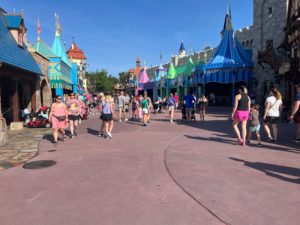
Magic Kingdom
Photo: Disney
Finally, let’s discuss the average line sizes at the world’s most popular theme park.
Here were Magic Kingdom’s wait times last week:
- Seven Dwarfs Mine Train – 90 minutes, down 6
- Peter Pan’s Flight – 79 minutes, down 4
- Space Mountain – 62 minutes, up 2
- Jungle Cruise – 58 minutes, down 3
- Haunted Mansion – 51 minutes, down 3
- Pirates of the Caribbean – 47 minutes, down 3
- Buzz Lightyear’s Space Ranger Spin – 46 minutes, down 3
- Big Thunder Mountain Railroad – 42 minutes, down 2
- Princess Fairytale Hall – 40 minutes, down 2
- The Many Adventures of Winnie the Pooh – 39 minutes, down 2
- Ariel’s Grotto – 38 minutes, down 2
- Town Square Theater – 37 minutes, up 2
- Astro Orbiter – 35 minutes, down 2
- It’s a Small World – 34 minutes, up 1
- Under the Sea ~ Journey of the Little Mermaid – 31 minutes, down 5
- Pete’s Silly Sideshow – 30 minutes, down 4
- Enchanted Tales with Belle – 28 minutes, down 3
- Dumbo the Flying Elephant – 26 minutes, no change
- The Magic Carpets of Aladdin – 25 minutes, no change
- The Barnstormer – 24 minutes, down 3
- Tomorrowland Speedway – 20 minutes, down 3
- Mickey’s PhilharMagic – 18 minutes, no change
- Monsters, Inc. Laugh Floor – 17 minutes, no change
- Mad Tea Party – 16 minutes, no change
- Tomorrowland Transit Authority PeopleMover – 15 minutes, no change
- Walt Disney World Railroad – 14 minutes, down 2
- Prince Charming Regal Carrousel – 12 minutes, down 2
- Country Bear Jamboree – 5 minutes, no change
- Walt Disney’s Carousel of Progress – 5 minutes, no change
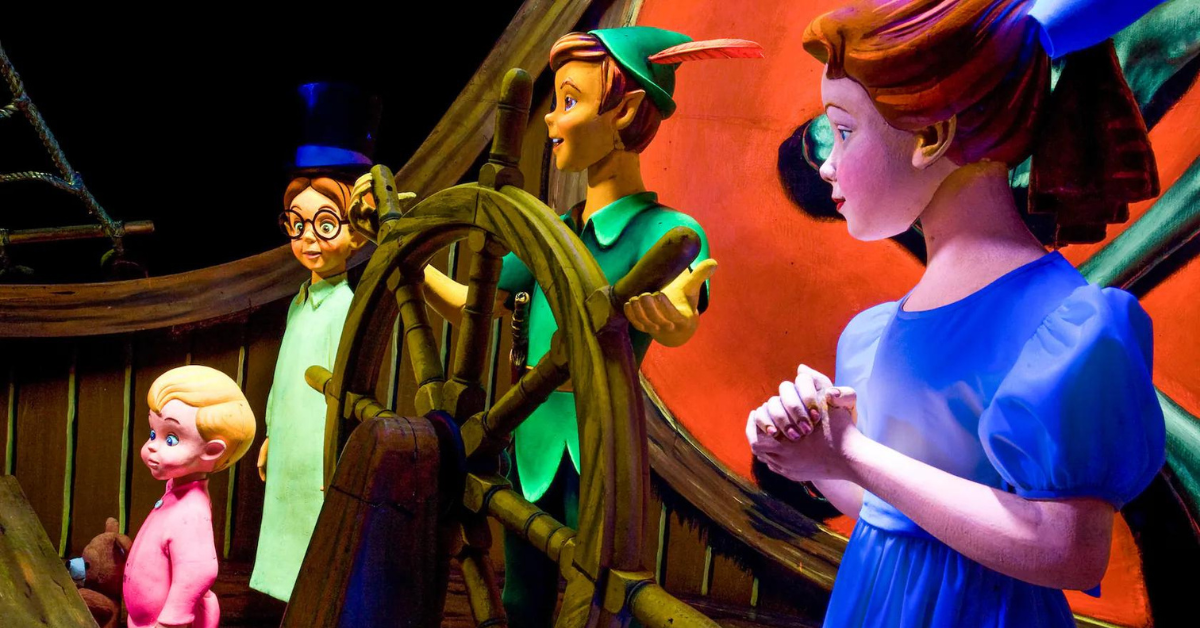
Photo: Disney
Overall, Magic Kingdom guests waited for an average of 33 minutes per attraction. That’s two minutes less than last time.
So, the summer crowds clearly haven’t hit Disney yet. I expect that to change right about…NOW!
Photo: MickeyBlog
Thanks for visiting MickeyBlog.com! Want to go to Disney? For a FREE quote on your next Disney vacation, please fill out the form below, and one of the agents from MickeyTravels, a Diamond Level Authorized Disney Vacation Planner, will be in touch soon!
Feature Photo: LA Times