WDW Wait Times for Thanksgiving Week 2022
Every year, Walt Disney World claims its largest tourism numbers during three holiday weeks. Those are July 4th, Thanksgiving Week, and Christmas Week.
As our turkey-filled American fans know, last week was Thanksgiving. So…

Photo: Disney
Yeah, this might not be pretty. Here are the average wait times for Thanksgiving Week 2022.
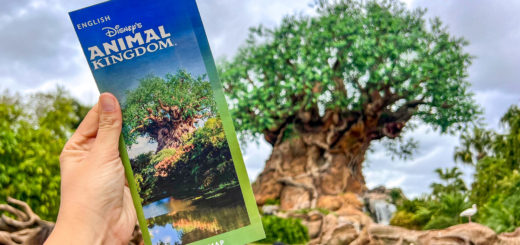
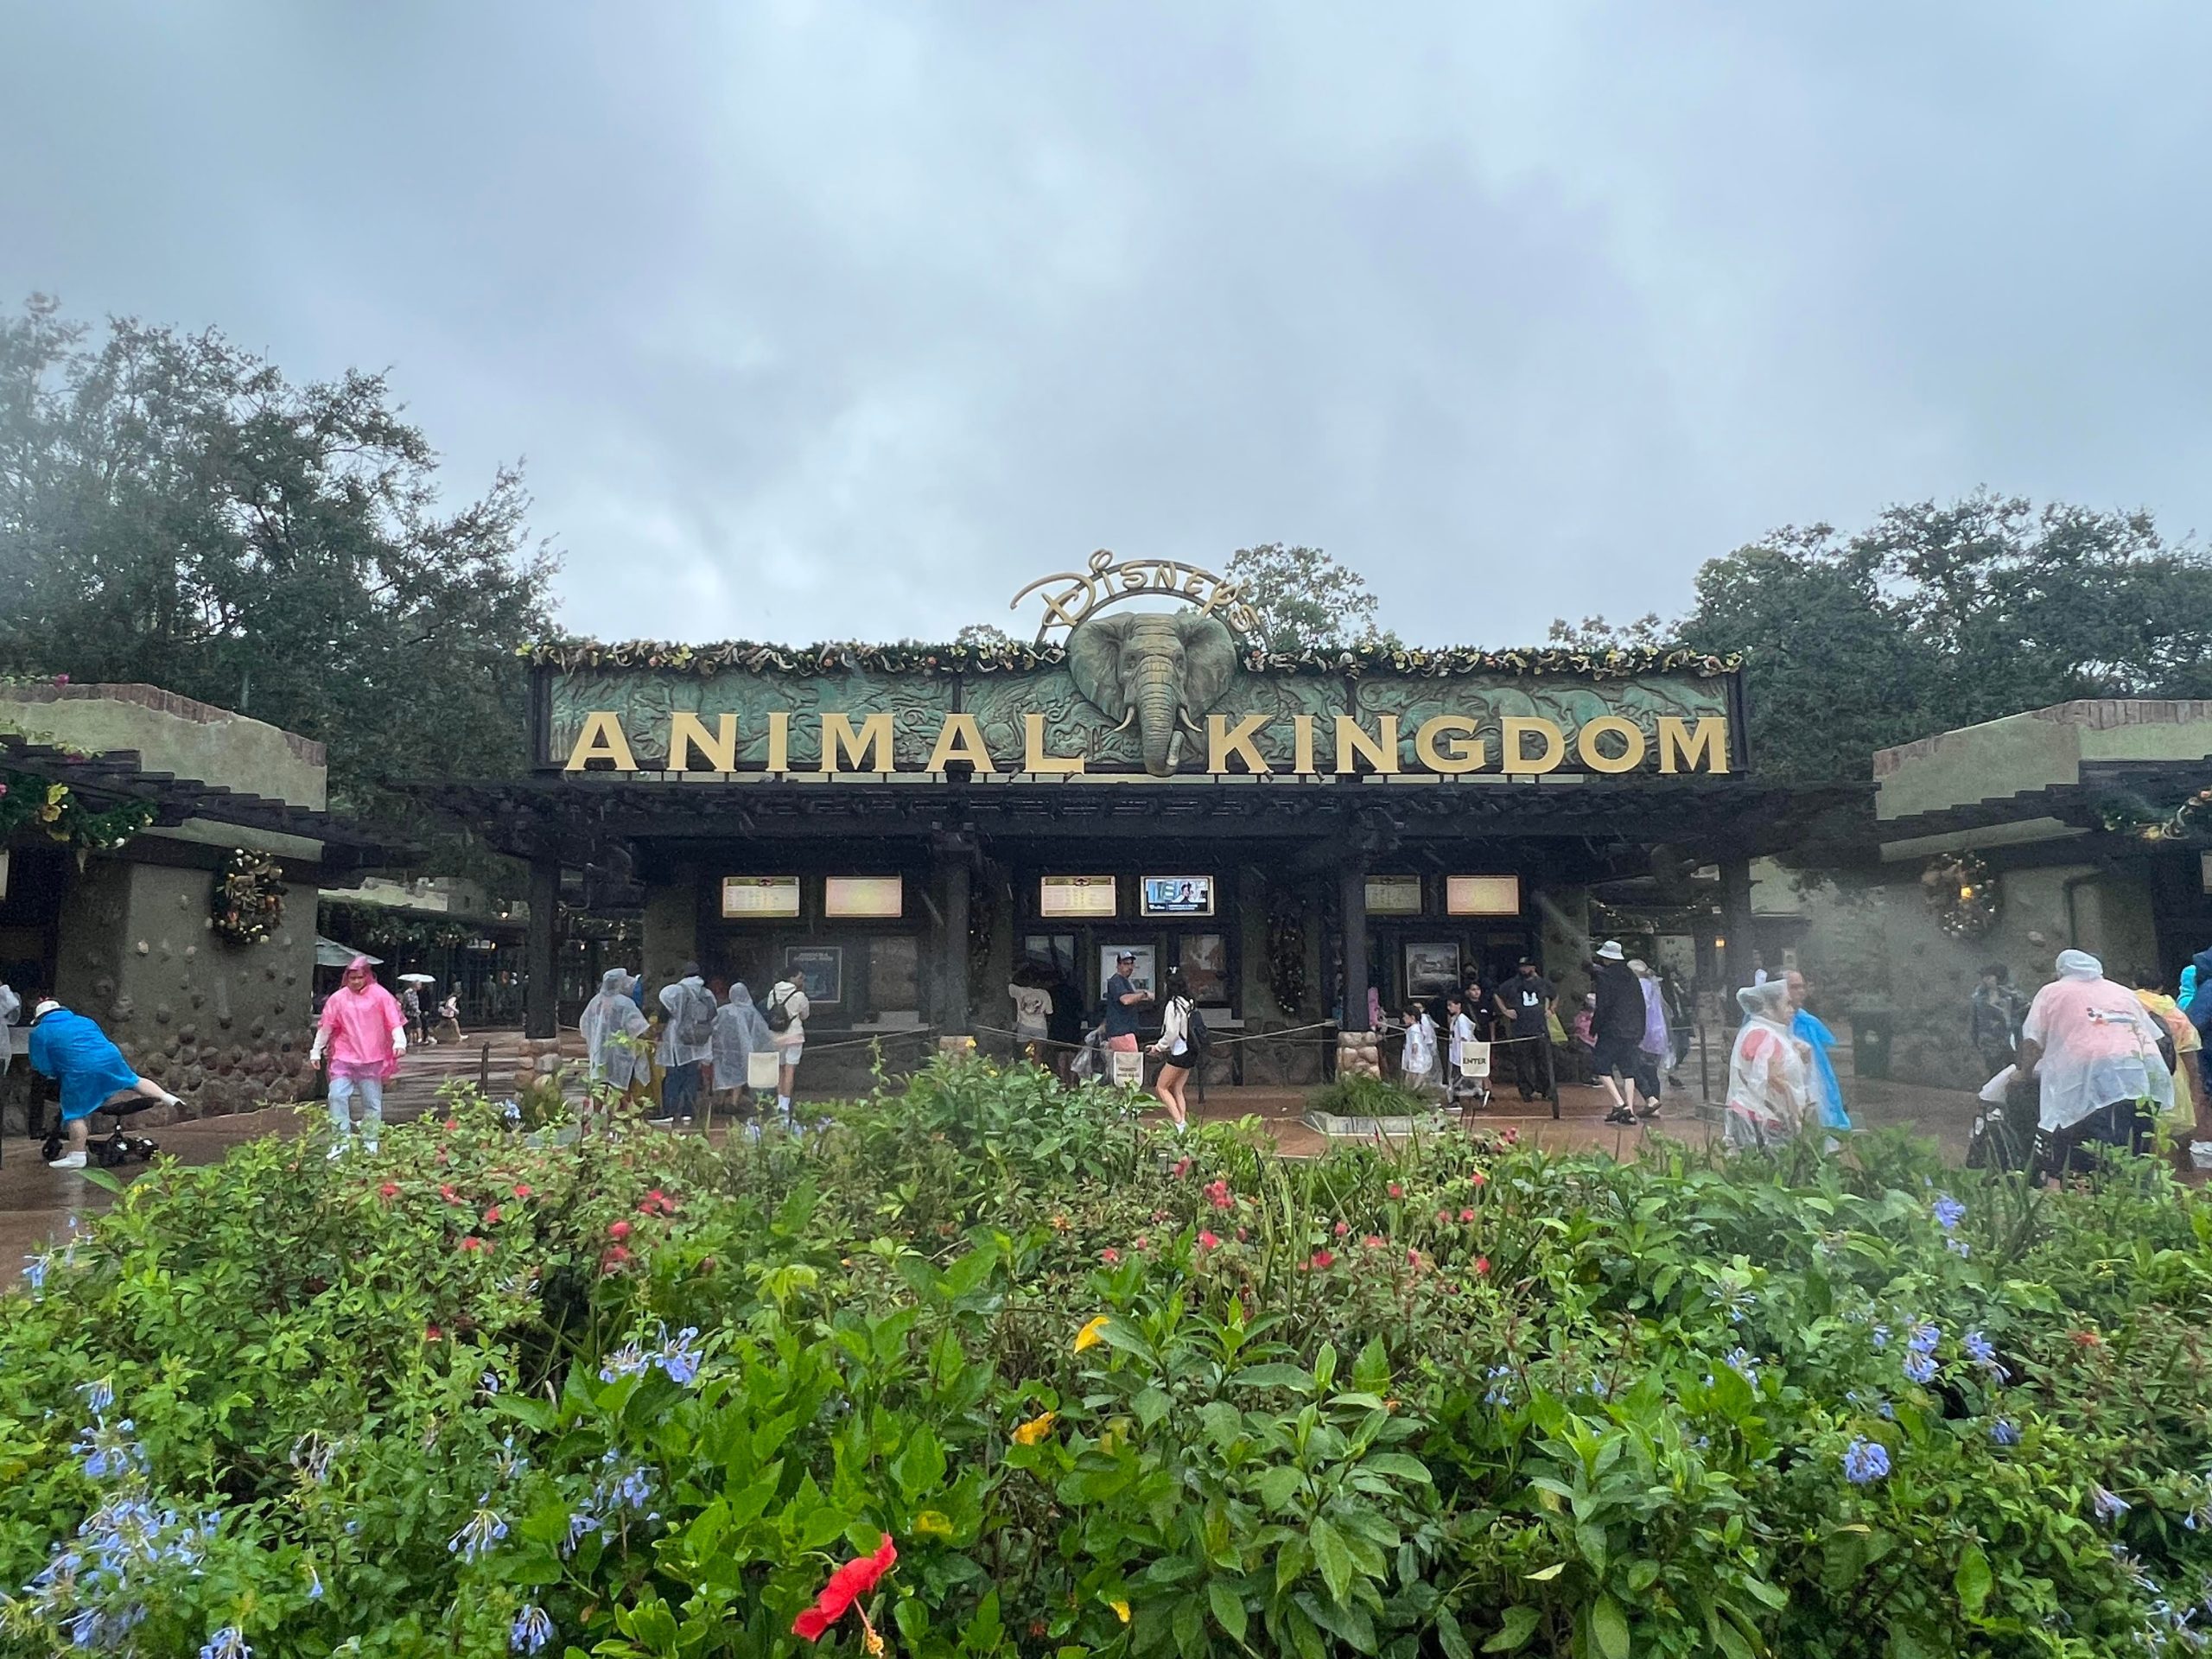
Disney’s Animal Kingdom
I am one of the most passionate Disney fans on the planet, and even I am too scared to visit Walt Disney World during Thanksgiving Week.

Photo: Disney
So, if you were there over the past few days, you’re a braver, better fan than me!
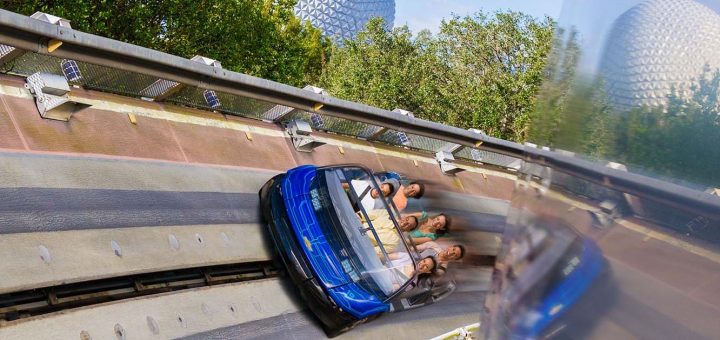
I could never handle crowds like the ones at Avatar Flight of Passage, although it was technically worse the previous week.

Photo: Disney
During Thanksgiving, guests waited for an average of 115 minutes, which is six minutes less than last time.
There’s a mathematical law that infinity plus infinity is just more infinity. That logic applies at Disney parks as well.

Photo: Disney
Once you pass 100 minutes of wait time, the actual difference is negligible. That’s what happened here.
How was the rest of the park? Read on!
- Na’vi River Journey — 73 minutes, up 2
- Adventurers Outpost – 54 minutes, up 3
- Kilimanjaro Safaris – 40 minutes, up 2
- Expedition Everest – 34 minutes, up 2
- DINOSAUR – 24 minutes, down 1
- Kali River Rapids – 17 minutes, up 12
- TriceraTop Spin – 12 minutes, up 2
- It’s Tough to Be a Bug! – 10 minutes, down 5
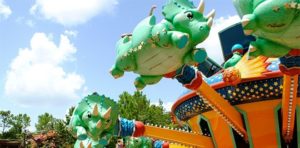
Photo: Disney
Overall, guests waited for an average of 42 minutes, which is two minutes more than last time. Honestly, that’s not bad. I was braced for worse.
However, I will add that the same thing happened with July 4th.
I wonder whether some folks are targeting the week before the holiday for the same reason I do. We will test the theory at the other three parks…
Disney’s Hollywood Studios
How was Star Wars: Rise of the Resistance during Thanksgiving Week? The magic word is borked.

Image Credit: Disney
This attraction has struggled under the weight of constant traffic. It tends to go down and stay down.
Over the holiday, guests waited for an average of 125 minutes, 14 minutes more than last time.
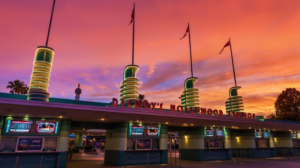
Photo: Disney
Part of the reason that happens is that when the attraction operates for less time, guests are more desperate to ride it during their visits.
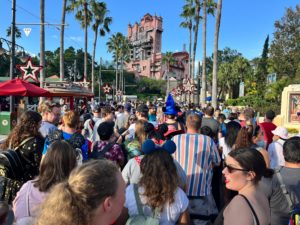
So, the increased wait times become a self-fulfilling prophecy of sorts. The same behavior applies to Twilight Zone Tower of Terror.
Over the holiday, guests waited an average of 84 minutes, 28 minutes less than last time. That’s because it worked better.
Park officials sometimes sneak in refurbs before holiday weeks, which led to a rough start of November for Tower of Terror. Now, it has normalized a bit for Thanksgiving.
Image Credit: Disney
Here’s everything else:
- Slinky Dog Dash – 95 minutes, down 15
- Toy Story Mania! – 65 minutes, down 23
- Millennium Falcon: Smugglers Run – 64 minutes, down 25
- Mickey & Minnie’s Runaway Railway – 61 minutes, down 25
- Rock ‘n’ Roller Coaster Starring Aerosmith – 57 minutes, down 23
- Red Carpet Dreams – 40 minutes, down 3
- Celebrity Spotlight – 37 minutes, up 2
- Alien Swirling Saucers – 35 minutes, down 11
- Meet Sulley at Walt Disney Presents – 33 minutes, down 7
- Star Tours – The Adventures Continue! – 20 minutes, down 11
- Lightning McQueen’s Racing Academy – 10 minutes, down 5
- Muppet*Vision 3D – 10 minutes, down 5
Overall, guests waited an average of 48 minutes at Hollywood Studios, 12 minutes less than last time.
You may recall that I mentioned last week that the park had one of the highest wait time averages I could ever recall.
We may have tracked several different simultaneous flukes that didn’t repeat themselves during the holiday.
EPCOT
Usually, EPCOT provides safe harbor at Walt Disney World. Was that true during the holiday? Well…
- Remy’s Ratatouille Adventure – 103 minutes, up 13
- Frozen Ever After – 90 minutes, up 14
- Test Track – 61 minutes, up 6
- Soarin’ Around the World – 38 minutes, down 10
- Royal Sommerhus – 35 minutes, down 3
- Mission: SPACE – 21 minutes, down 4
- Turtle Talk with Crush – 20 minutes, up 5
- Spaceship Earth – 15 minutes, down 7
- The Seas with Nemo & Friends – 13 minutes, down 2
- Gran Fiesta Tour Starring the Three Caballeros – 10 minutes, up 3
- Living with the Land – 9 minutes, down 1
- Journey into Imagination with Figment – 7 minutes, down 2

Photo: Disney
Overall, guests at EPCOT stood in line for an average of 32 minutes per attraction last week, two minutes more than last time.
I’ll add that this park’s behavior strikes me as the most predictable that we’ve tracked thus far. This is about what should have happened everywhere.
Photo: Disney
We had modest increases for the top attractions and then sameness for the rest.
Magic Kingdom
Last week, Magic Kingdom had a weird week where overall wait times declined significantly.
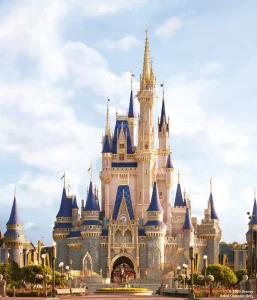
Photo: Disney Parks
I’ll tell you right now that this week’s data shows slightly longer waits, but nothing strikes me as unreasonable. Take a look:
- Seven Dwarfs Mine Train – 73 minutes, up 2
- Peter Pan’s Flight – 67 minutes, up 2
- Jingle Cruise – 63 minutes, down 4
- Space Mountain – 50 minutes, up 6
- Haunted Mansion – 41 minutes, no change
- Big Thunder Mountain Railroad – 39 minutes, up 17
- Town Square Theater – 38 minutes, down 4
- Buzz Lightyear’s Space Ranger Spin – 37 minutes, down 3
- Princess Fairytale Hall – 36 minutes, down 1
- Splash Mountain – 35 minutes, up 22
- The Many Adventures of Winnie the Pooh – 34 minutes, no change
- Under the Sea ~ Journey of the Little Mermaid – 30 minutes, up 19
- Astro Orbiter – 29 minutes, up 20
- It’s a Small World – 27 minutes, down 3
- Pirates of the Caribbean – 25 minutes, no change
- The Barnstormer – 22 minutes, up 15
- The Magic Carpets of Aladdin – 20 minutes, up 13
- Dumbo the Flying Elephant – 19 minutes, up 14
- Tomorrowland Speedway – 17 minutes, up 10
- Mad Tea Party – 14 minutes, up 6
- Prince Charming Regal Carrousel – 13 minutes, up 3
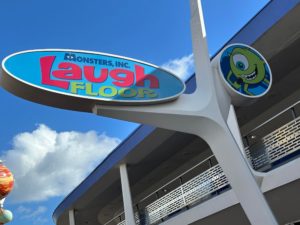
- Monsters, Inc. Laugh Floor – 11 minutes, down 9
- Walt Disney’s Carousel of Progress – 5 minutes, no change
- Country Bear Jamboree – 5 minutes, no change
About Magic Kingdom Wait Times
Overall, guests waited for an average of 30 minutes, six minutes more than last week. However, this data requires one explanation.
Two weeks ago, the weather in Florida took something of a turn. So, the outdoor attractions grew wildly unpopular, especially the wet rides.
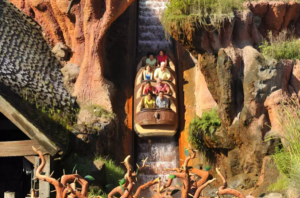
Photo: Disney
For this reason, wet rides like Kali River Rapids and Splash Mountain witnessed huge drops last time followed by massive increases now.
Similarly, spinner rides or anything that whipped the chilly wind in your face generally declined.
Photo: Disney
If not for that phenomenon, Magic Kingdom would have been largely the same during the last two weeks.
Overall, I think it’s fair to say that some tourists have decided to show up before holiday weeks than during them.