Walt Disney World Wait Times for First Week of November 2022

Okay, we’ve officially left the Halloween season in the dust. Next stop: Christmas!
Half of the next two months will involve some of the most crowded times of the year at Disney. The other half will vary, depending on the calendar.
Yes, I know that’s weird, but consumer behavior gets strange during the last two months of the year.
So, let’s evaluate the wait times for the first week of November.
Disney’s Animal Kingdom
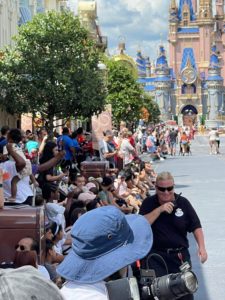
Okay, this is one of those articles I write about the time I spent at the parks. So I have firsthand knowledge that this start of November was crazier than many recent ones.
The one thing we did have was hot weather. The temperature reached 90 degrees on each of the first four days of the month, which is unusual, even in the era of global warming.

Photo: DisTripQueen
How did this impact the parks? Well, Avatar Flight of Passage increased dramatically. Guests waited an average of 112 minutes, up 18 minutes from the last time.
Interestingly, Na’vi River Journey didn’t display the same effect. Instead, its wait increased from 70 to 74 minutes.

Photo: TouringPlans.com
Here are the other average wait times at Animal Kingdom:
- Kilimanjaro Safaris – 52 minutes, up 4
- Adventurers Outpost – 46 minutes, up 2
- Expedition Everest – 30 minutes, no change
- Kali River Rapids – 27 minutes, down 2
- DINOSAUR – 24 minutes, up 2
- TriceraTop Spin – 12 minutes, up 3
- It’s Tough to Be a Bug! – 10 minutes, up 2

Photo: Disney
Overall, guests waited an average of 44 minutes, a seven-minute increase from the last time.
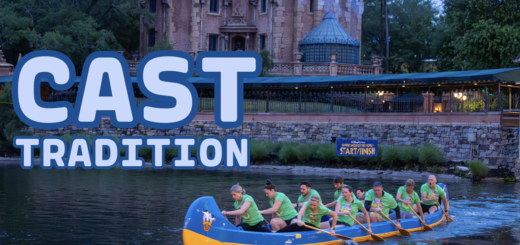
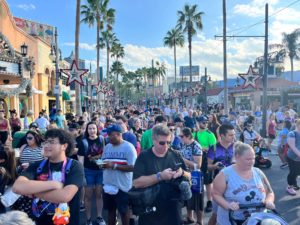
This seems like a good time to mention that we’re also tracking a different anomaly this week. There was a runDisney event.

Photo:disney
In fact, this past weekend featured the first true runDisney races since the pandemic’s end.
I’ve been working under the assumption that will impact wait times at least some.

Credit: Disney
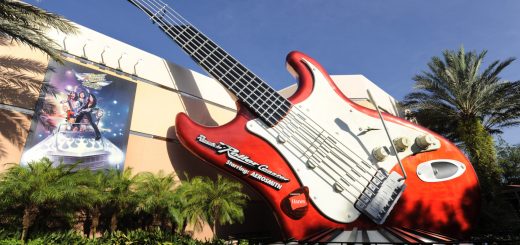
Disney’s Hollywood Studios
Last week, we had our latest Murphy’s Law day at Hollywood Studios when a Lightning Lane reservation at Star Wars: Rise of the Resistance went very wrong.
Disney continues to struggle with keeping this attraction online. When it’s down for a while, the lines grow massive.
Photo credit: DisneyWorldVacationGuide.com
To wit, guests waited an average of 117 minutes, 17 minutes more than last time. I completely believe that average, too. Its wait hovered at two hours the whole time we were there.
Here are the other Hollywood Studios attractions:
- Slinky Dog Dash – 100 minutes, up 13
- Toy Story Mania! – 72 minutes, up 2
- Rock ‘n’ Roller Coaster Starring Aerosmith – 71 minutes, up 2
- Millennium Falcon: Smugglers Run – 67 minutes, down 2
- Twilight Zone Tower of Terror – 65 minutes, up 16
- Mickey & Minnie’s Runaway Railway – 63 minutes, up 1
- Red Carpet Dreams – 49 minutes, up 4
- Alien Swirling Saucers – 41 minutes, up 7
- Celebrity Spotlight – 32 minutes, n/a
- Star Tours – The Adventures Continue! – 29 minutes, up 8
- Meet Sulley at Walt Disney Presents – 24 minutes, down 5
- Lightning McQueen’s Racing Academy – 15 minutes, up 1
- Muppet*Vision 3D – 10 minutes, no change
Overall, the news wasn’t as bad as it might sound at Hollywood Studios. On the one hand, guests waited at least an hour at seven different attractions.
However, the average attraction required a wait of 55 minutes, which is only three minutes more than last time. We’ll take that.

Photo: Matt Stroshane
EPCOT
Speaking of rides that tear up a lot, Remy’s Ratatouille Adventure had a really rough week.
We got trapped here for about 15 minutes, and it was spectacular! We were in some sort of weird room that was supposed to be under the kitchen table.
The echo in this place was outrageous! Also, whispers sounded like screams!
I have no point here. I just wanted to share. Anyway, guests waited an average of 91 minutes, an increase of 27 minutes. And I believe that number.

Credit: Disney
Technically, Frozen Ever After required the longest wait at 95 minutes, a 20-minute increase. But I didn’t have any anecdotes about it.
Here are the other average waits at EPCOT last week:
- Test Track – 72 minutes, up 9
- Soarin’ Around the World – 59 minutes, up 9
- Royal Sommerhus – 43 minutes, up 11
- Mission: SPACE – 26 minutes, up 14
- The Seas with Nemo & Friends – 21 minutes, up 12
- Spaceship Earth – 19 minutes, up 4
- Living with the Land – 18 minutes, up 12
- Gran Fiesta Tour Starring the Three Caballeros – 16 minutes, up 6
- Journey into Imagination with Figment – 15 minutes, up 5
- Turtle Talk with Crush – 10 minutes, up 3
Photo: Disney
Overall, guests waited an average of 40 minutes, a massive increase of 12 minutes. So, the swarm of marathon runners impacted EPCOT the most.
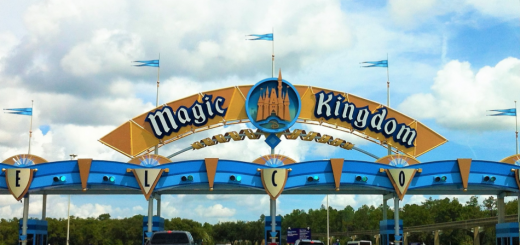
Magic Kingdom
You get the gist. So, here are the wait times for Magic Kingdom’s attractions:
- Seven Dwarfs Mine Train – 92 minutes, up 24
- Peter Pan’s Flight – 77 minutes, up 14
- Jingle Cruise – 70 minutes, up 13
- Splash Mountain – 60 minutes, up 14
- Haunted Mansion – 59 minutes, up 14
- Buzz Lightyear’s Space Ranger Spin – 55 minutes, up 19
- Princess Fairytale Hall – 50 minutes, up 10
- Space Mountain – 49 minutes, up 5
- Pirates of the Caribbean – 48 minutes, up 9
- Town Square Theater – 47 minutes, up 2
- The Many Adventures of Winnie the Pooh – 46 minutes, up 13
- Big Thunder Mountain Railroad – 44 minutes, up 9
- Under the Sea ~ Journey of the Little Mermaid – 42 minutes, up 16
- It’s a Small World – 40 minutes, up 16
- Astro Orbiter – 35 minutes, up 4
- Dumbo the Flying Elephant – 32 minutes, up 14
- Magic Carpets of Aladdin – 30 minutes, up 9
- The Barnstormer – 29 minutes, up 13
- Tomorrowland Speedway – 21 minutes, up 9
- Mad Tea Party – 20 minutes, up 9
- Tomorrowland Transit Authority PeopleMover – 19 minutes, up 9
- Monsters, Inc. Laugh Floor – 18 minutes, up 10
- Prince Charming Regal Carrousel – 16 minutes, up 10
- Mickey’s PhilharMagic – 15 minutes, up 6
- Walt Disney’s Carousel of Progress – 5 minutes, no change
- Country Bear Jamboree – 5 minutes, no change
Photo: TripAdvisor
The average wait at Magic Kingdom this past week was 41 minutes, which is 11 minutes more than last time.
I interpret this data as the marathon impacting data more than the start of the holiday season.
Photo: Disney
Halloween also fell on a Monday, which probably altered some vacation travel dates.
Still, all four parks increased their wait times and crowd sizes significantly. So that’s something to monitor throughout November.
Thanks for visiting MickeyBlog.com! Want to go to Disney? For a FREE quote on your next Disney vacation, please fill out the form below and one of the agents from MickeyTravels, a Platinum level Authorized Disney Vacation Planner, will be in touch soon!
Feature Photo: Disney