Walt Disney World Wait Times for the Fourth Week of September 2022
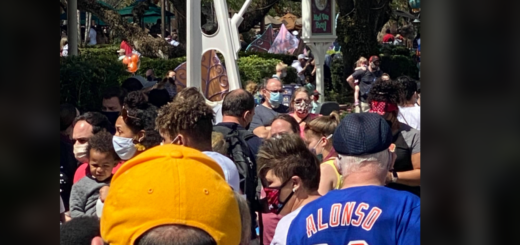
We’re still in the slow season at Walt Disney World, at least for a couple more weeks.
Generally, the crowds don’t pick up again until the middle of October. However, 2022 has marched to its own drum at theme parks.
So, how were the wait times at Walt Disney World this past week? Let’s have a look!
Disney’s Animal Kingdom
I should stress in advance that Hurricane Ian doesn’t impact this week’s data.
That’ll happen next time, as Disney has already announced park closures on Wednesday and Thursday as a minimum.
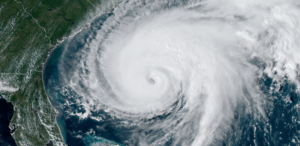
Photo: NOAA
With a maximum of five days in operation, next week’s data will be more skewed than usual. That’s because we’re missing nearly 30 percent of the information.
But that’s Next Week David’s problem. I do NOT envy that guy.
Today David knows that Avatar Flight of Passage averaged a wait of 68 minutes, an increase of 12 minutes.
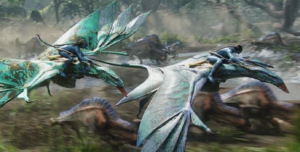
Photo: Disney
We had noted at the time that the augmented reality ride dropped a significant amount last time. So, this wait suggests a return to normal more than anything else.
Here’s every other attraction at Animal Kingdom:
- Na’vi River Journey — 62 minutes, up 1
- Adventurers Outpost — 38 minutes, up 2
- Kilimanjaro Safaris — 32 minutes, down 2
- Kali River Rapids — 28 minutes, down 2
- Expedition Everest — 22 minutes, down 3
- DINOSAUR — 17 minutes, no change
- It’s Tough to Be a Bug! – 10 minutes, no change
- TriceraTop Spin – 6 minutes, no change
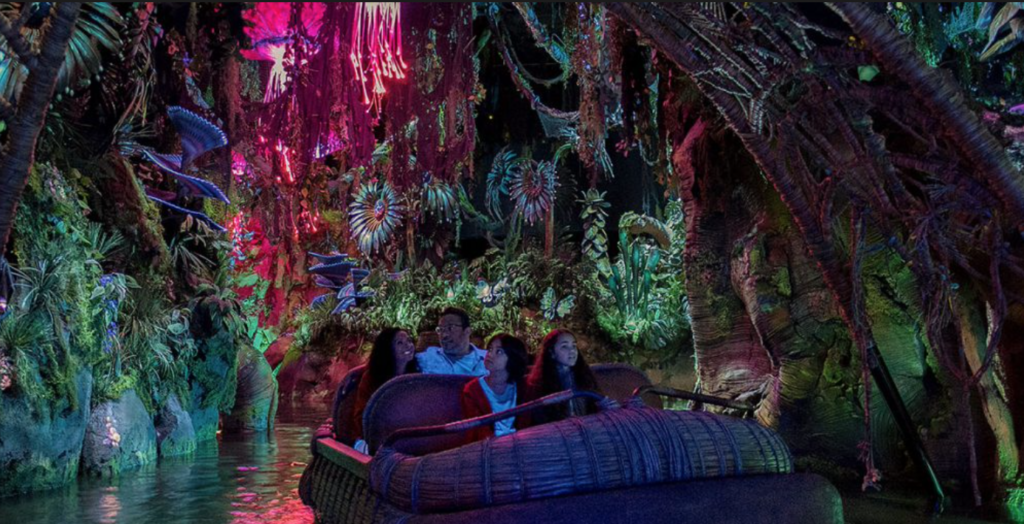
Photo: D23
Overall, guests waited an average of 32 minutes, a two-minute increase from last time. Again, Avatar Flight of Passage reflects most of the change here.
Disney’s Hollywood Studios
Photo: Disney
As usual, guests spent the most time in line at Star Wars: Rise of the Resistance.
People waited an average of 98 minutes, an increase of nine minutes or about 10 percent from last week.
So, we’re trending toward more substantial crowds throughout Walt Disney World.

Image Credit: Disney
Here are the other wait times for comparison:
- Slinky Dog Dash – 89 minutes, up 12
- Rock ‘n’ Roller Coaster Starring Aerosmith – 62 minutes, up 5
- Mickey & Minnie’s Runaway Railway – 59 minutes, up 3
- Twilight Zone Tower of Terror – 58 minutes, up 11
- Toy Story Mania! – 57 minutes, up 2
- Millennium Falcon: Smuggler’s Run – 56 minutes, up 2
- Red Carpet Dreams – 47 minutes, up 6
- Alien Swirling Saucers – 37 minutes, up 3
- Meet Sulley at Walt Disney Presents – 35 minutes, down 1
- Celebrity Spotlight – 26 minutes, up 2
- Lightning McQueen’s Racing Academy – 13 minutes, down 1
- Star Tours – The Adventures Continue! 12 minutes, down 4
- Muppet*Vision 3D – 10 minutes, no change
So, we are definitely witnessing an overall increase. Guests stood in line an average of 40 minutes for each Hollywood Studios attraction. That’s a two-minute increase from last time.
Overall, Hollywood Studios only operated three attractions that required a wait of 60+ minutes. However, four more were at 56-59 minutes, which isn’t much better.
EPCOT

Photo: Disney
Okay, we’ve got two parks that are slightly up this week but mostly a draw. So, how was EPCOT, which is usually the slowest park?
For the past seven days, Frozen Ever After required the longest wait. Guests spent an average of 67 minutes in line, an 8-minute increase.

Photo: Disney
Second place belongs to Remy’s Ratatouille Adventure, which experienced modestly longer lines. For the past week, guests waited 58 minutes, four more minutes than last time.
Test Track, the other member of the park’s Big Three, averaged a 52-minute wait, nine minutes more than last time.
Here are the other EPCOT attractions:
- Soarin’ Around the World – 32 minutes, no change
- Royal Sommerhus – 24 minutes, up 4
- Living with the Land – 16 minutes, up 6
- Mission: SPACE – 15 minutes, down 1
- Spaceship Earth – 12 minutes, up 4
- Journey into Imagination with Figment – 11 minutes, up 4
- Turtle Talk with Crush – 10 minutes, up 3
- Gran Fiesta Tour Starring the Three Caballeros – 7 minutes, up 1
- The Seas with Nemo & Friends – 6 minutes, up 1
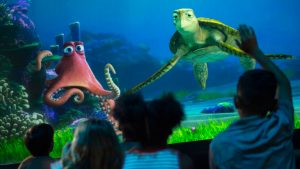
Photo: Disney
Overall, attractions averaged a wait of 23 minutes, four minutes more than last time.
So, I think it’s safe to say that we’re not witnessing the usual September slowdown at the parks.
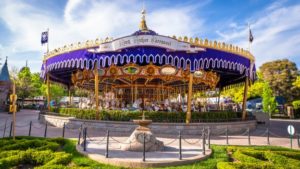
Magic Kingdom
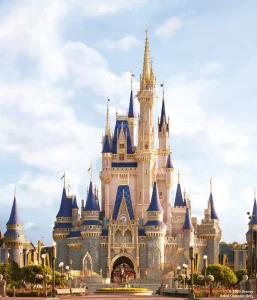
Photo: Disney Parks
Okay, here are the average waits at the Most Magical Place on Earth:
- Seven Dwarfs Mine Train – 63 minutes, up 8
- Peter Pan’s Flight – 61 minutes, up 5
- Jungle Cruise – 51 minutes, up 6
- Town Square Theater – 49 minutes, up 7
- Haunted Mansion – 42 minutes, up 7
- Splash Mountain – 41 minutes, up 4
- Princess Fairytale Theater – 38 minutes, up 6
- Space Mountain – 34 minutes, up 6
- Big Thunder Mountain Railroad – 31 minutes, up 4
- Buzz Lightyear’s Space Ranger Spin – 28 minutes, up 7
- The Many Adventures of Winnie the Pooh – 27 minutes, up 2
- Pirates of the Caribbean – 26 minutes, up 2
- Astro Orbiter – 25 minutes, up 8
- Under the Sea ~ Journey of the Little Mermaid – 18 minutes, up 4
- It’s a Small World – 17 minutes, up 4
- Magic Carpets of Aladdin – 14 minutes, up 5
- Tomorrowland Speedway – 13 minutes, up 2
- The Barnstormer – 10 minutes, up 3
- Monsters, Inc. Laugh Floor – 10 minutes, up 3
- Mickey’s PhilharMagic – 9 minutes, down 1
- Dumbo the Flying Elephant – 8 minutes, no change
- Mad Tea Party – 7 minutes, no change
- Tomorrowland Transit Authority PeopleMover – 8 minutes, up 2
- Prince Charming Regal Carrousel – 7 minutes, up 2
- Walt Disney’s Carousel of Progress – 5 minutes, no change
- Country Bear Jamboree – 5 minutes, no change
Overall, Magic Kingdom attractions required a 28-minute wait, a three-minute increase from last time.
So, the parks were universally more crowded than the prior week…but only slightly.