Walt Disney World Wait Times for Last Week of June 2022
Thus far in June, Walt Disney World has performed remarkably with regard to crowd control.
Sure, summer vacation has started pretty much everywhere in North America. Even so, the waits for Disney attractions have remained static.
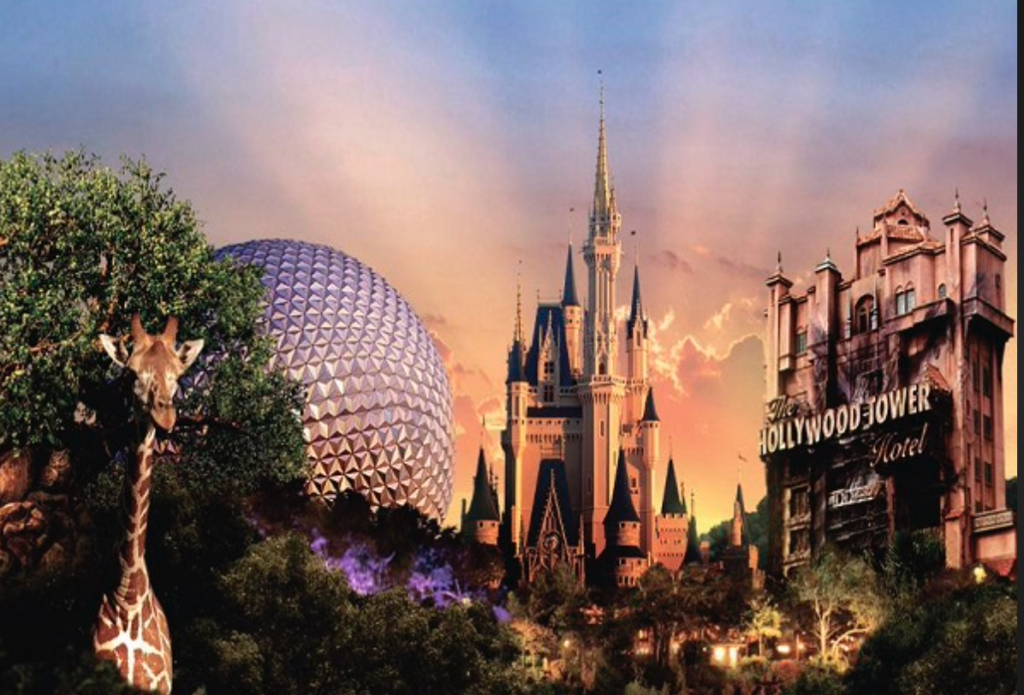
Photo: orlandoattractions.com
That’s one of the secret goals of park management. You want the lines to remain the same size the entire year.
This premise is rarely feasible, but it’s proven true thus far in June. Was that true during the month’s final week? Let’s check.
Here are the Walt Disney World wait times for the last week of June 2022.
Disney’s Animal Kingdom
As usual, we can tell plenty from the wait time for Animal Kingdom’s most popular attraction, Avatar Flight of Passage.
Credit: Disney
For the past week, guests waited an average of 107 minutes, right in line with 109 minutes the previous week.
Meanwhile, Na’vi River Journey dropped 14 minutes with an overall wait of 70 minutes on average. So color me optimistic about today’s update!
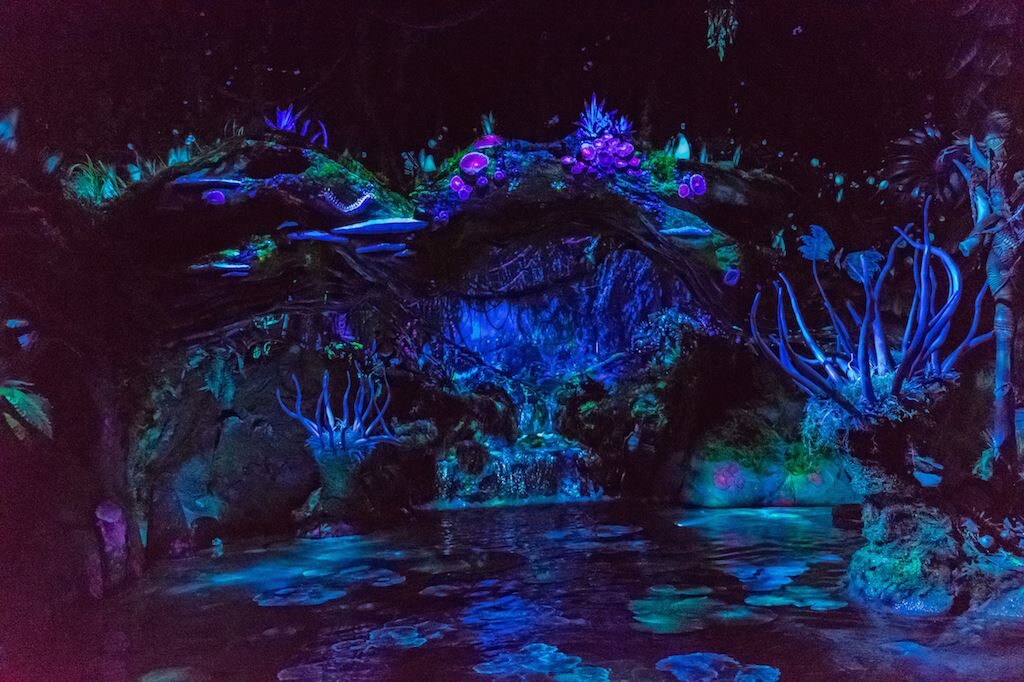
Photo: TouringPlans.com
Here’s everything else at Animal Kingdom:
- Kali River Rapids – 63 minutes, up 8
- Kilimanjaro Safaris – 55 minutes, down 5
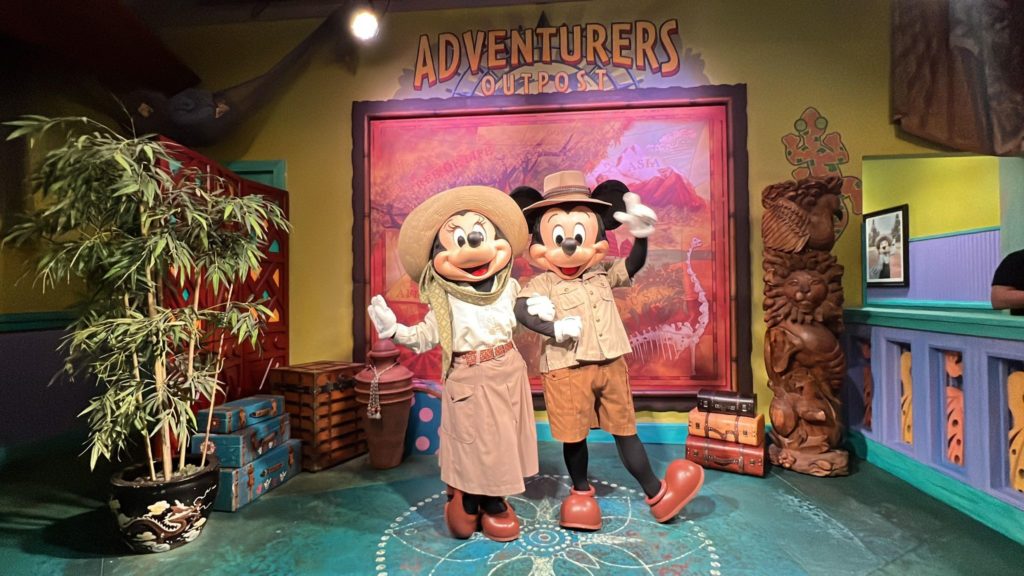
- Adventurers Outpost – 50 minutes, N/A
- DINOSAUR – 40 minutes, up 2
- Expedition Everest – 39 minutes, no change
- TriceraTop Spin – 15 minutes, up 4
- It’s Tough to Be a Bug! – 14 minutes, down 3
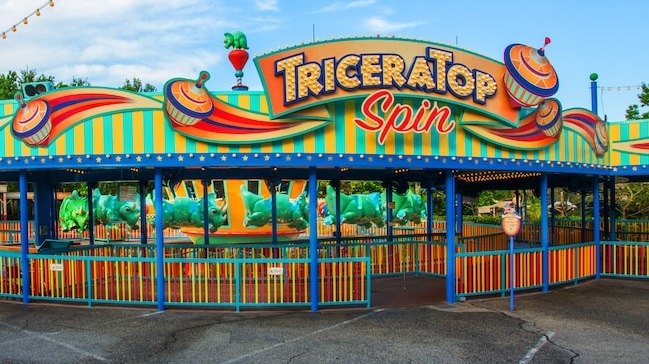
Photo: Disney
I should add a few notes here. First, TriceraTop Spin wasn’t open the entire week. So, its data is a bit skewed this time.
Similarly, Adventurers Outpost hadn’t offered its character greeting since the pandemic’s start.
As previously discussed, that creates a rush factor dynamic as tourists try to check off the things on their list that were previously unavailable.
Simply stated, character greetings are much more popular this year than they were in 2019 because we all missed them.
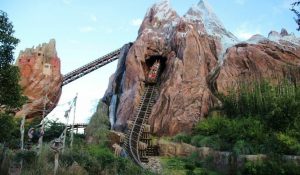
Image Credit: Disney
To summarize, the average Animal Kingdom attraction required a wait of 50 minutes, down three minutes.
Theoretically, whenever a park adds more attractions, its average wait should go down some. As such, I’m not reading too much into this yet.
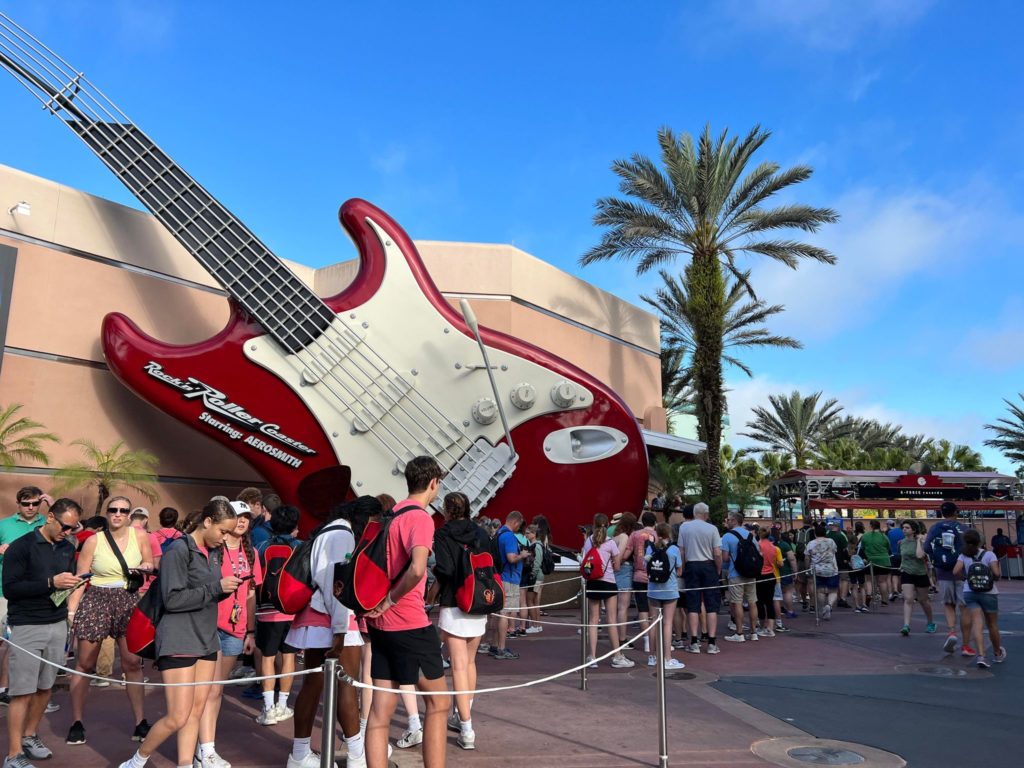
Disney’s Hollywood Studios
The park that worries me the most as we enter July is Hollywood Studios. Even during the offseason, this park’s wait times can get crazy.
During a recent week, eight different attractions required a wait of 60+ minutes. Even Magic Kingdom rarely claims that dubious distinction.
So, Hollywood Studios appears likely to take a turn for the, well, insane over the next month.
How has the park finished in June? Star Wars: Rise of the Resistance, the most popular attraction here, averaged a wait of 111 minutes, down 14 minutes from last time.

Photo: Matt Stroshane
Conversely, the second-most popular attraction, Slinky Dog Dash, increased seven minutes to 97 minutes.
How was everything else at Hollywood Studios? Take a look:
- Millennium Falcon: Smugglers Run – 78 minutes, up 3
- Toy Story Mania! – 75 minutes, up 10
- Twilight Zone Tower of Terror – 73 minutes, down 33
- Mickey & Minnie’s Runaway Railway – 64 minutes, no change
- Rock ‘n’ Roller Coaster Starring Aerosmith – 63 minutes, down 5
- Red Carpet Dreams – 40 minutes, down 7
- Alien Swirling Saucers – 39 minutes, down 6
- Star Tours – The Adventures Continue! – 25 minutes, down 5
- Celebrity Spotlight – 24 minutes, down 6
- Lightning McQueen’s Racing Academy – 18 minutes, up 3
- Muppet*Vision 3D – 10 minutes, no change
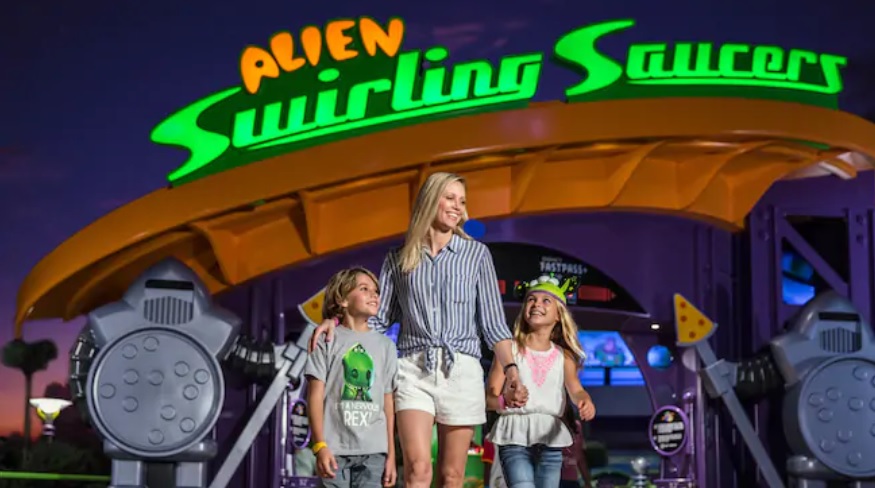
Photo: Disney
Overall, guests waited 50 minutes per attraction at Hollywood Studios, the same as Animal Kingdom. That’s a drop of three minutes from last week.
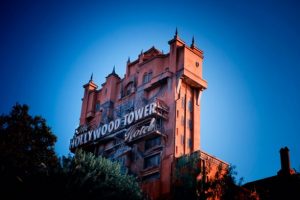
Photo: Disney
The park still registered seven attractions with 60+ minute waits, though, which is less than ideal.
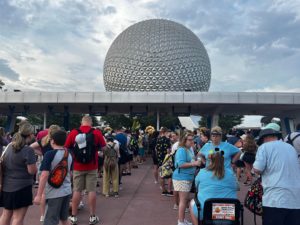
EPCOT
Until the end of May, EPCOT reliably offered the shortest waits at Walt Disney World.
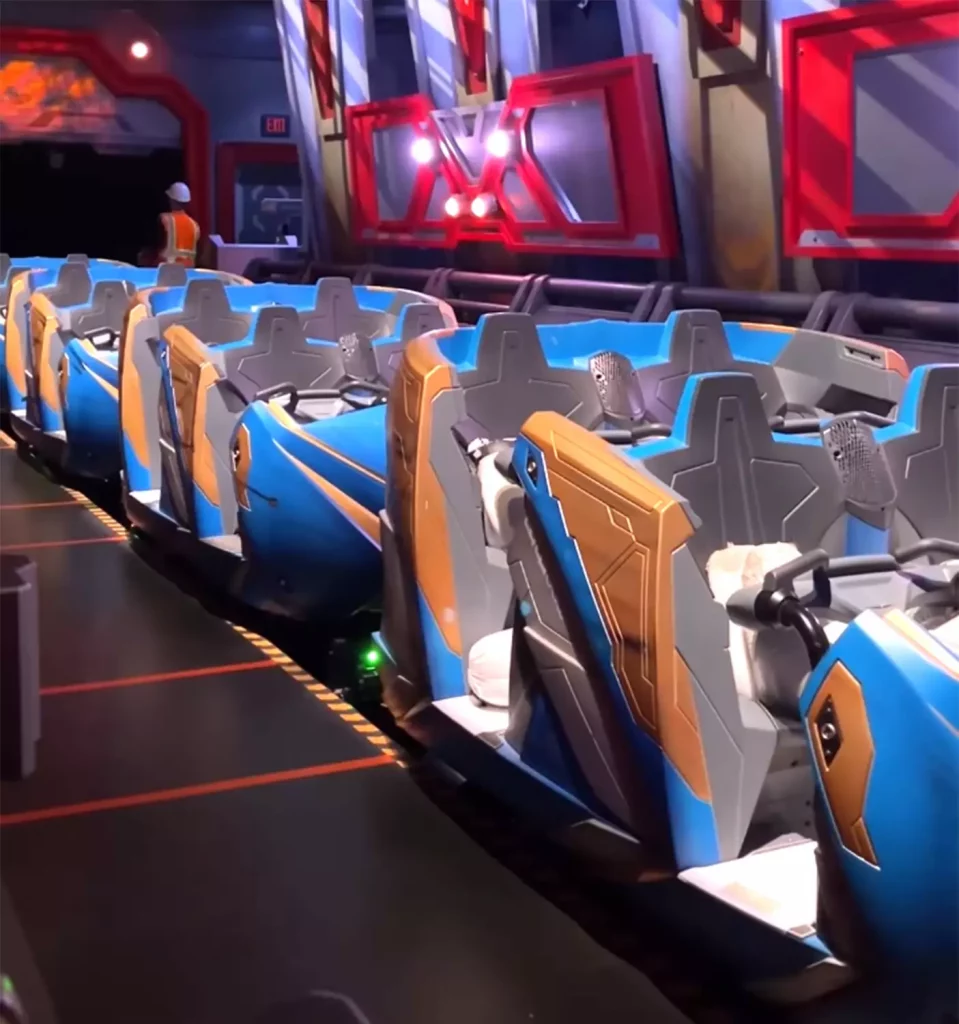
Since then, the introduction of Guardians of the Galaxy: Cosmic Rewind has muddied the waters a bit.
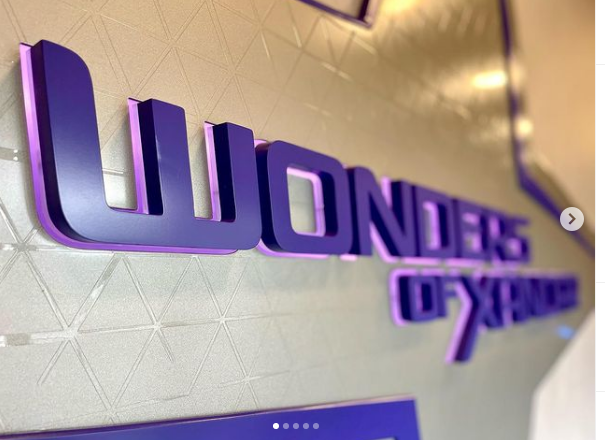
Guests definitely spend more time at EPCOT in hopes of riding the pride of the Wonders of Xandar pavilion.
However, we’re still not tracking this attraction’s wait time. It still doesn’t offer a standby queue and likely won’t until after Labor Day at the earliest.
Until then, Frozen Ever After and Remy’s Ratatouille Adventure will continue to top the wait time list at EPCOT.

Image Credit: Disney
For the most recent week, Frozen Ever After required the last wait. Its 80-minute wait is the same as last time.
Meanwhile, Ratatouille dropped three minutes to 77 minutes. So when you visit the park, you should just expect to build your day around these two rides.
Here are the other average waits at EPCOT:
- Test Track – 71 minutes, up 1
- Soarin’ Around the World – 59 minutes, down 1
- Mission: SPACE – 45 minutes, no change
- Royal Sommerhus – 30 minutes, up 3
- Spaceship Earth – 25 minutes, no change
- The Seas with Nemo & Friends – 23 minutes, up 3
- Turtle Talk with Crush – 22 minutes, down 2
- Journey into Imagination with Figment – 20 minutes, up 5
- Living with the Land – 19 minutes, up 1
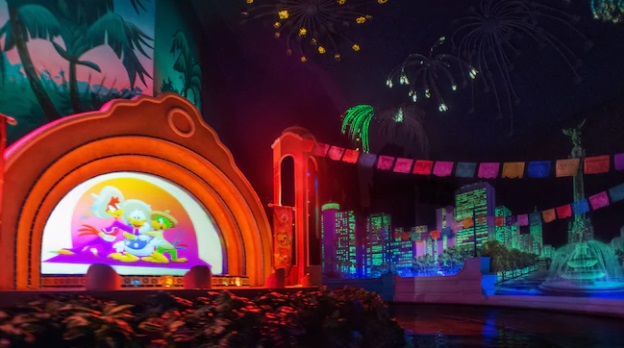
- Gran Fiesta Tour Starring the Three Caballeros – 15 minutes, up 1
That’s precisely the sort of static movement management prefers!
Overall, guests waited for an average of 39 minutes per attraction at EPCOT, the same as last week.
Walt Disney World has had an excellent June.
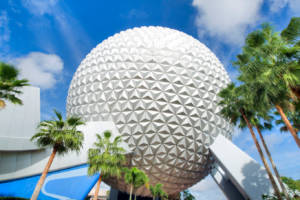
Photo: Todaysorlando.com
Magic Kingdom
We will confirm this assertion with the Magic Kingdom data. Or not.
- Seven Dwarfs Mine Train – 110 minutes, up 29
- Jungle Cruise – 83 minutes, up 12
- Peter Pan’s Flight – 78 minutes, up 3
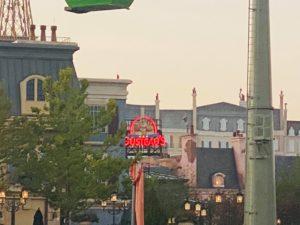
- Splash Mountain – 75 minutes, up 10
- Haunted Mansion – 60 minutes, up 14
- Pirates of the Caribbean – 55 minutes, up 12
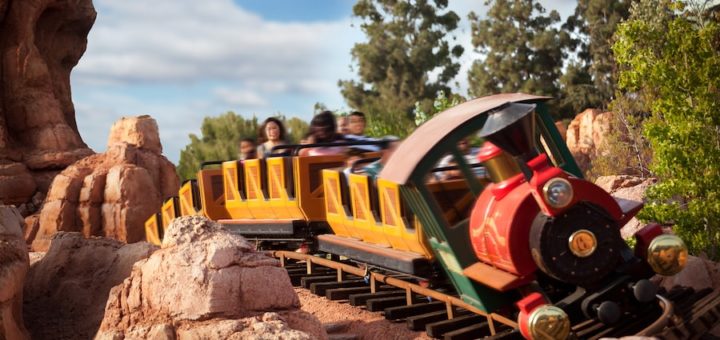
- Buzz Lightyear’s Space Ranger Spin – 52 minutes, up 7
- Big Thunder Mountain Railroad – 51 minutes, up 7
- Astro Orbiter – 49 minutes, up 11
- Princess Fairytale Hall – 47 minutes, down 2
- The Many Adventures of Winnie the Pooh – 45 minutes, up 5
- Town Square Theater – 42 minutes, no change
- It’s a Small World – 41 minutes, up 6
- Under the Sea ~ Journey of the Little Mermaid – 37 minutes, up 7
- Tomorrowland Speedway – 31 minutes, up 3
- Magic Carpets of Aladdin – 29 minutes, up 5
- The Barnstormer – 28 minutes, up 5
- Dumbo the Flying Elephant – 27 minutes, up 6
- Mickey’s PhilharMagic – 25 minutes, up 6
- Tomorrowland Transit Authority PeopleMover – 21 minutes, up 4
- Monsters, Inc. Laugh Floor – 20 minutes, no change
- Mad Tea Party – 18 minutes, up 2
- Prince Charming Regal Carrousel – 14 minutes, no change
- Walt Disney’s Carousel of Progress – 5 minutes, no change
- Country Bear Jamboree – 5 minutes, no change
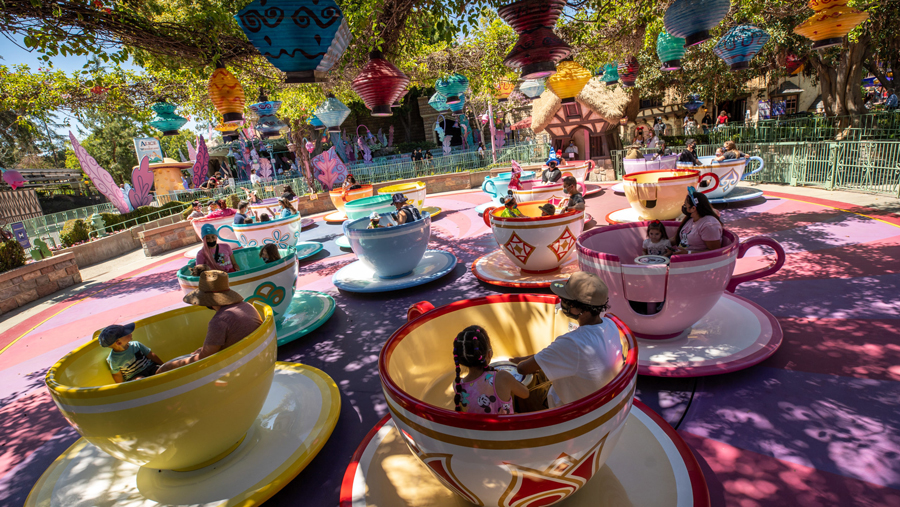
Photo: Disney
Overall, guests waited 45 minutes at Magic Kingdom, an increase of…ten minutes. I don’t know why it was up so much, but that’s a weird anomaly.
Generally, Walt Disney World remained calm this week, but there was a demonstrable spike in traffic at Magic Kingdom.