Disneyland Wait Times for May 2022
The Happiest Place on Earth enjoys warm weather throughout the year. However, the start of April signifies that Spring is in the air.
At this time of the year, park guests know that their visits will come with some of the most comfortable temperatures of the entire year.

Photo: DIsneyland
On top of that, Spring Break and the Easter holiday work in tandem to lure guests to the parks.
For these reasons, we should expect Disneyland’s wait times to increase from last time.

(Richard Harbaugh/Disneyland Resort)
The lone caveat is that people don’t tend to spend a week at Disneyland the way that they do at Walt Disney World.
So, the holiday crowd bump may not impact the bottom line much. Let’s check and see!
Disneyland Resort
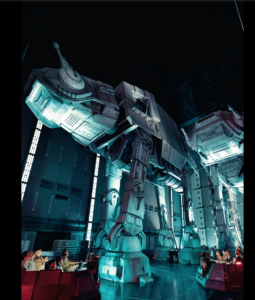
Photo: Disneyland
One attraction at Disneyland skews the results, just not as much as at Disney’s Hollywood Studios.
The two parks share the same alpha, Star Wars: Rise of the Resistance. The lines never go down much at either park.
Image Credit: Disney
For whatever reason, Disneyland manages the crowds better, though. To wit, Rise of the Resistance here averaged 84 minutes, which is a drop of two minutes from last time.
Contrast that to the 120-minute waits at Hollywood Studios as a general rule. I find that discrepancy fascinating.
Average Waits at Disneyland Park
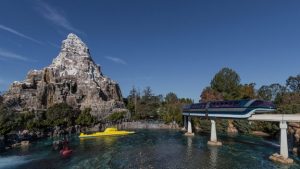
Image: Disneyland
Here are the average wait times at the other attractions at Disneyland Park:
- Space Mountain – 69 minutes, down 1
- Indiana Jones Adventure – 59 minutes, up 2
- Splash Mountain – 59 minutes, up 24
- Millennium Falcon: Smugglers Run – 58 minutes, up 5
- Matterhorn Bobsleds – 55 minutes, up 6
- Big Thunder Mountain Railroad – 51 minutes, up 5
- Haunted Mansion – 42 minutes, up 6
- Jungle Cruise – 39 minutes, up 5
- Peter Pan’s Flight – 38 minutes, up 4
- Dumbo the Flying Elephant – 37 minutes, up 5
- Astro Orbiter – 36 minutes, up 3
- Star Tours – The Adventures Continue! – 36 minutes, up 11
- Buzz Lightyear Astro Blasters – 35 minutes, up 4
- Alice in Wonderland – 34 minutes, up 4
- Autopia – 33 minutes, up 5
- Storybook Land Canal Boats – 29 minutes, up 5
- It’s a Small World – 25 minutes, up 9
- Toad’s Wild Ride – 25 minutes, up 2
- Snow White’s Enchanted Wish – 25 minutes, up 3
- Casey Jr. Circus Train – 23 minutes, up 5
- The Many Adventures of Winnie the Pooh – 22 minutes, up 3
- Pinocchio’s Daring Journey – 21 minutes, up 3
- Disneyland Railroad – 19 minutes, up 4
- Disneyland Monorail – 16 minutes, down 1
- King Arthur Carrousel – 16 minutes, no change
- Mad Tea Party – 16 minutes, up 2
- Davy Crockett’s Explorer Canoes – 12 minutes, up 1
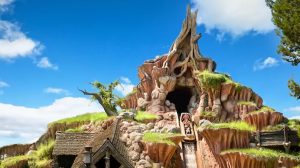
Photo: Disneyland
Overall, the average wait time was 36 minutes, up five minutes from last time.
I should note a couple of discrepancies here. The warmer weather definitely made Splash Mountain a more popular ride.
Also, I don’t claim to understand it, but Star Tours has witnessed much larger throughput over the past month. Even as I type this, its lines are abnormally long.
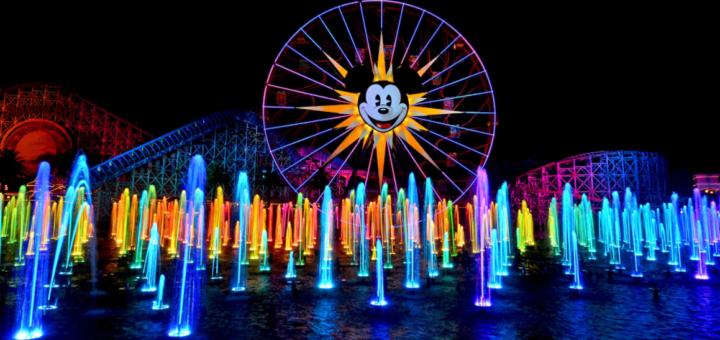
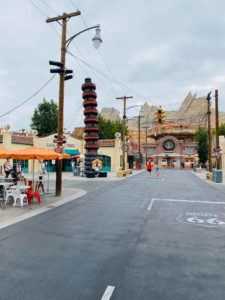
Disney California Adventure
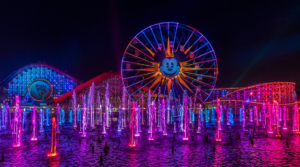
Photo: DIsneyland
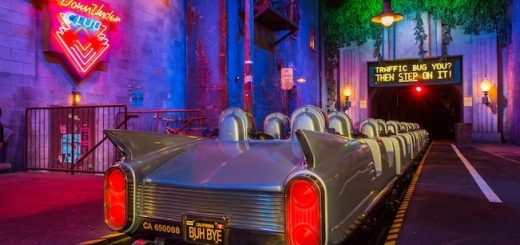
For the body of a decade, Disney California Adventure hosted one attraction that towered over the rest…and I don’t mean the Twilight Zone Tower of Terror.
Radiator Springs Racers at Cars Land had dominated attendance for ages before WEBSLINGERS: A Spider-Man Adventure opened.
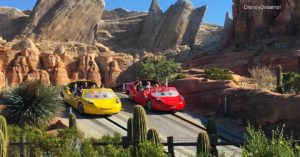
Photo: DisneyDreamer.com
For a few months, the Avengers Campus anchor attraction swayed traffic there in lieu of Radiator Springs Racers.
Last month, we witnessed a return to normalcy as the Cars ride returned to the top of the charts. And that’s the case this month as well.
For the past 30 days, Radiator Springs Racers has averaged a wait of 91 minutes, an increase of 15 minutes from the previous month.
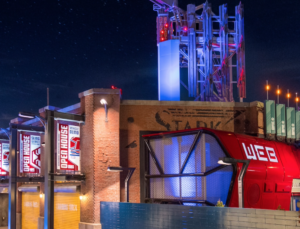
Photo: Disneyland
Meanwhile, WEBSLINGERS has already peaked. Now, its crowds are coming down in size. The ride’s average wait time was 62 minutes for the past month.
That’s an increase of four minutes from last time. However, the gap between this one and Radiator Springs Racers has grown.
At this point, the Cars Land attraction is squarely back in charge as the park’s alpha.
Wait Times at Disney California Adventure
Here are the other wait times at Disney California Adventure:
- Toy Story Midway Mania! – 56 minutes, up 3
- Guardians of the Galaxy – Mission: BREAKOUT! – 55 minutes, up 4
- Soarin’ Over California – 51 minutes, down 1
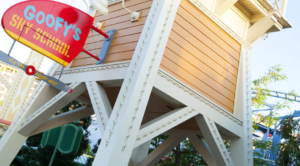
- Goofy’s Sky School – 41 minutes, up 2
- Monsters, Inc. Mike & Sulley to the Rescue! – 41 minutes, up 5
- Grizzly River Run – 39 minutes, up 24
- The Incredicoaster – 39 minutes, up 9
- Pixar Pal-A-Round – 27 minutes, up 6
- Luigi’s Rollickin’ Roadsters – 26 minutes, up 3
- Inside Out Emotional Whirlwind – 24 minutes, up 4
- Mater’s Junkyard Jamboree – 21 minutes, up 5
- The Little Mermaid ~ Ariel’s Undersea Adventure – 17 minutes, up 7
- Jumpin’ Jellyfish – 16 minutes, up 4
- Golden Zephyr – 11 minutes, up 3
- Jessie’s Critter Carousel – 8 minutes, up 3
Overall, Disney California Adventure attractions required an average wait of 36 minutes, an increase of seven minutes from last month.
Photo: Disney California Adventure
So, as we expected, the parks did host larger crowds than last time.
However, the increases weren’t on the level of Walt Disney World, which was crazy over the past four weeks.
Photo: MickeyBlog
Thanks for visiting MickeyBlog.com! Want to go to Disney? For a FREE quote on your next Disney vacation, please fill out the form below and one of the agents from MickeyTravels, a Platinum level Authorized Disney Vacation Planner, will be in touch soon!
Feature Photo: Disneyland