Walt Disney World Wait Times for First Week of December
Welcome to December, the most popular time of the year at Disney theme parks.
We’ve already witnessed massive crowds during July and Thanksgiving week. Thankfully, we should get a bit of a breather before mid-December, though.
Then again, you never really know at Disney this year. So, let’s look at the wait times for the first week of December.
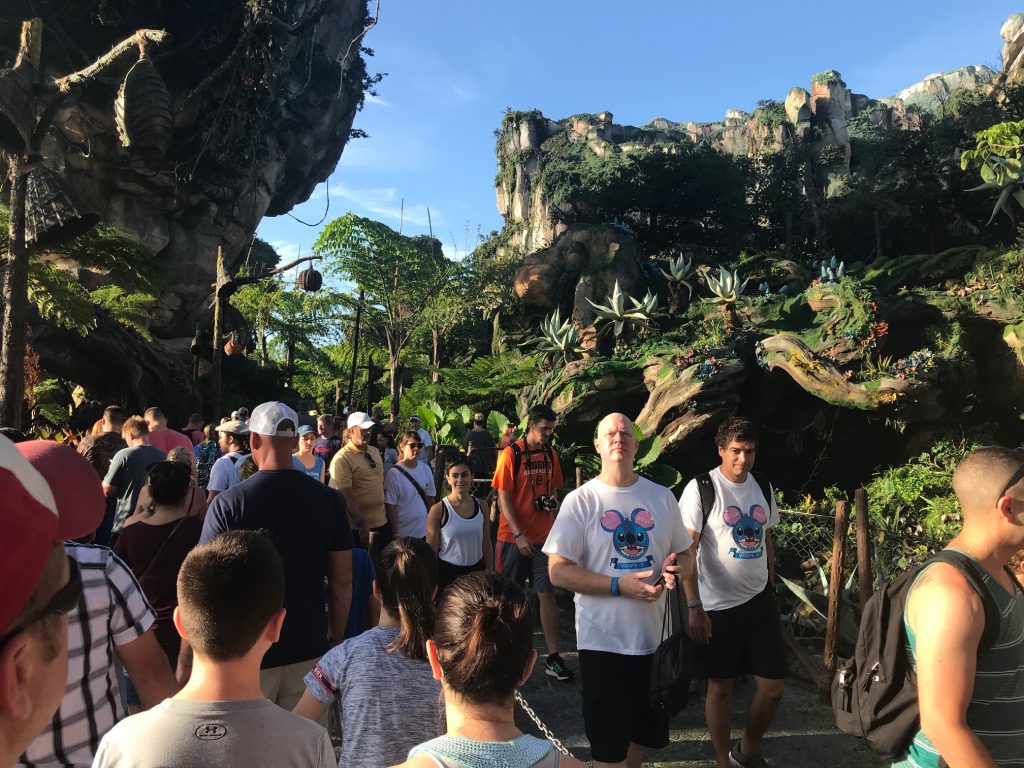
Disney’s Animal Kingdom
Two weeks ago, Avatar Flight of Passage soared to a 155-minute wait before settling at 76 minutes during the Thanksgiving holiday weekend.

Image Credit: Disney
For the first week of December, the E-ticket attraction hovered at 76 minutes, a strong indicator that this is what you should expect for a while.
Once Christmas week arrives, Avatar Flight of Passage likely returns to 155 minutes, though. So, this is actually the calm before the storm.
Here’s the rest of Animal Kingdom for comparison:
- Na’vi River Journey – 73 minutes, up 11
- Kilimanjaro Safaris – 48 minutes, up 8
- DINOSAUR – 27 minutes, up 7
- Expedition Everest – 22 minutes, down 2
- It’s Tough to Be a Bug! – 11 minutes, no change
- TriceraTop Spin – 10 minutes, down 2
Overall, the average Animal Kingdom attraction line-wait was 37 minutes, which is up four.
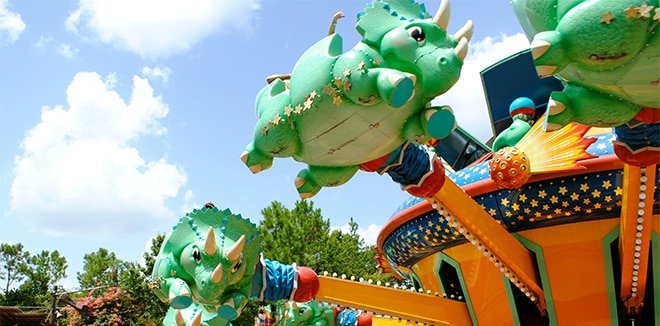
Photo: Disney
As you can see, Na’vi River Journey, DINOSAUR, and Kilimanjaro Safaris skewed the results a bit. Still, I suspect this remains the trend for a while.
Disney’s Hollywood Studios
Okay, things are about to take an unexpected turn. Star Wars: Rise of the Resistance averaged a 139-minute wait. Yes, that’s up 23 minutes from last time.
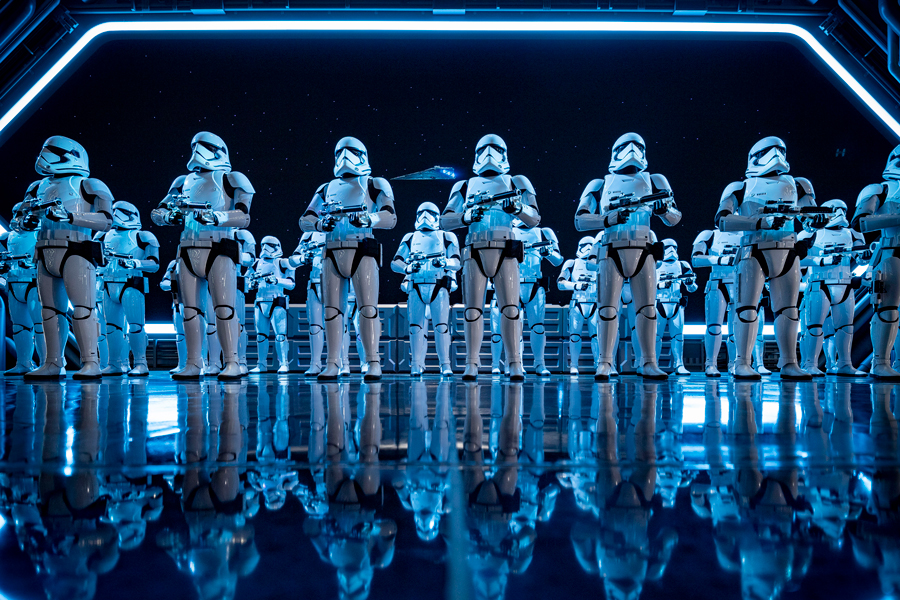
Image Credit: Disney
Ordinarily, when Rise of the Resistance goes up, virtually everything else does as well. Did that happen here? Yup. Here’s the data:
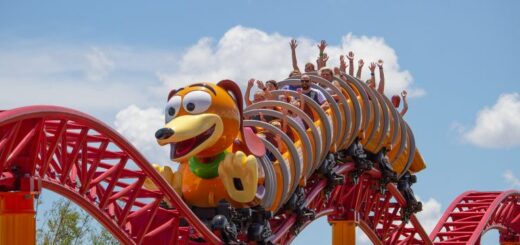
- Slinky Dog Dash – 90 minutes, down 3
- Mickey & Minnie’s Runaway Railway – 73 minutes, up 3
- Millennium Falcon: Smugglers Run – 65 minutes, up 4
- Toy Story Mania! – 62 minutes, up 5
- Twilight Zone Tower of Terror – 60 minutes, up 8
- Rock ‘N’ Roller Coaster Starring Aerosmith – 59 minutes, up 4
- Alien Swirling Saucers – 42 minutes, up 2
- Star Tours – The Adventures Continue! – 36 minutes, up 8
- Lightning McQueen’s Racing Academy – 15 minutes, up 1
- Muppet*Vision 3D – 11 minutes, no change
Overall, Hollywood Studios attractions averaged a 51-minute wait, an increase of four minutes from last time.
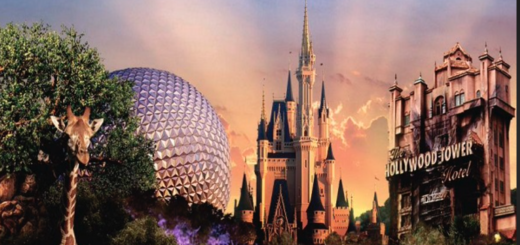
EPCOT
Okay, let’s hope that EPCOT is better. Usually, this park enjoys the shortest wait times.
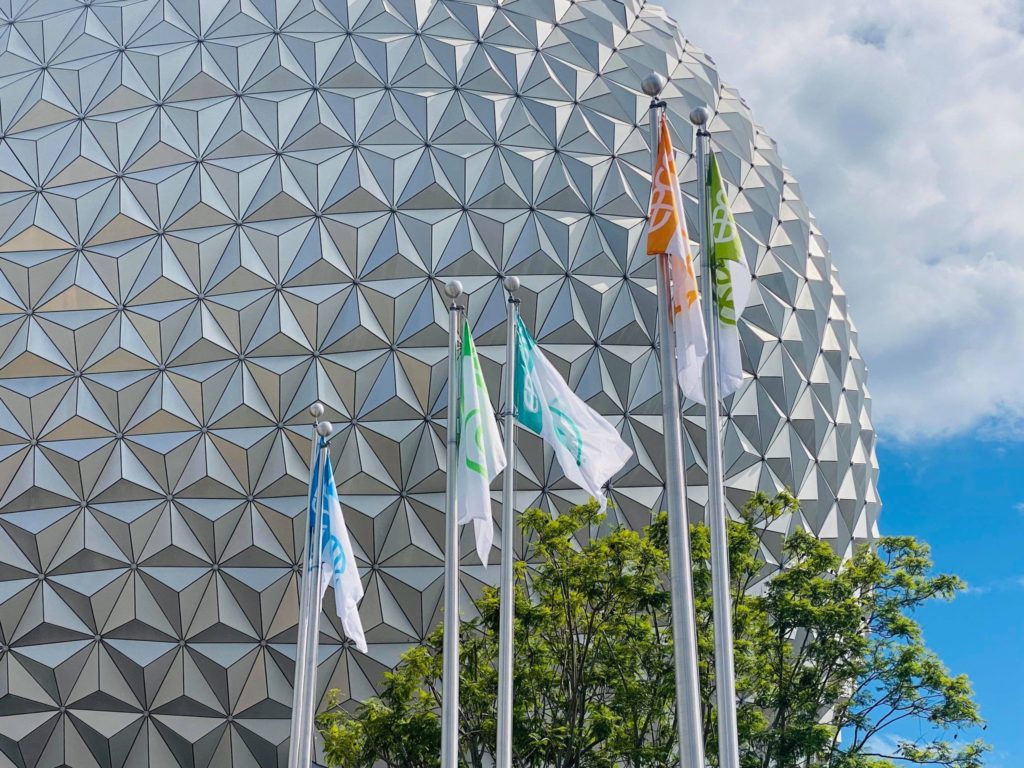
Thus far, Animal Kingdom and Hollywood Studios have been on the high end of their averages. So, I’m holding out hope for a comeback here.
Alas, we don’t start well. Frozen Ever After increased from 78 to 84 minutes. This attraction qualifies as one of the cheaper Lightning Lane options.
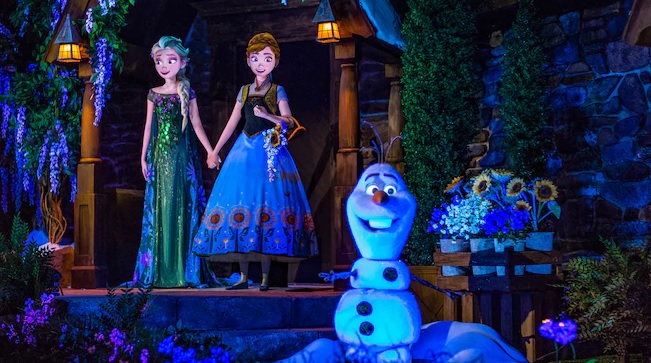
Credit: Disney
Since Disney added that option, wait time has increased noticeably. However, it’s still too early to say how much of that stems from holiday crowds.
Overall, the time from mid-October to New Year’s Day has turned into the most consistently crowded time on the Disney calendar. So, it’s tough to draw any conclusions.
Here are the rest of EPCOT’s wait times:
- Soarin’ Around the World – 44 minutes, up 9
- Test Track – 43 minutes, down 4
- The Seas with Nemo & Friends – 17 minutes, up 1
- Journey into Imagination with Figment – 16 minutes, up 3
- Living with the Land – 16 minutes, up 4
- Gran Fiesta Tour Starring the Three Caballeros – 15 minutes, up 5
- Spaceship Earth – 15 minutes, no change
- Mission: SPACE – 12 minutes, up 1
- Turtle Talk with Crush – 10 minutes, up 1
The average EPCOT attraction required a 28-minute wait, up four minutes from last time.
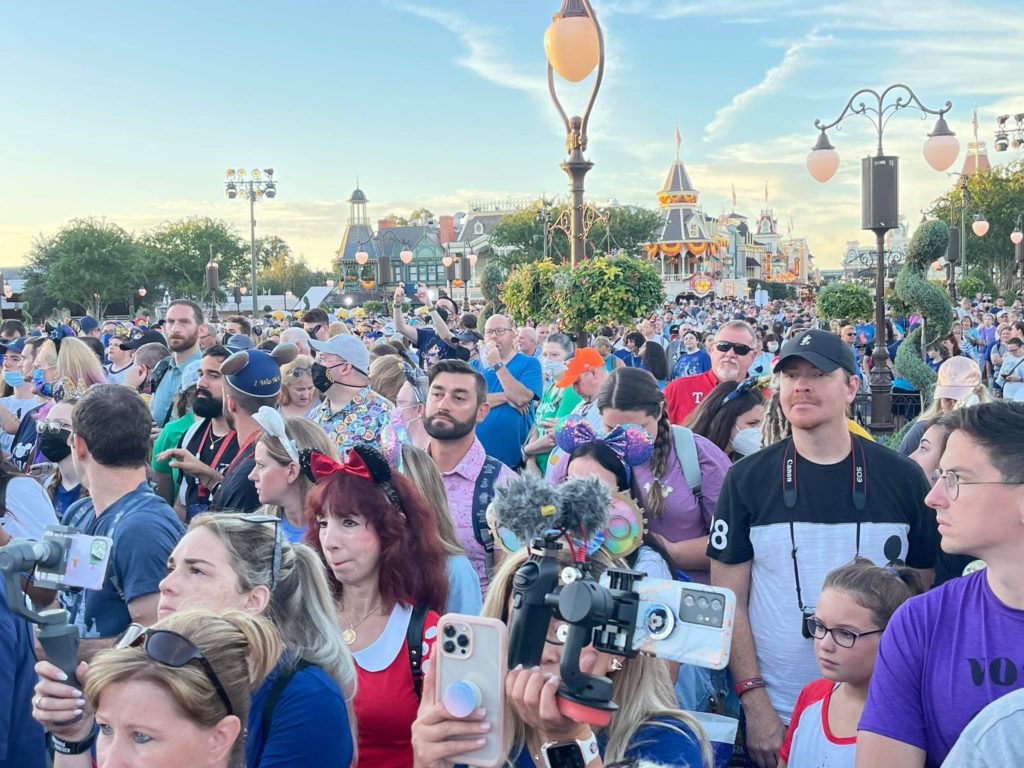
Magic Kingdom
Let’s start with the data at Magic Kingdom:
- Jungle Cruise – 95 minutes, up 16
- Peter Pan’s Flight – 82 minutes, up 3
- Seven Dwarfs Mine Train – 82 minutes, down 4
- Haunted Mansion – 55 minutes, up 5
- Splash Mountain – 53 minutes, up 11
- Space Mountain – 46 minutes, up 1
- Pirates of the Caribbean – 44 minutes, up 4
- It’s a Small World – 42 minutes, up 5
- Big Thunder Mountain Railroad – 41 minutes, down 3
- The Many Adventures of Winnie the Pooh – 40 minutes, up 1
- Buzz Lightyear’s Space Ranger Spin – 39 minutes, up 2
- Under the Sea ~ Journey of the Little Mermaid – 35 minutes, up 1
- Astro Orbiter – 34 minutes, down 4
- Dumbo the Flying Elephant – 32 minutes, up 1
- Magic Carpets of Aladdin – 30 minutes, up 4
- The Barnstormer – 27 minutes, down 1
- Princess Fairytale Hall – 22 minutes, down 2
- Prince Charming Regal Carrousel – 19 minutes, down 2
- Tomorrowland Speedway – 19 minutes, down 2
- Mad Tea Party – 18 minutes, no change
- Tomorrowland Transit Authority PeopleMover – 18 minutes, down 2
- Monsters, Inc. Laugh Floor – 17 minutes, no change
- Mickey’s PhilharMagic – 16 minutes, down 3
- Town Square Theatre – 14 minutes, up 3
- Walt Disney’s Carousel of Progress – 5 minutes, no change
- Country Bear Jamboree – 5 minutes, up 1
The average Magic Kingdom attraction came with a 36-minute wait, the same as last time.
So, Walt Disney World’s popular park thankfully stayed the same, whereas the other three all required longer waits.
As I said last time – and was wrong for this week – the wait times should hover in this range until around December 18th.
That’s when the parks start to get crazy. Until then, high but tolerable wait times represent the status quo.
Photo: MickeyTravels.com