Walt Disney World Wait Times for the Past Week
Walt Disney World crowds have trended down at an almost comical rate.
In a matter of weeks, we switched from obscene wait times to reasonable line queues.
Did the trend continue in the days leading up to the Labor Day holiday weekend? Let’s find out!
Disney’s Animal Kingdom
As usual, we will find out a lot from the first attraction. Avatar Flight of Passage has required the longest wait at the park every week since this article’s inception.
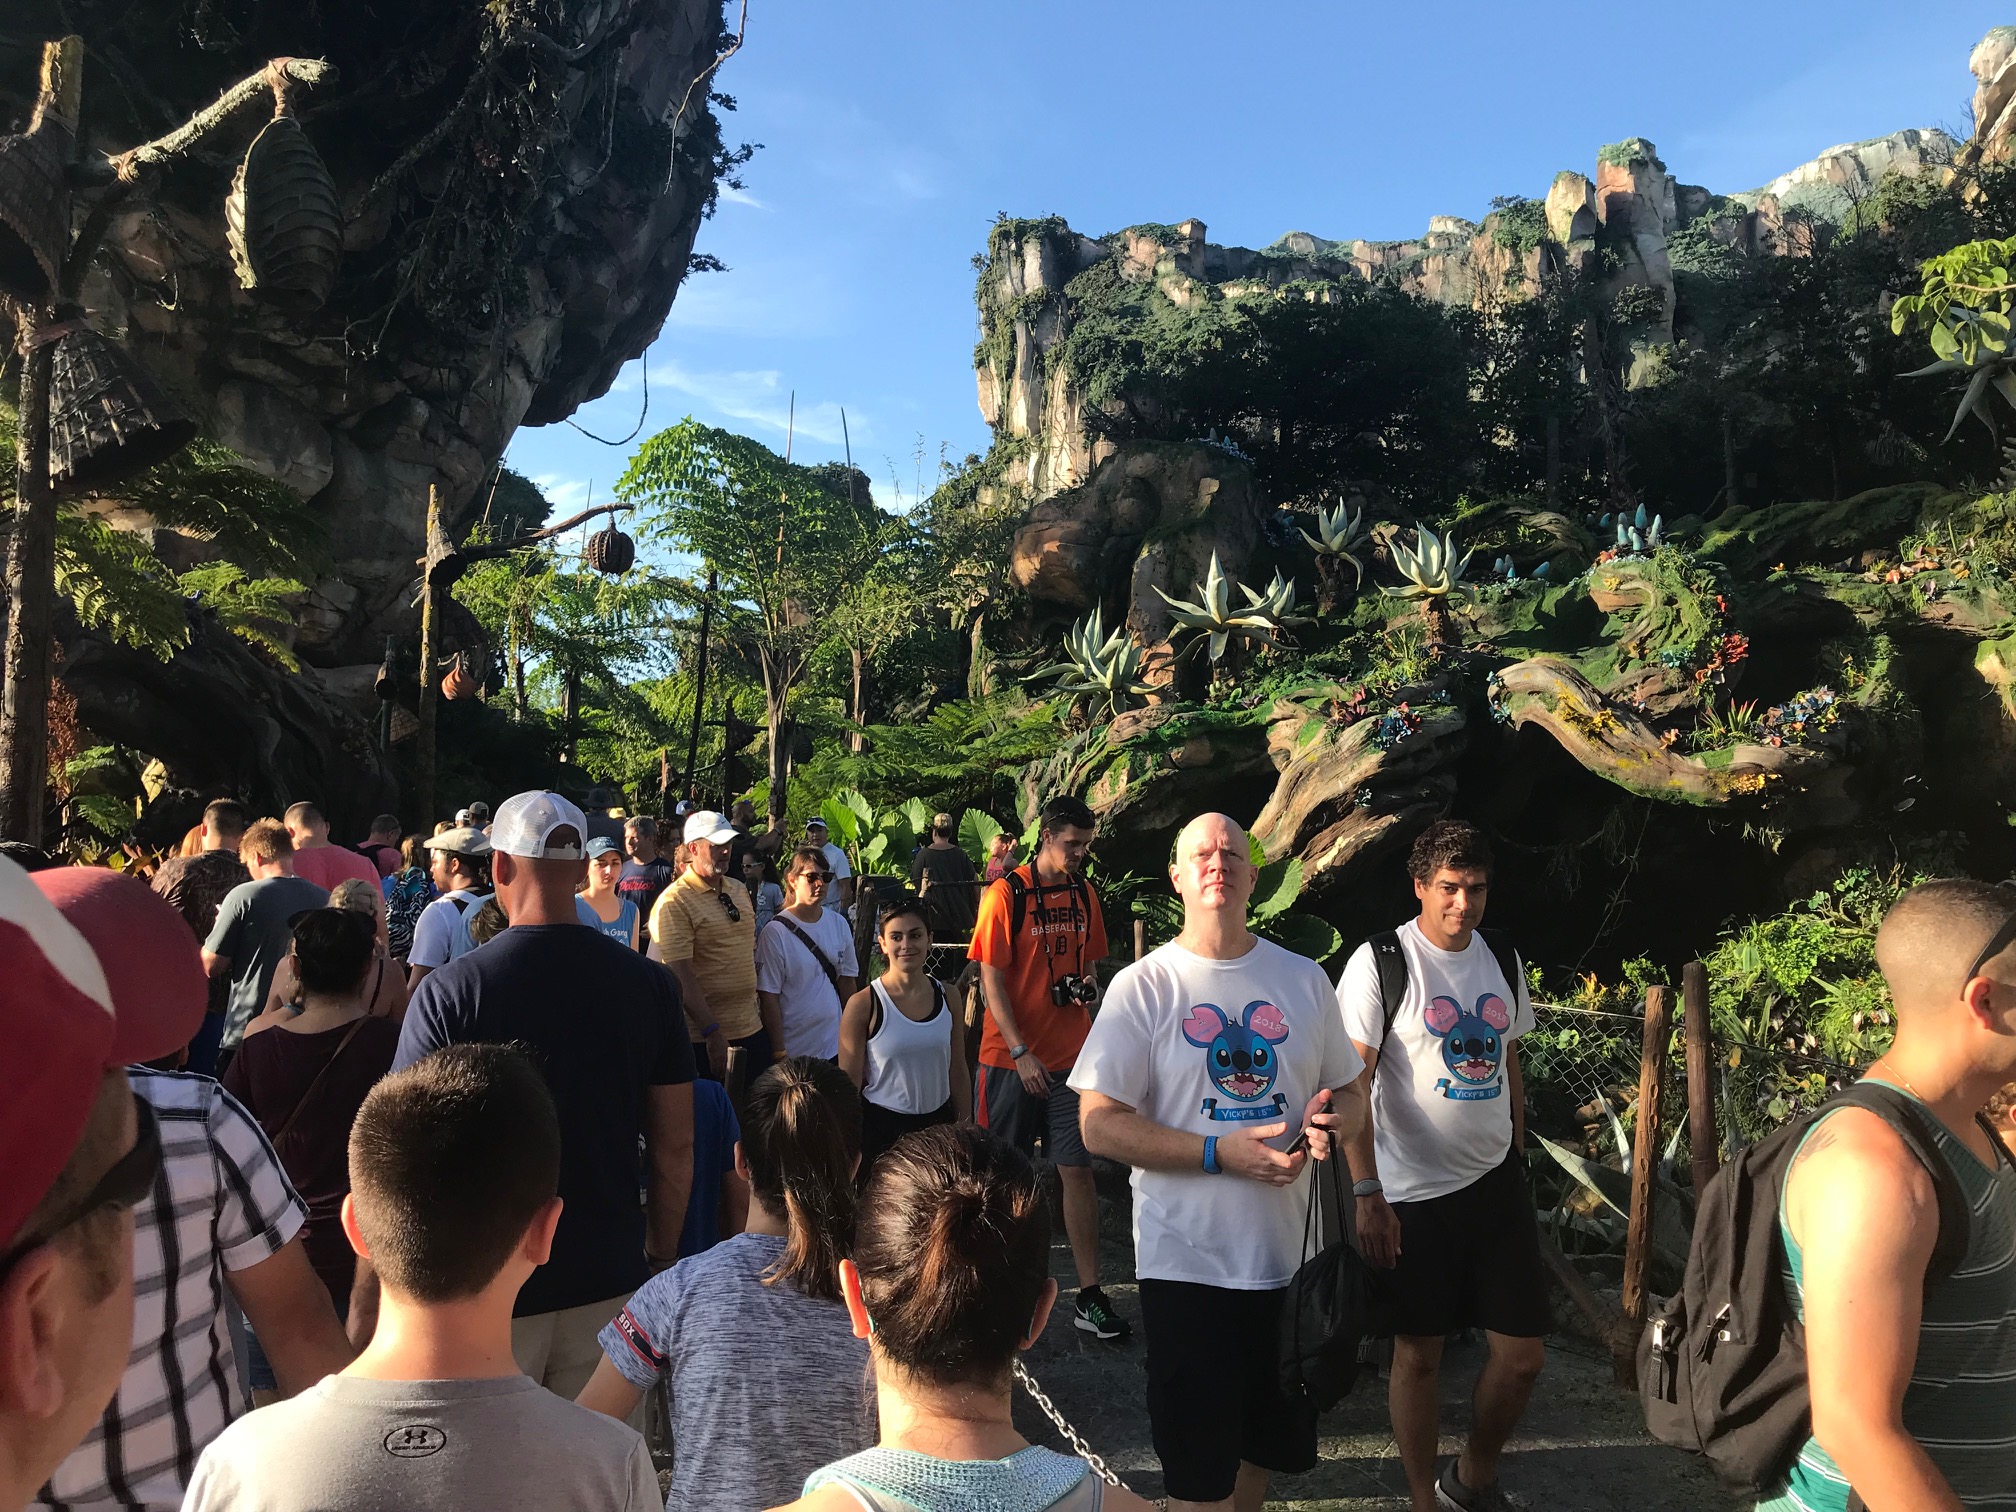
Last week was no different, although the number will blow. Your. MIND!
Folks, people waited for an average of 16 minutes in line at Avatar Flight of Passage. That’s like Magic Carpets of Aladdin territory!
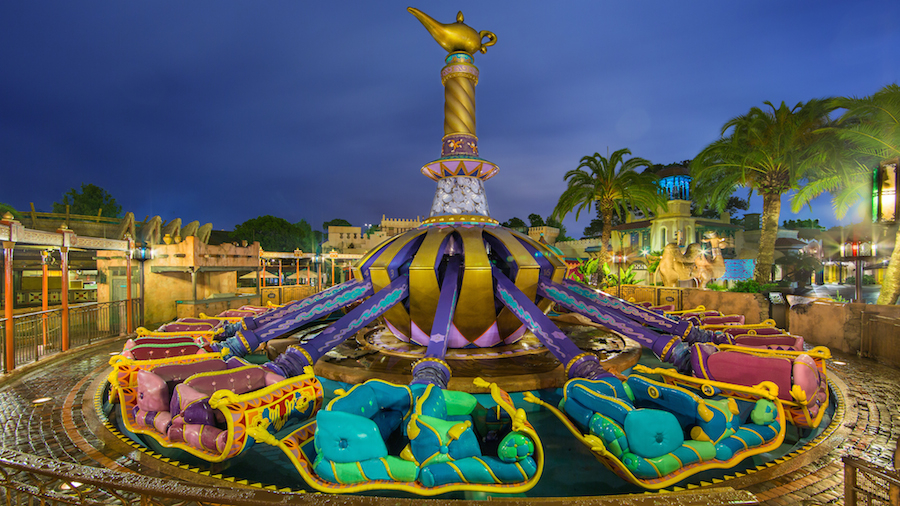
Photo: Disney
Obviously, anyone who spent any of the last few days at Animal Kingdom had the time of their lives! That’s legitimately July of 2020-type wait time!
Also, I haven’t spelled out the stunning part yet. That was the WORST wait time at the entire park!
(Kent Phillips, photographer)
We had a VIP Tour last year where we spent more time in line than that!
Take a look at these average waits! It’s insane!
- Na’vi River Journey – 14 minutes, down 14 minutes
- Kali River Rapids – 9 minutes, down 3
- It’s Tough to Be a Bug! – 8 minutes, down 2
- Expedition Everest – 8 minutes, down 3
- DINOSAUR – 7 minutes, no change
- Kilimanjaro Safaris – 6 minutes, down 4
- TriceraTop Spin – 5 minutes, no change
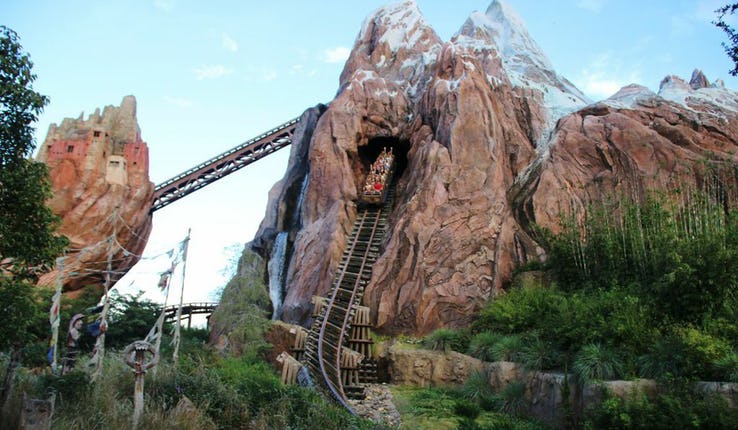
Image Credit: Disney
The average Animal Kingdom attraction came with a wait of – I kid you not – nine minutes. That’s down five minutes from last time.
If this trend holds, we should all jump in our cars and head to Walt Disney World next week!
Disney’s Hollywood Studios
We will know in just a moment whether this trend held at all the parks. After all, Hollywood Studios has continued to defy the behavior trends elsewhere.
This past week, Slinky Dog Dash averaged a 36-minute wait, one of the lowest totals I can ever recall. That is down 22 minutes from last week.
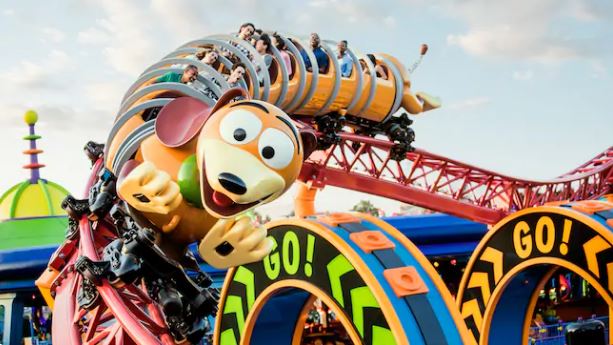
Credit: Disney
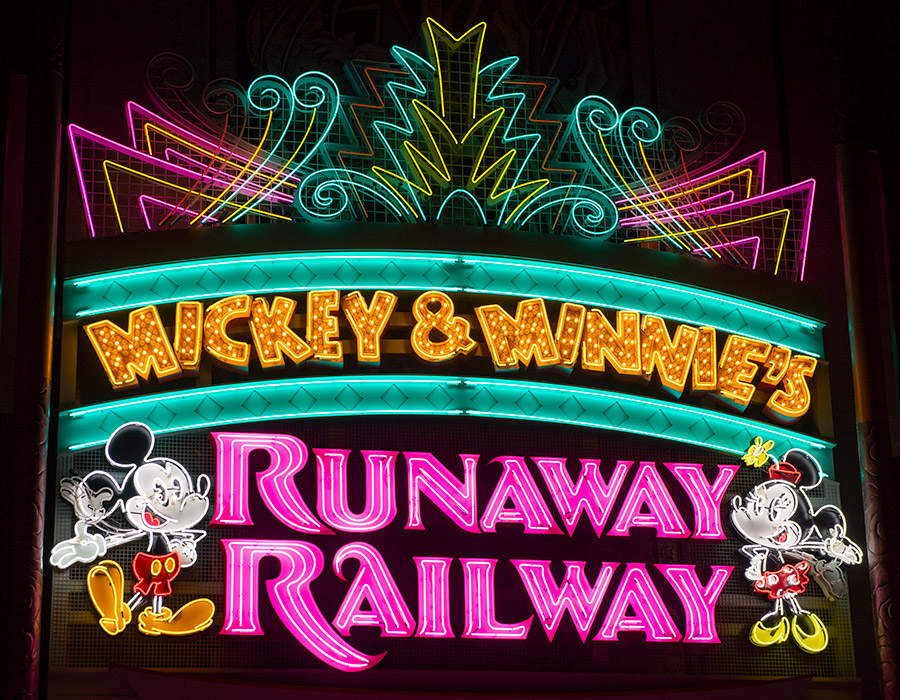
We’re off to a great start! How about Mickey & Minnie’s Runaway Railway? The park’s newest attraction averaged a 29-minute wait, down 14 minutes.
Yup, I think it’s fair to say that attendance declined at Walt Disney World last week.
Here’s the other intel from Hollywood Studios:
- Millennium Falcon: Smugglers Run – 26 minutes, down 17 minutes
- Rock ‘n’ Roller Coaster Starring Aerosmith – 18 minutes, down 15
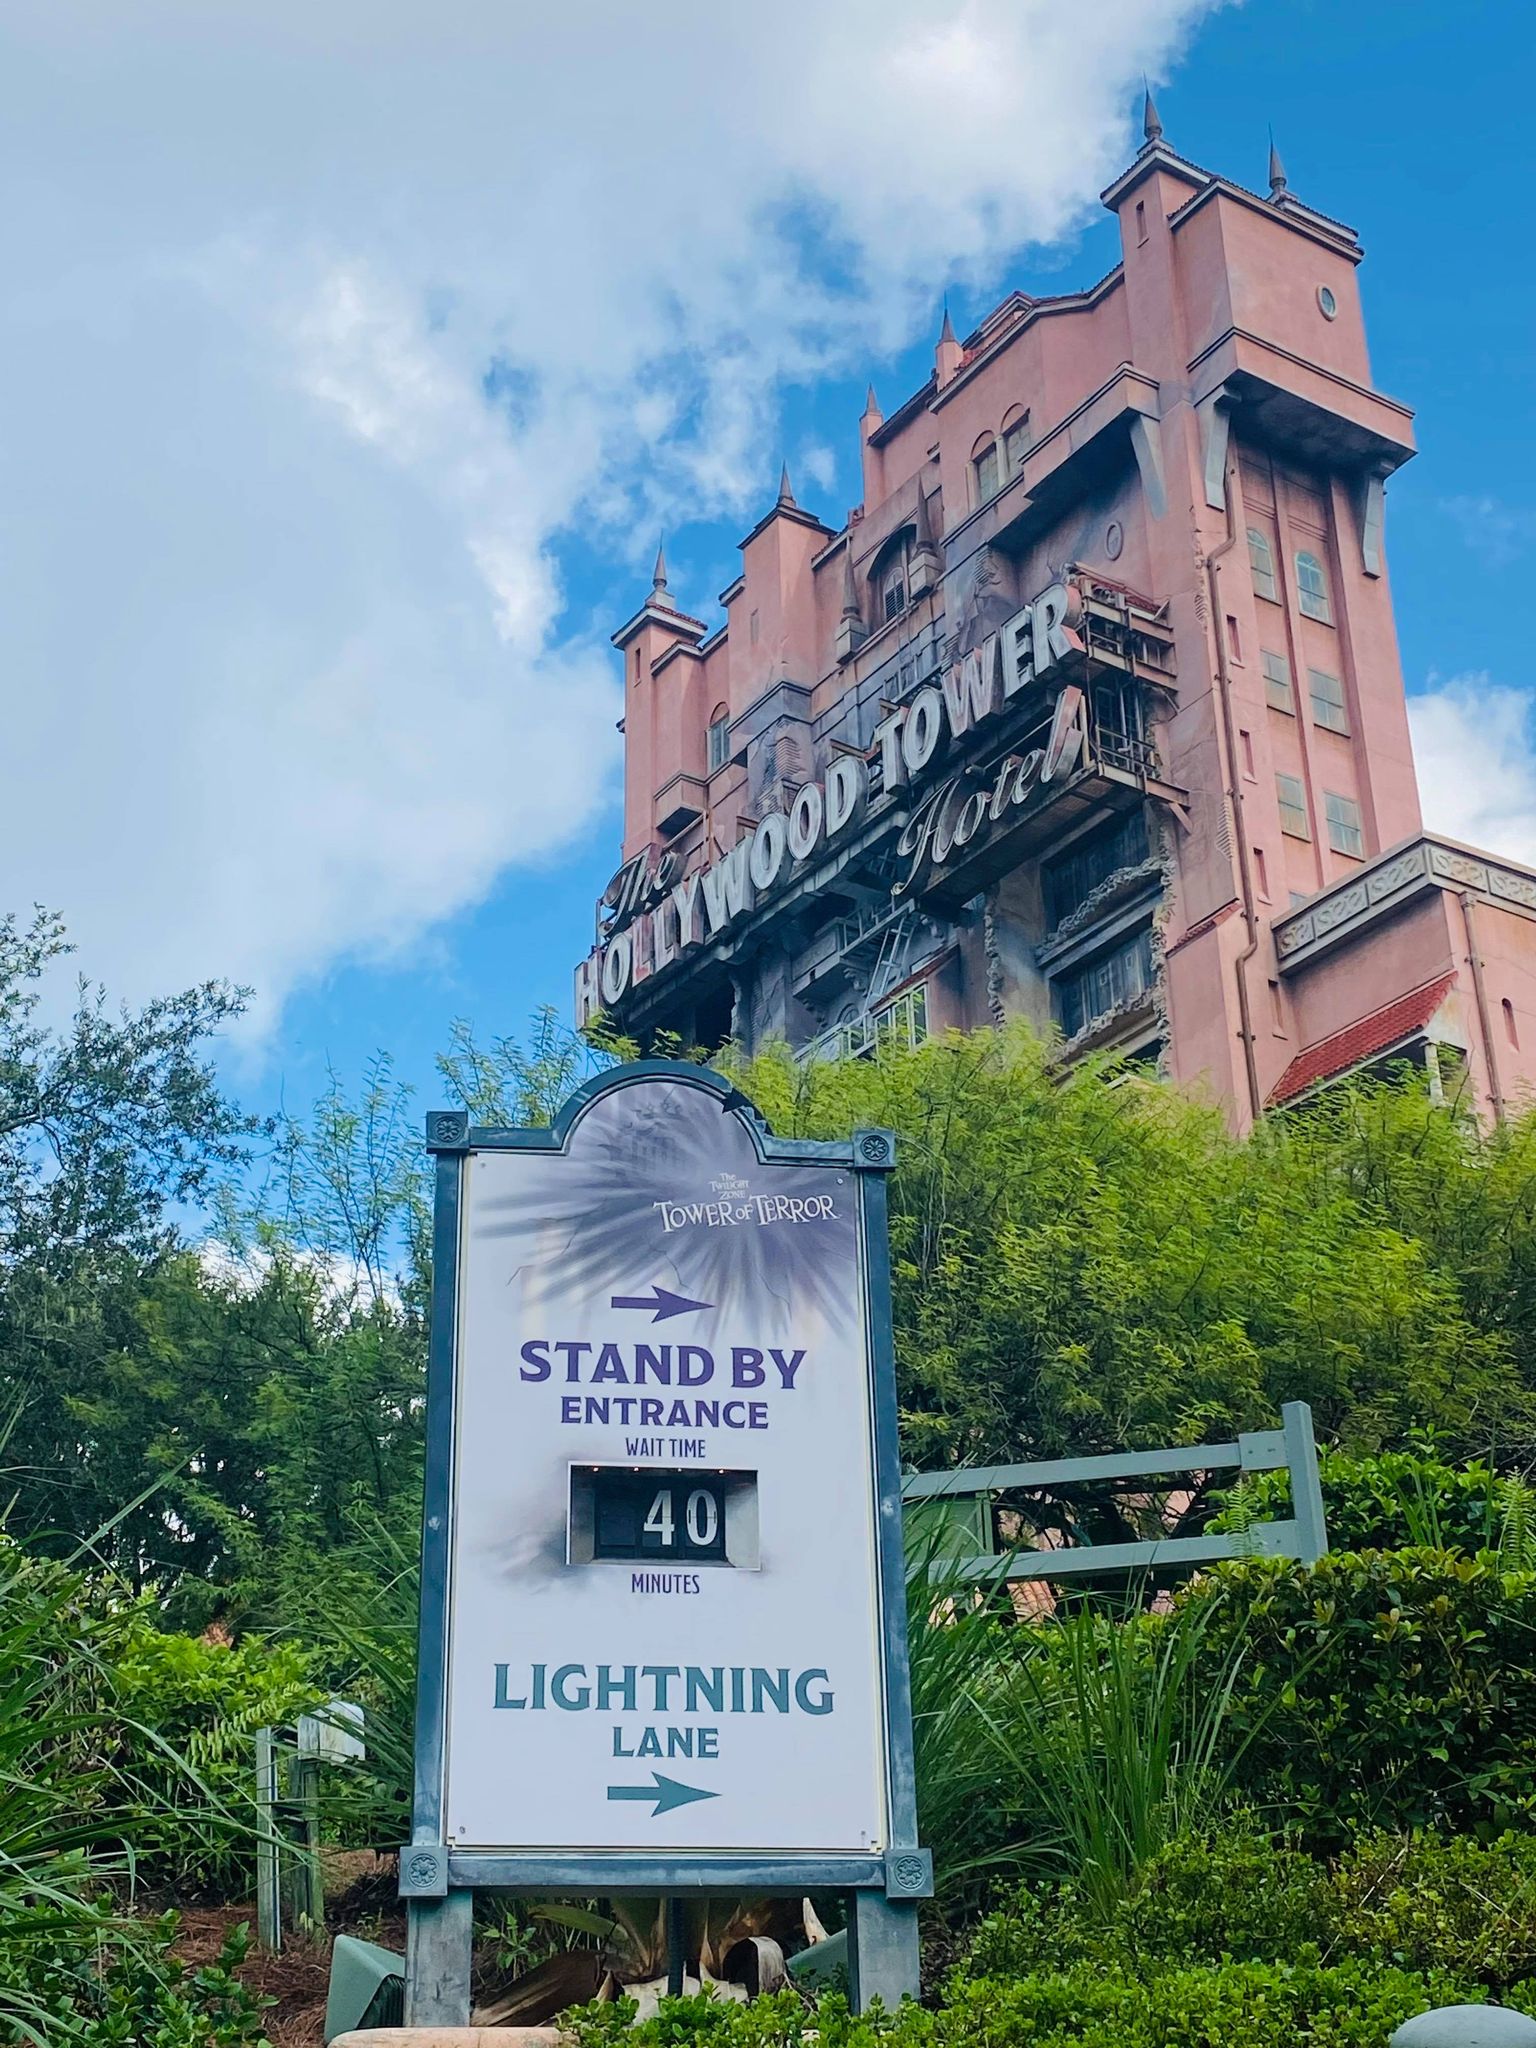
- Twilight Zone Tower of Terror – 17 minutes, down seven
- Lightning McQueen’s Racing Academy – 14 minutes, no change
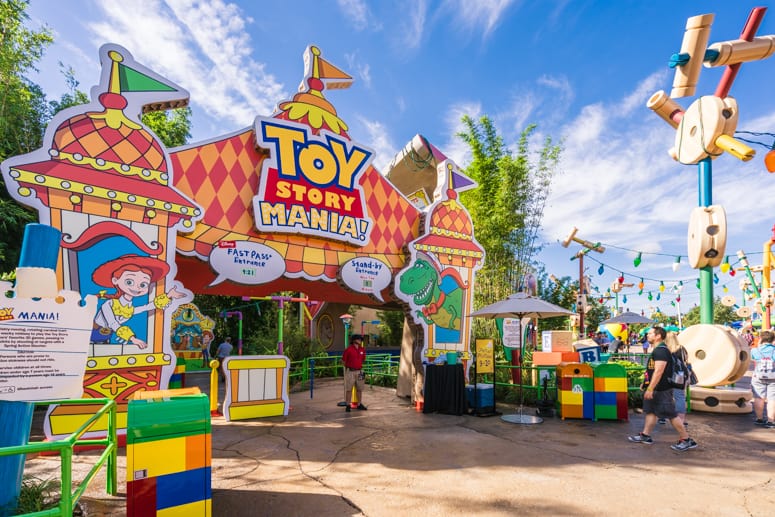
- Toy Story Mania! – 14 minutes, down 14
- Alien Swirling Saucers — 12 minutes, down 9
- Muppet*Vision 3D – 10 minutes, down 2
- Star Tours – The Adventures Continue – 7 minutes, down 7
I don’t even know what to say here. Guests could have ridden Tower of Terror and Rock ‘n’ Roller Coaster after only 35 minutes of line time!
You could have legitimately ridden Toy Story Mania! three or four times in an hour!
Overall, the average Hollywood Studios attraction required a wait of 17 minutes, a drop from 27 minutes the previous week.
Who needs Lightning Lane???
EPCOT
I don’t think you need to be the brightest bulb to know that EPCOT will follow this pattern as well.
Even when the rest of Walt Disney World features oversized crowds, EPCOT somehow escapes the chaos.
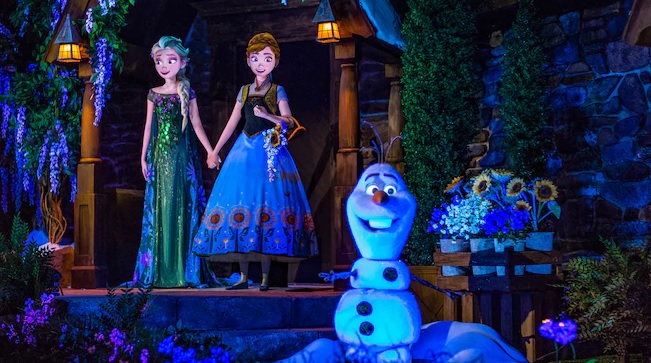
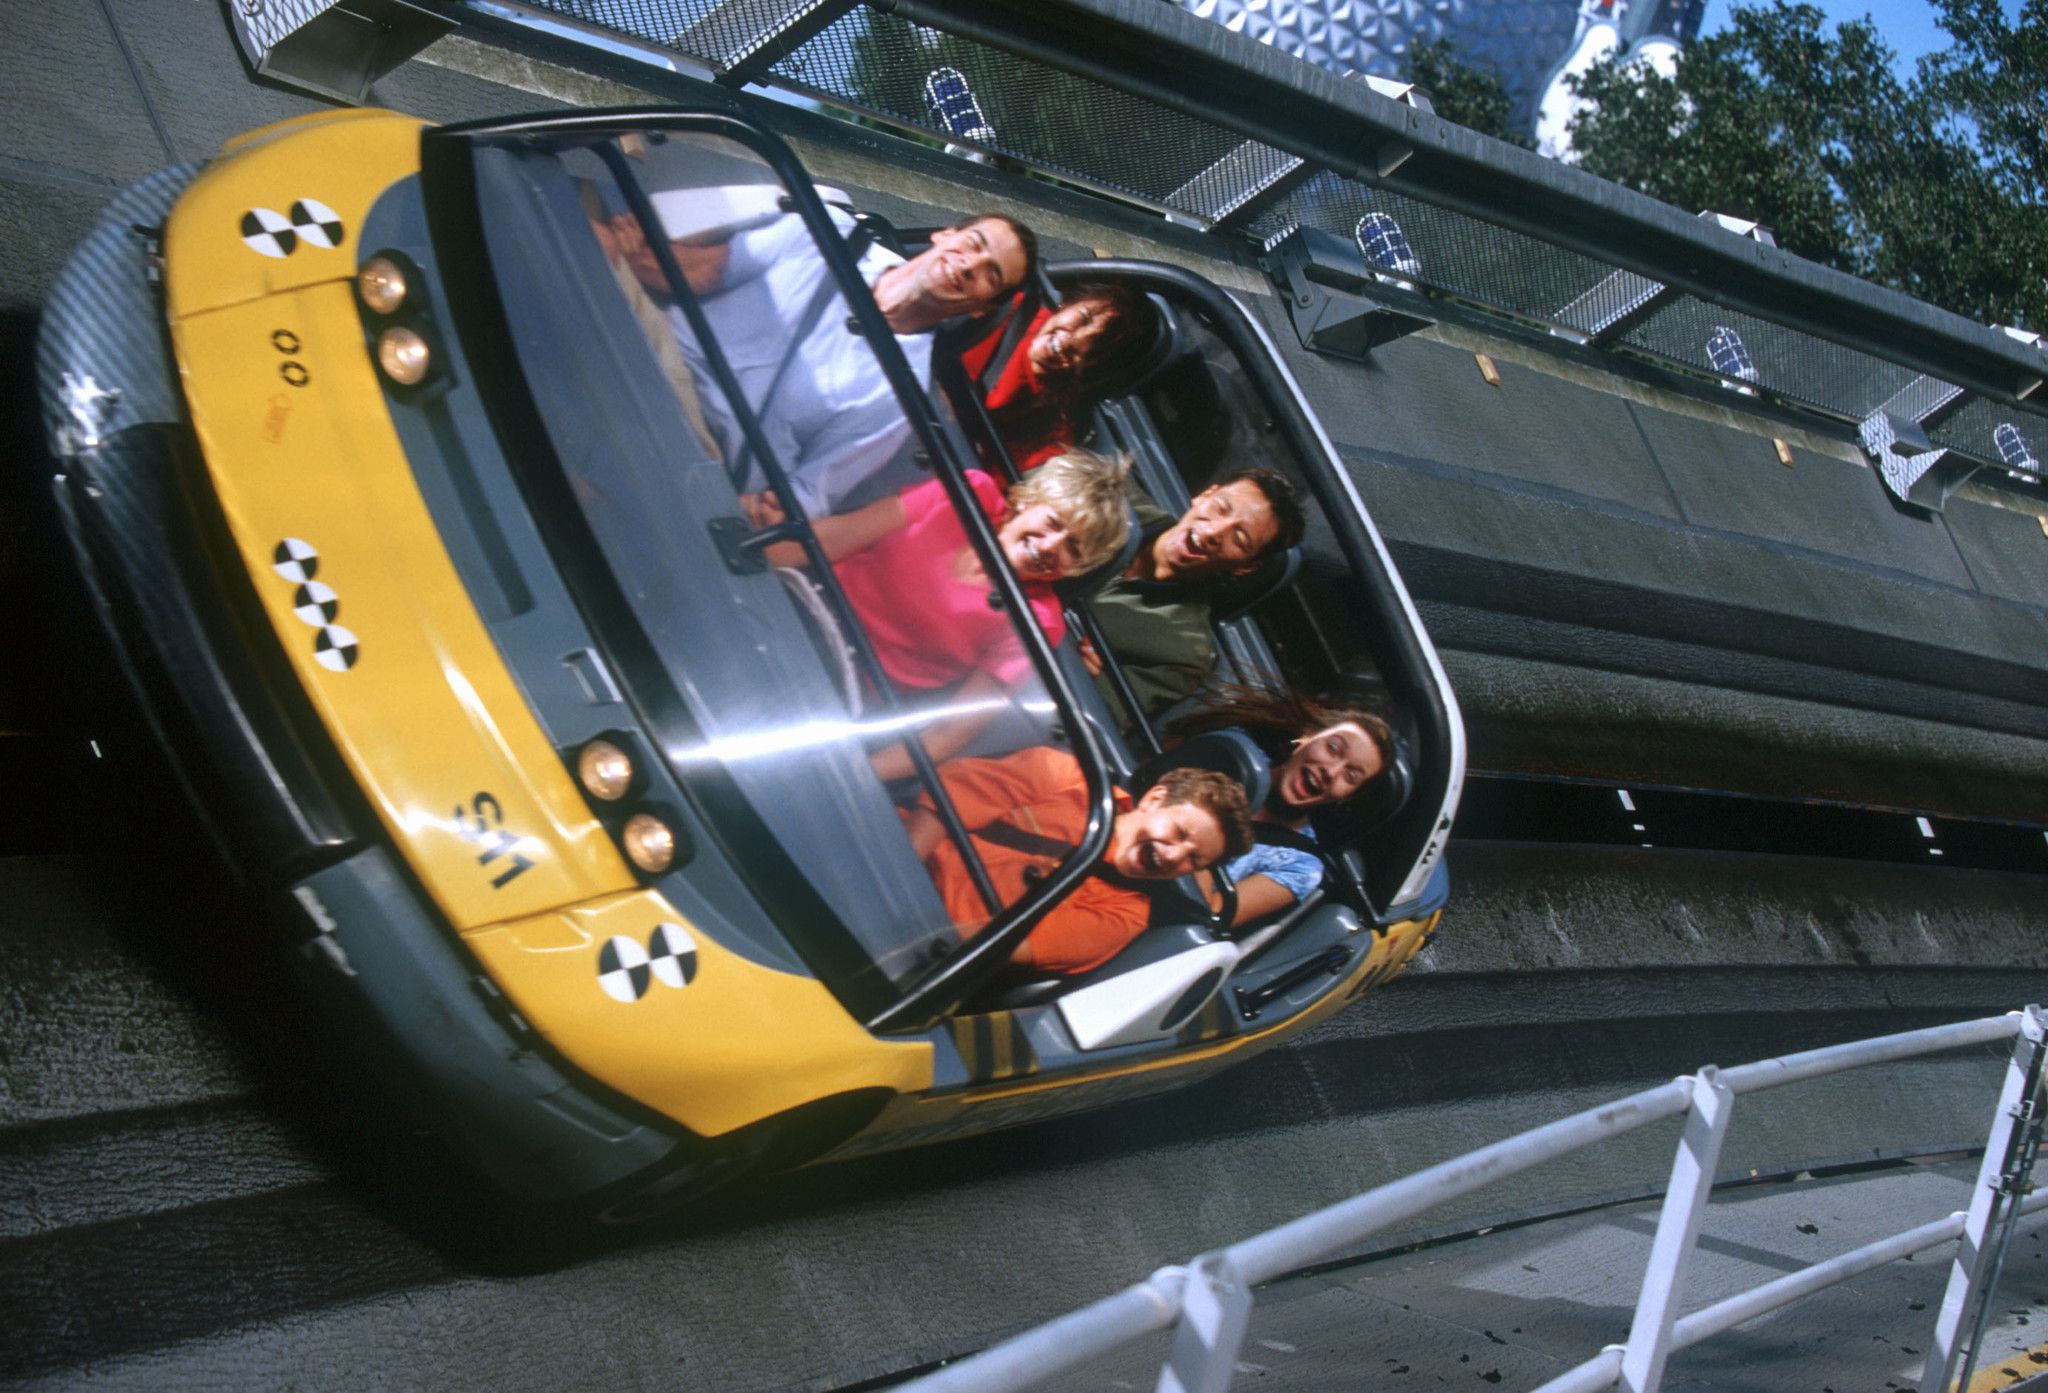
This past week, we actually watched something unusual. Test Track didn’t come with the longest wait.
Instead, that honor went to Frozen Ever After, which had an average wait of 20 minutes. That’s down 10 minutes from last time.
Meanwhile, Test Track finished a shade below it at 19 minutes. That’s a drop of nearly half, 17 minutes, from last time.
You could have experienced both rides in an hour, and I’m allowing for a 15-minute walk!
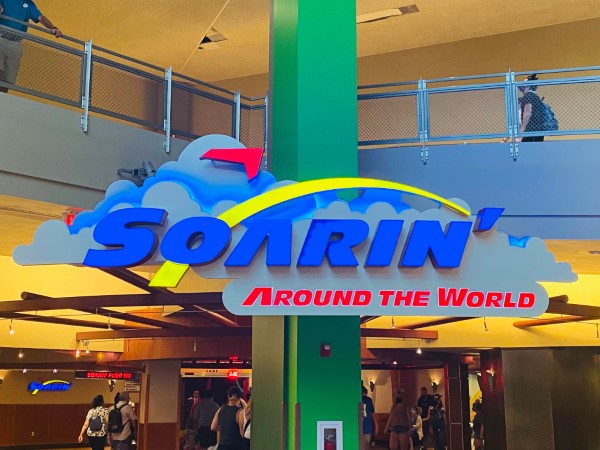
Remarkably, Soarin’ wasn’t even next! Mission: SPACE had the third-longest average crowd with a 12-minute wait, the same as last time.
Meanwhile, Soarin’ came with a 10-minute wait, which is BY FAR the lowest I’ve noticed since MickeyBlog started tracking this data.
Here are the other EPCOT attractions:
- Turtle Talk with Crush – 10 minutes, down 1 minute
- The Seas with Nemo & Friends – 9 minutes, up 1
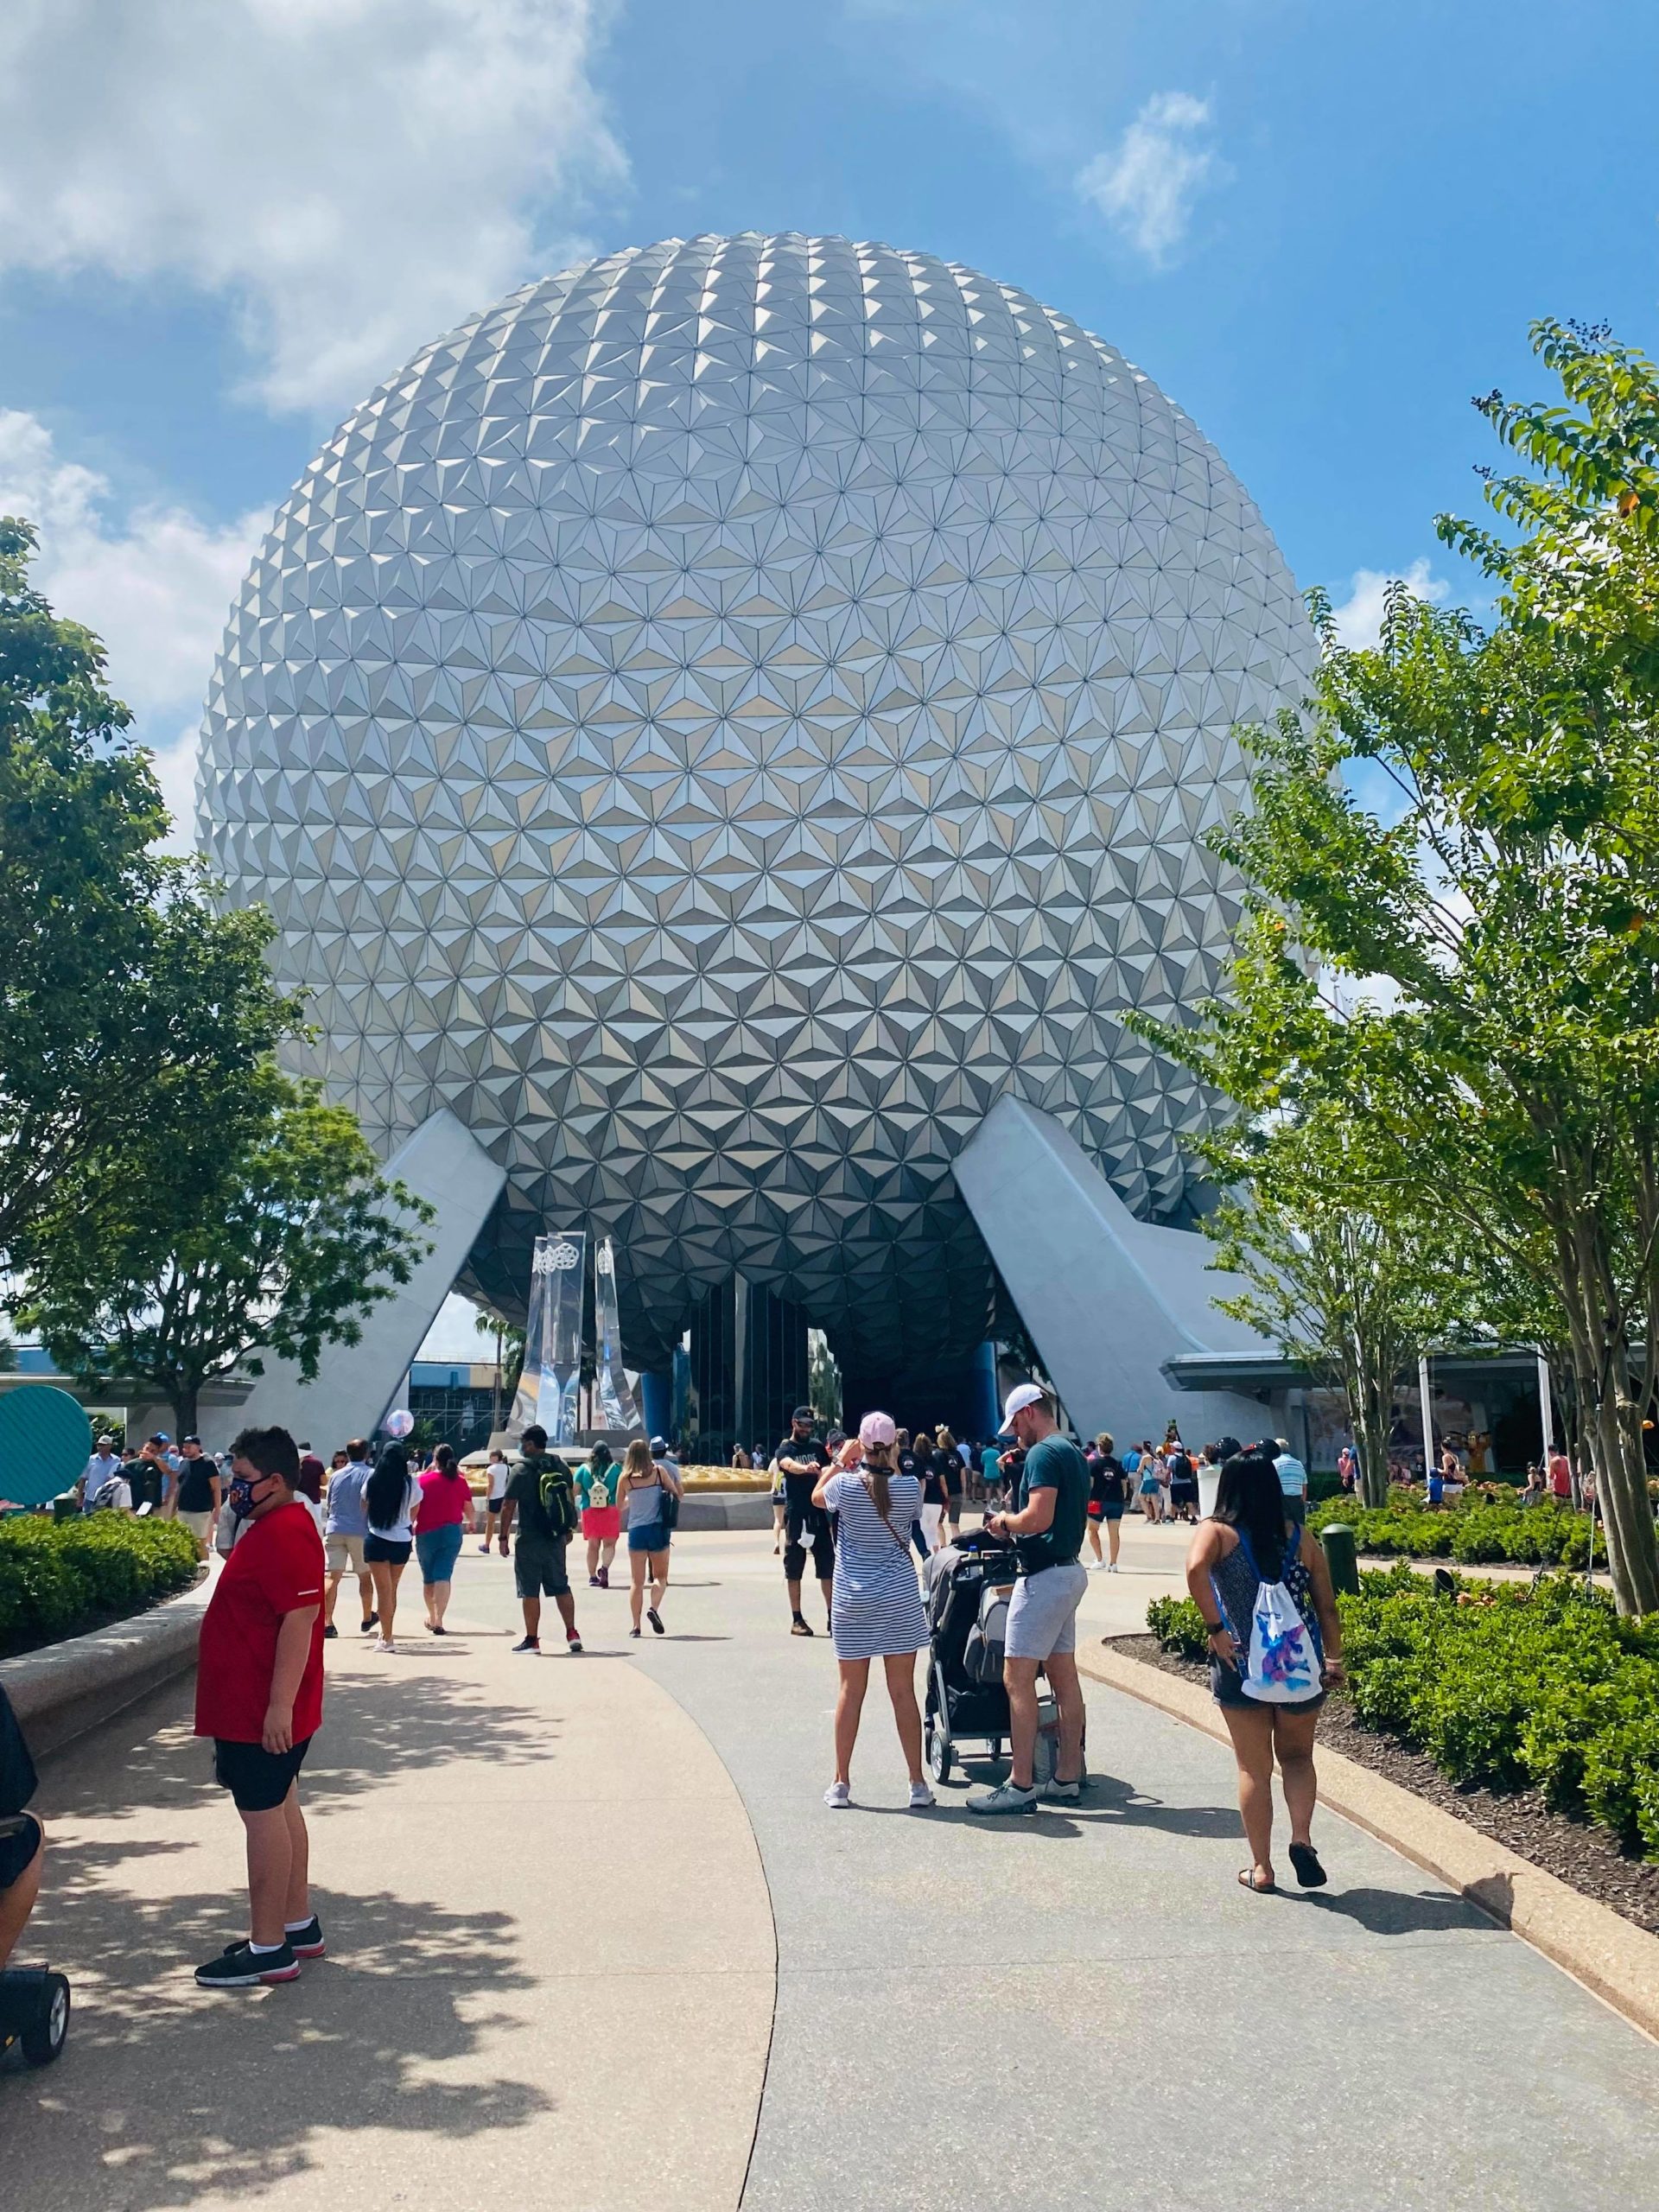
- Spaceship Earth – 5 minutes, down 3
- Journey into Imagination with Figment – 5 minutes, down 3
- Gran Fiesta Tour Starring The Three Caballeros, 4 minutes, down 1
The average EPCOT attraction required an 11-minute wait, which makes me sad that I haven’t been to Disney lately. That’s down three minutes from last week.
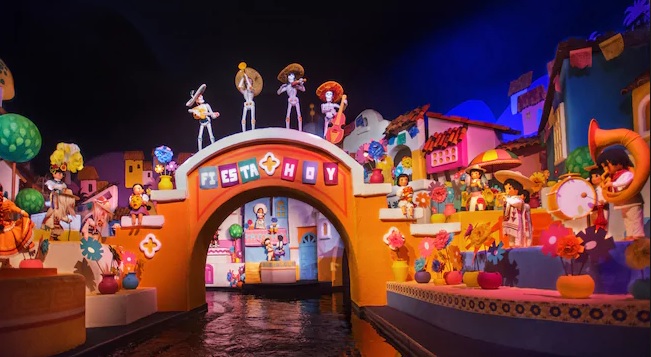
Image: Disney
Magic Kingdom
I don’t think I’m going out on a limb to say that Magic Kingdom stats should be way down as well. Were they? Let’s check:
- Seven Dwarfs Mine Train – 36 minutes, down 17
- Peter Pan’s Flight – 28 minutes, down 10
- Jungle Cruise – 27 minutes, down 16
- Astro Orbiter – 21 minutes, down 19
- The Many Adventures of Winnie the Pooh – 16 minutes, down 9
- Haunted Mansion – 16 minutes, down 12
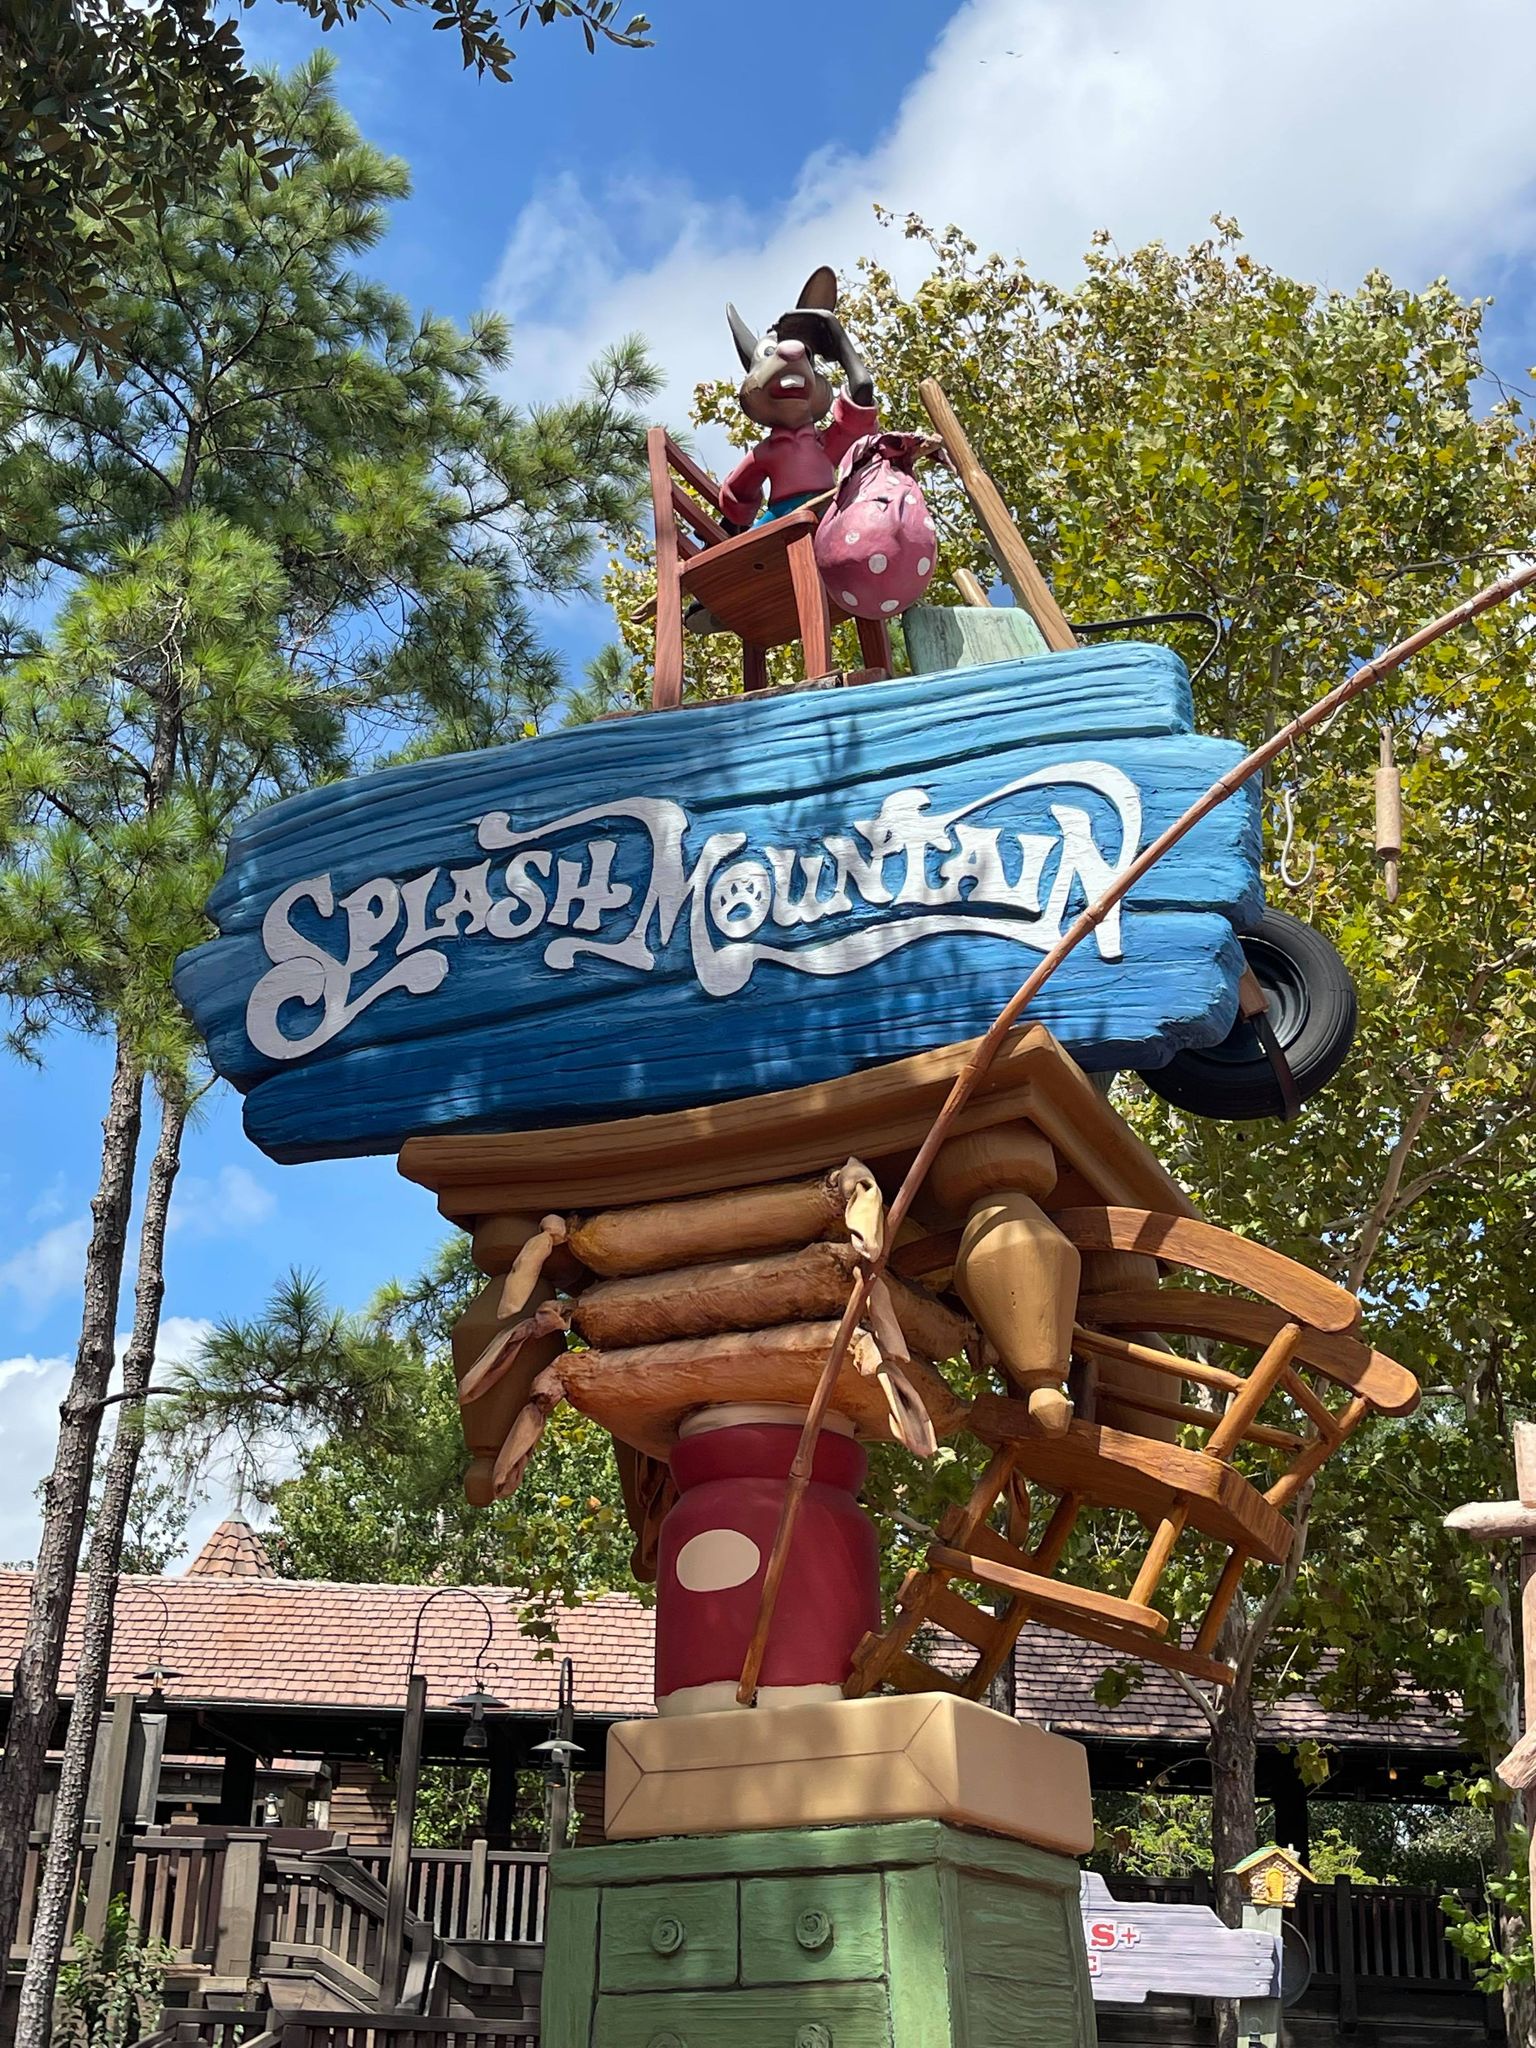
- Splash Mountain – 12 minutes, down 25
- Pirates of the Caribbean – 11 minutes, down 9
- Mickey’s PhilharMagic – 11 minutes – no change
- Buzz Lightyear’s Space Ranger Spin – 11 minutes, down 9
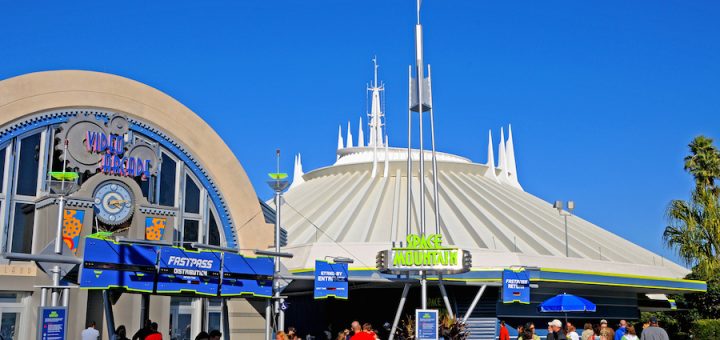
- Space Mountain – 9 minutes, down 13
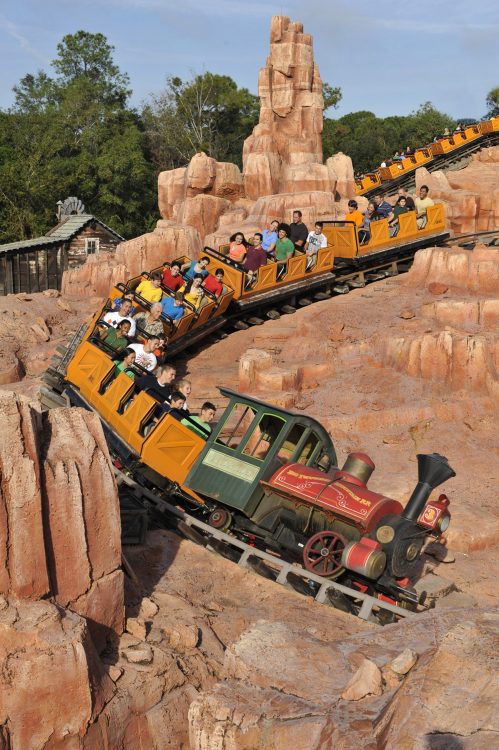
- Big Thunder Mountain Railroad – 8 minutes, down 7
- It’s a Small World – 8 minutes, down 7
- Monsters, Inc. Laugh Floor – 8 minutes, down 4
- Under the Sea ~ Journey of the Little Mermaid – 7 minutes, down 7
- Tomorrowland Speedway – 6 minutes, down 8
- Tomorrowland Transit Authority PeopleMover – 6 minutes, down 4
- Magic Carpets of Aladdin – 6 minutes, down 4
- Prince Charming Regal Carrousel – 6 minutes, down 2
- The Barnstormer – 5 minutes, down 3
- Walt Disney’s Carousel of Progress – 4 minutes, no change
- Mad Tea Party – 4 minutes, down 2
- Dumbo the Flying Elephant – 4 minutes, down 4
- Country Bears Jamboree – 4 minutes, down 2
Friends, the WORST waits at Walt Disney World this past week were 36 minutes each for Slinky Dog Dash and Seven Dwarfs Mine Train!
Also, Splash Mountain somehow dropped from 37 to 12 minutes, and Space Mountain had a sub-10 minute wait!!!
This was a week for the ages!