WDW Wait Times for Fourth Week of July 2024
We’ve got a whole new ballgame this week.
Now that Disney Genie+ is thankfully dead, crowd behavior should change under the new system.
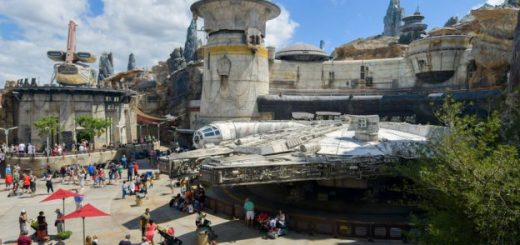
Photo: Disney
Lightning Lane Multi Pass returns the tiered reservation booking we’d known during the FastPass era.
However, character greetings aren’t a part of the new Lightning Lane options.
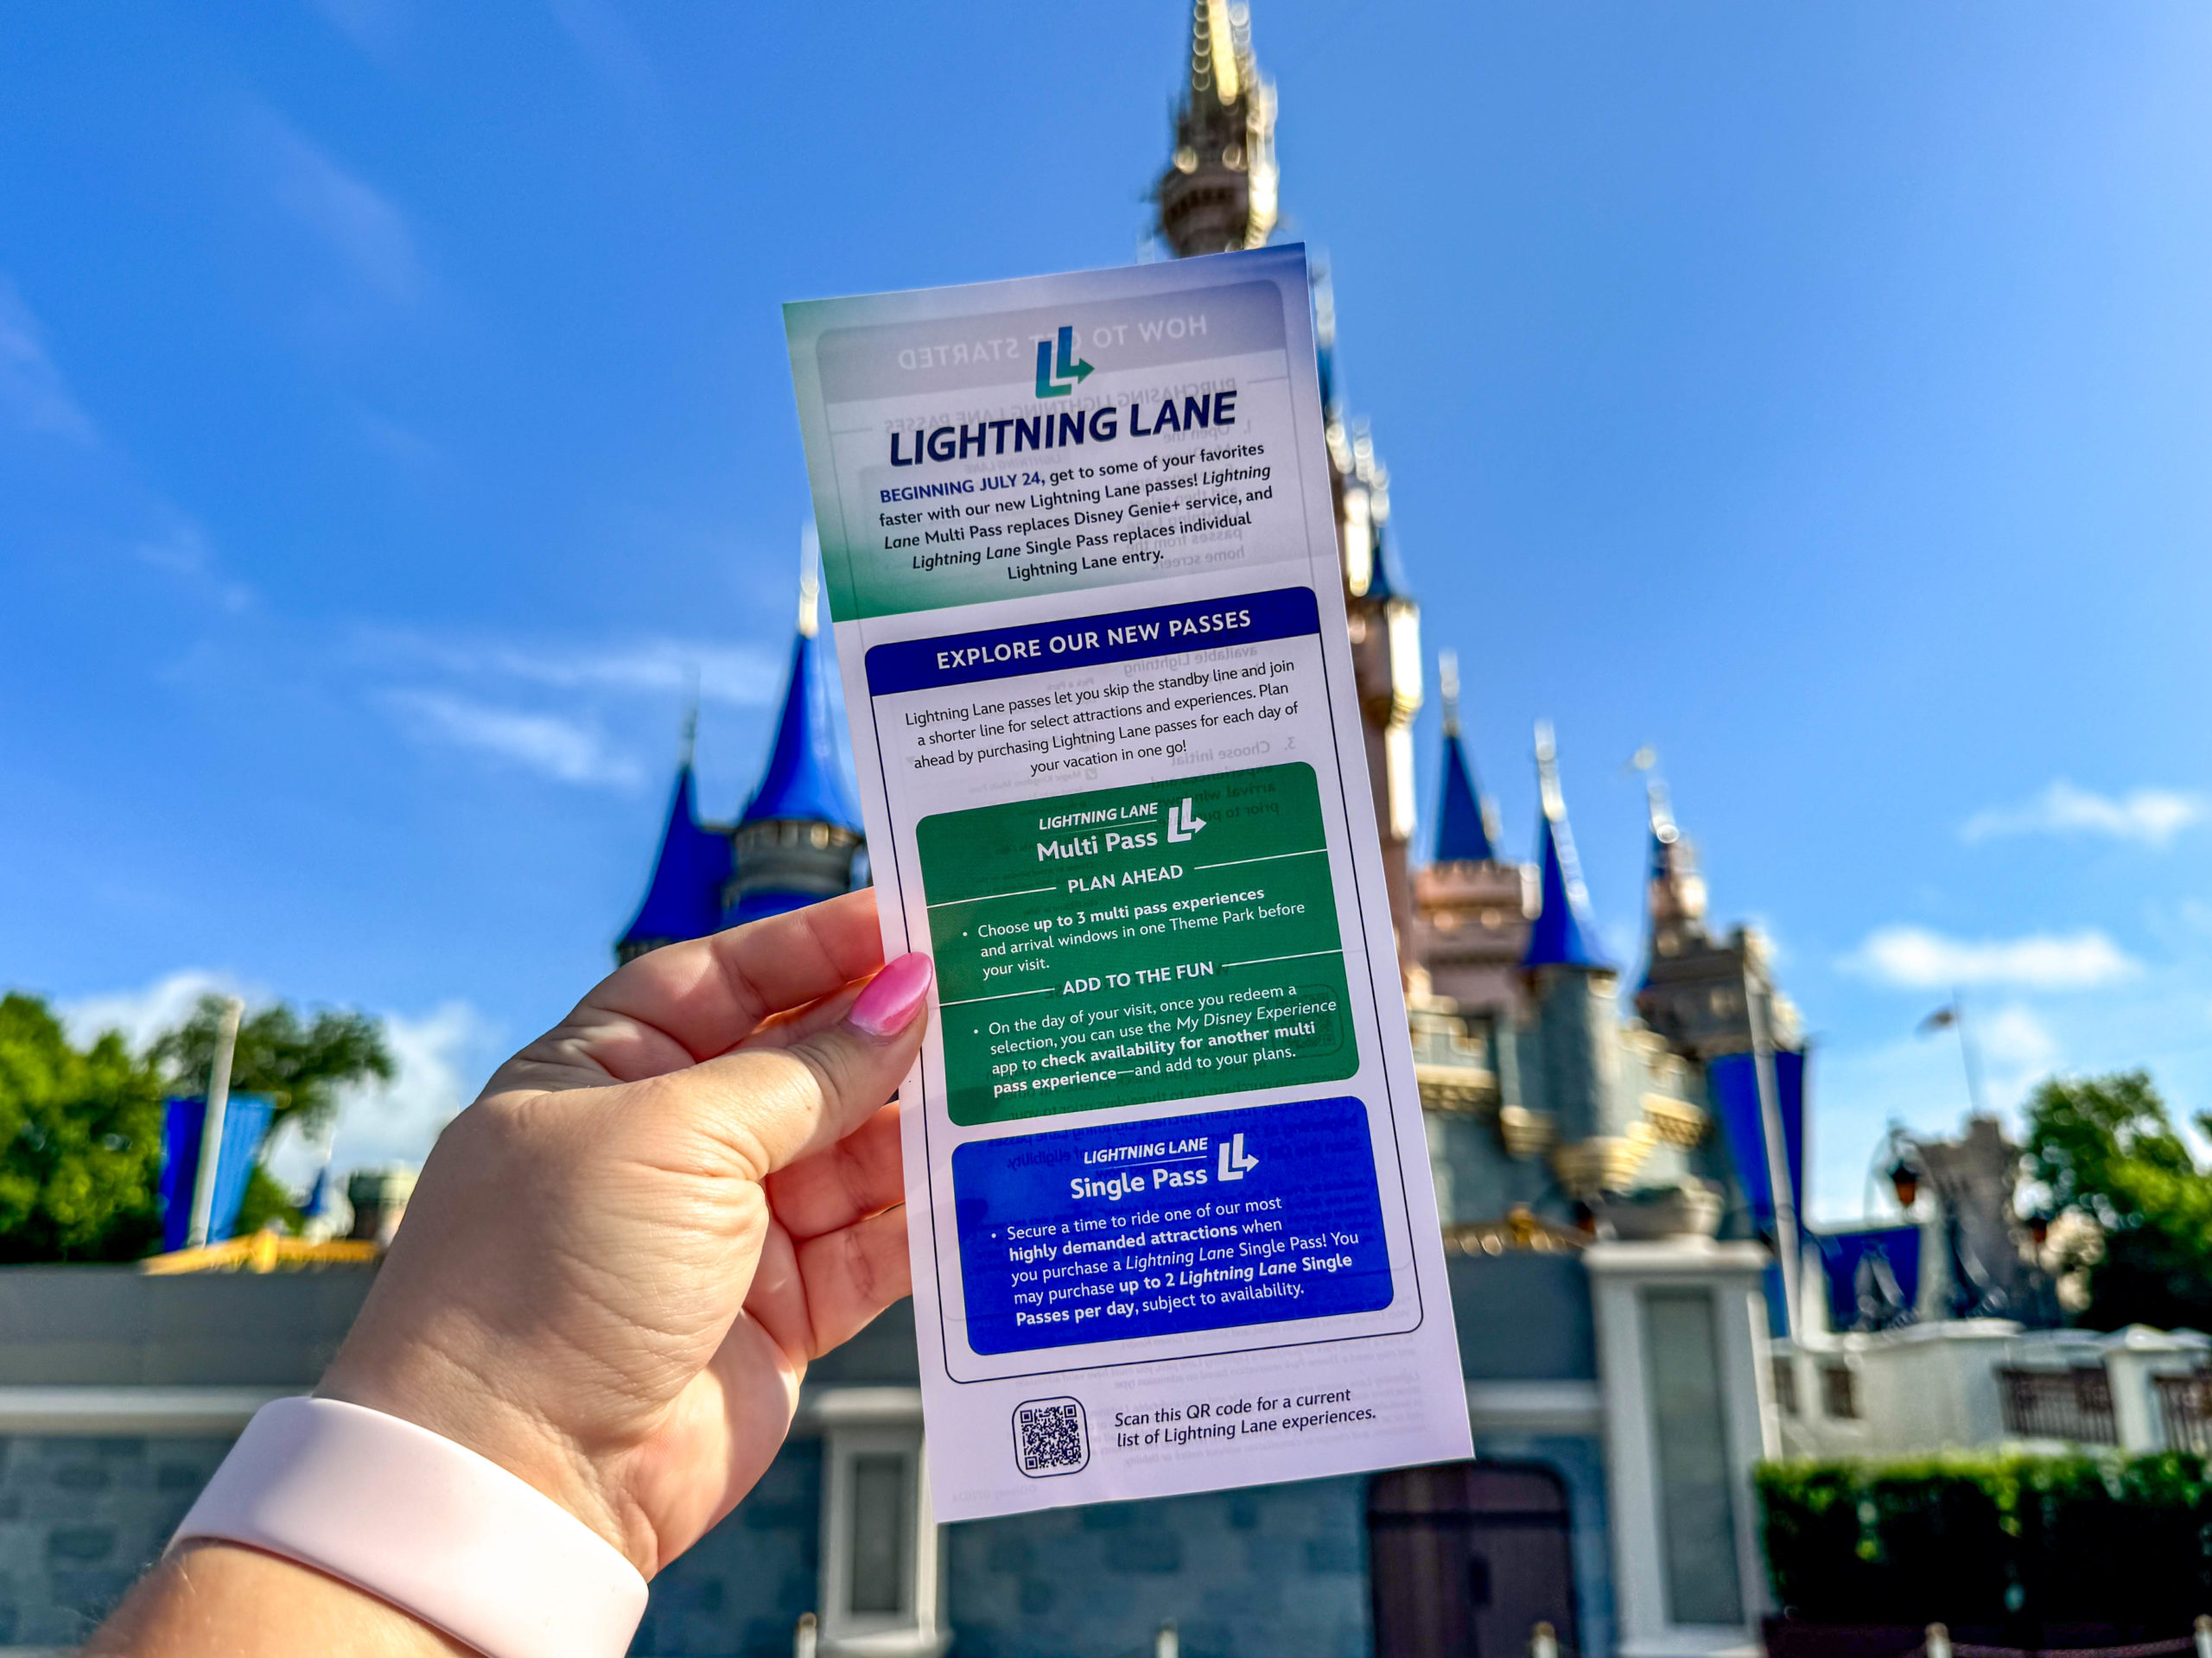
Lightning Lane
So, we’ll witness some gradual changes with line time as guests grow familiar with the system.
Here are the average Walt Disney World wait times for the fourth week of July 2024.
Disney’s Animal Kingdom
Let’s begin with an obvious assertion. We have little idea how Lightning Lane Multi Pass (LLMP) will impact the crowds.
We can make some logical inferences based on what happened during the Lightning Lane era, but that’s outdated information.
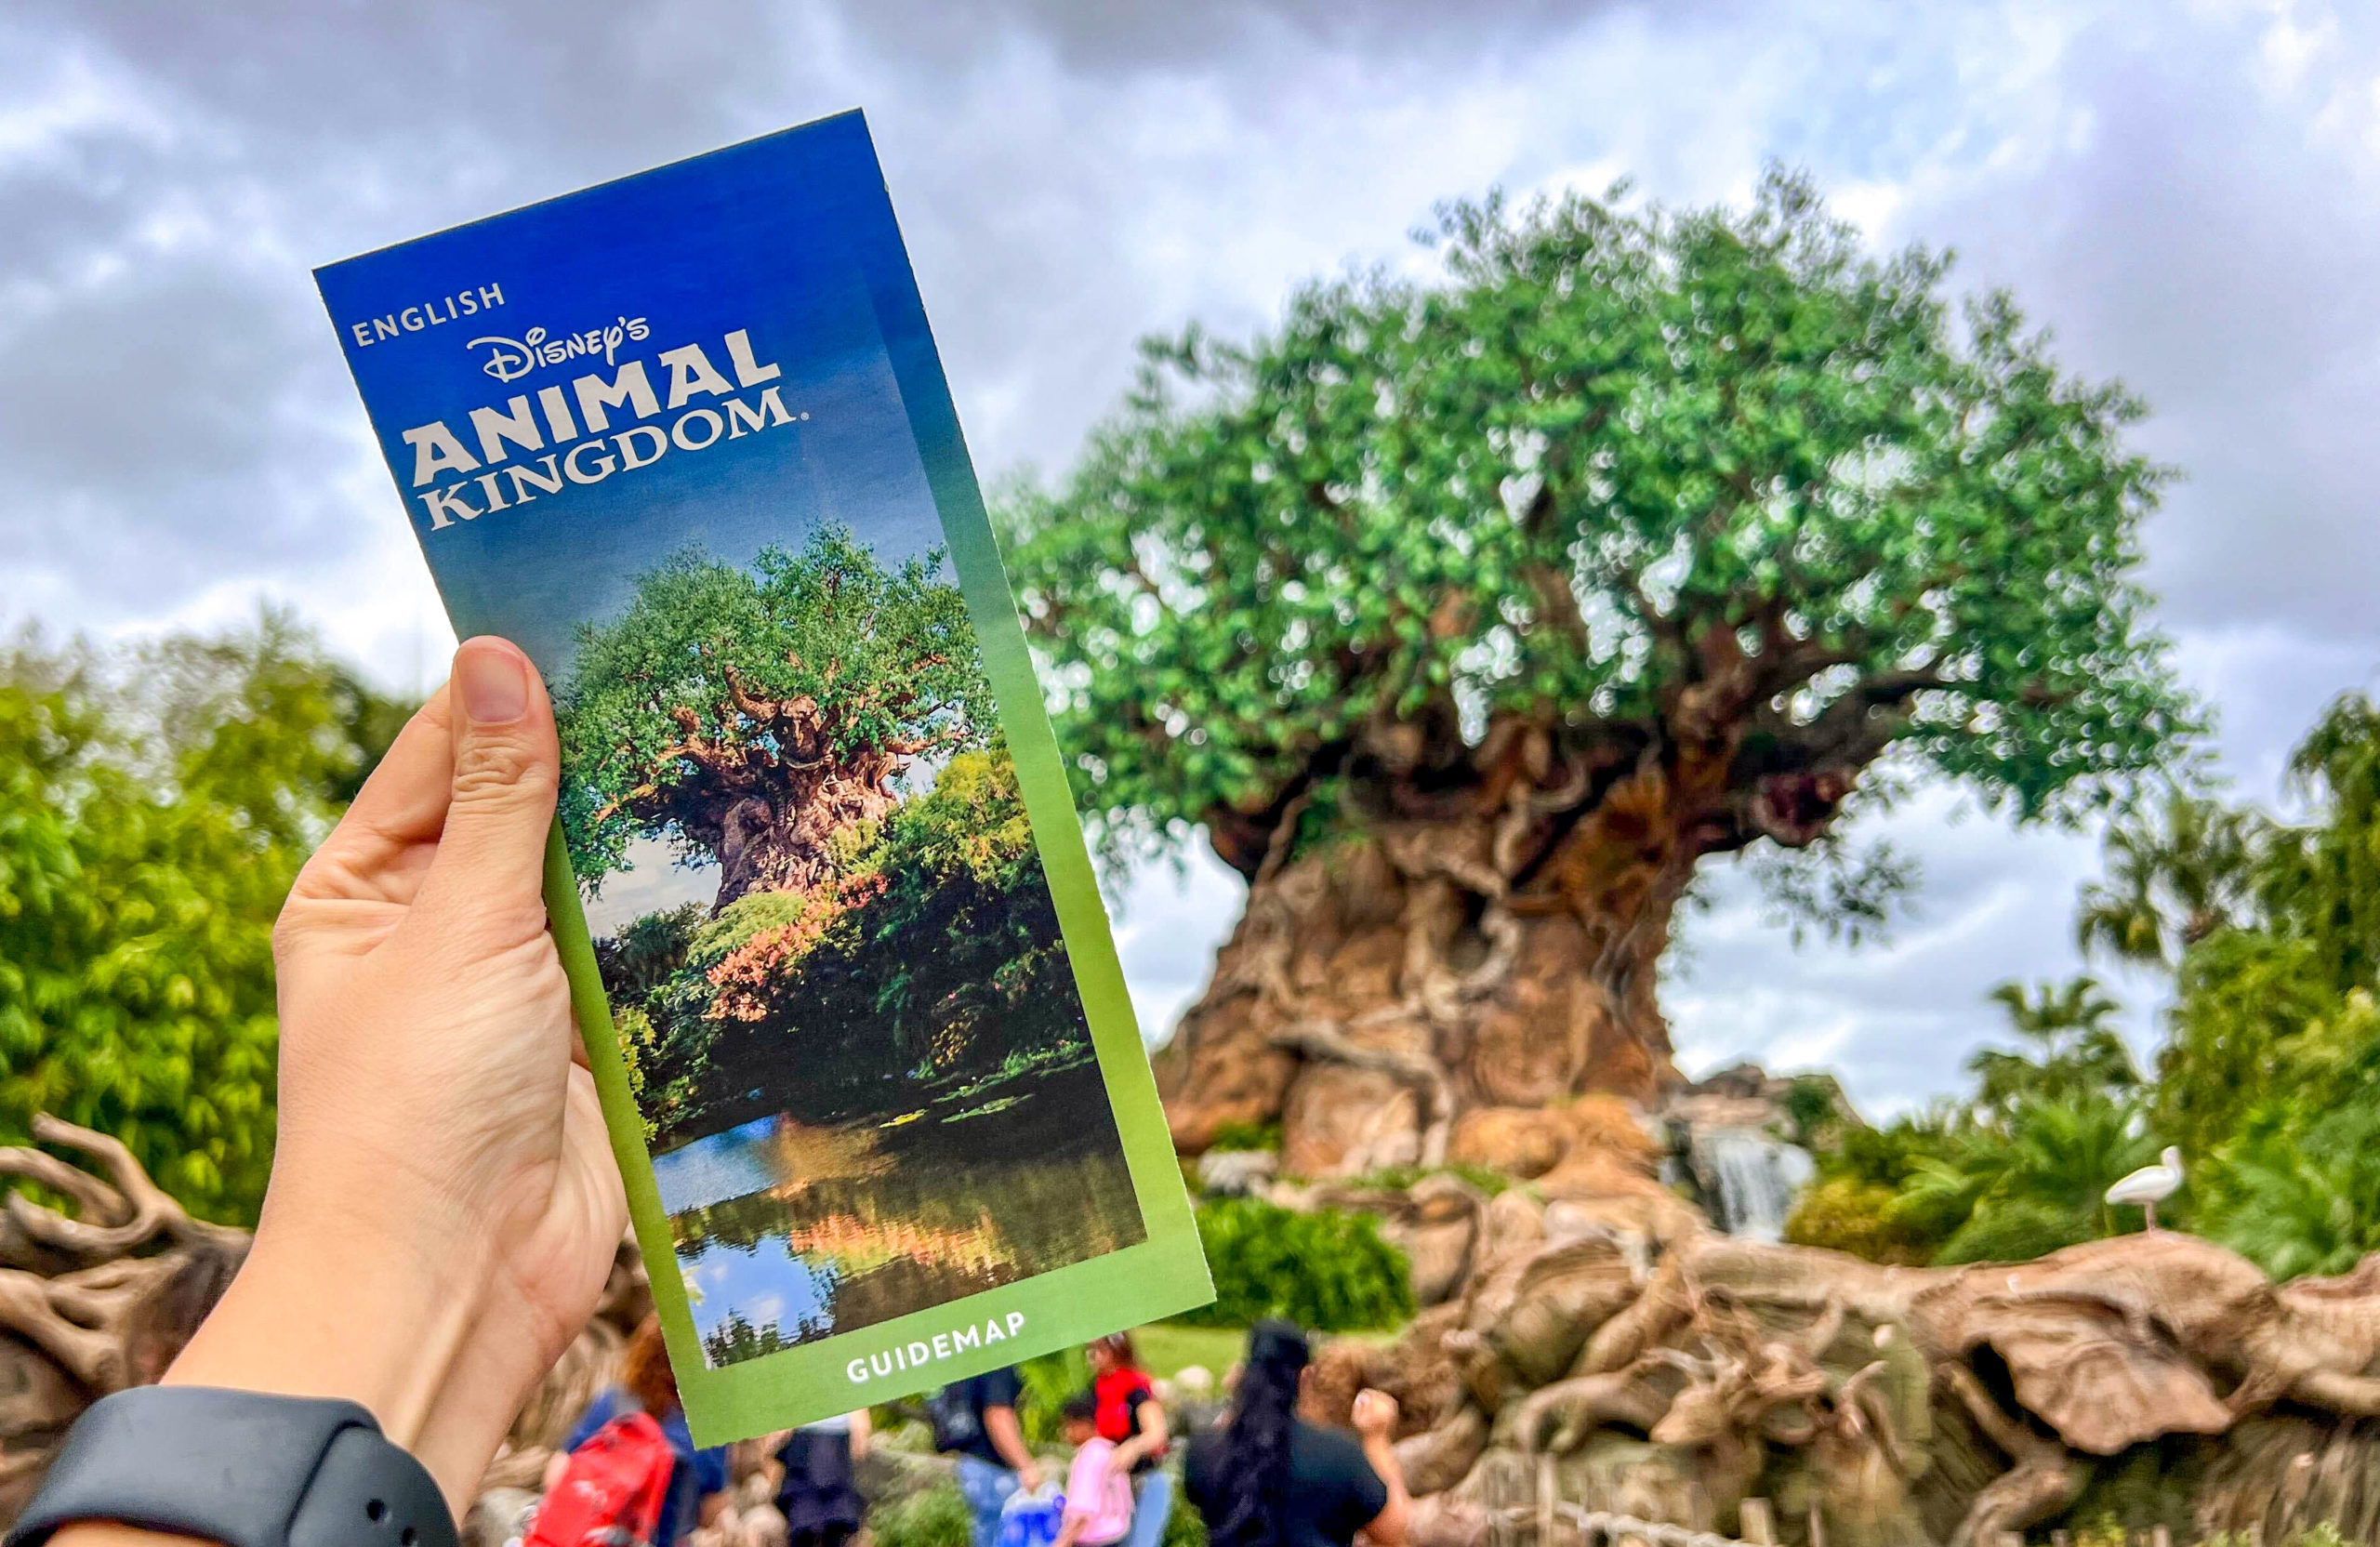
Disney’s Animal Kingdom
Virtual queues and Lightning Lane Single Pass didn’t exist then. So, it’s not an apples-to-apples comparison.
Instead, we’ll explore data over the next few weeks, starting with Animal Kingdom today.
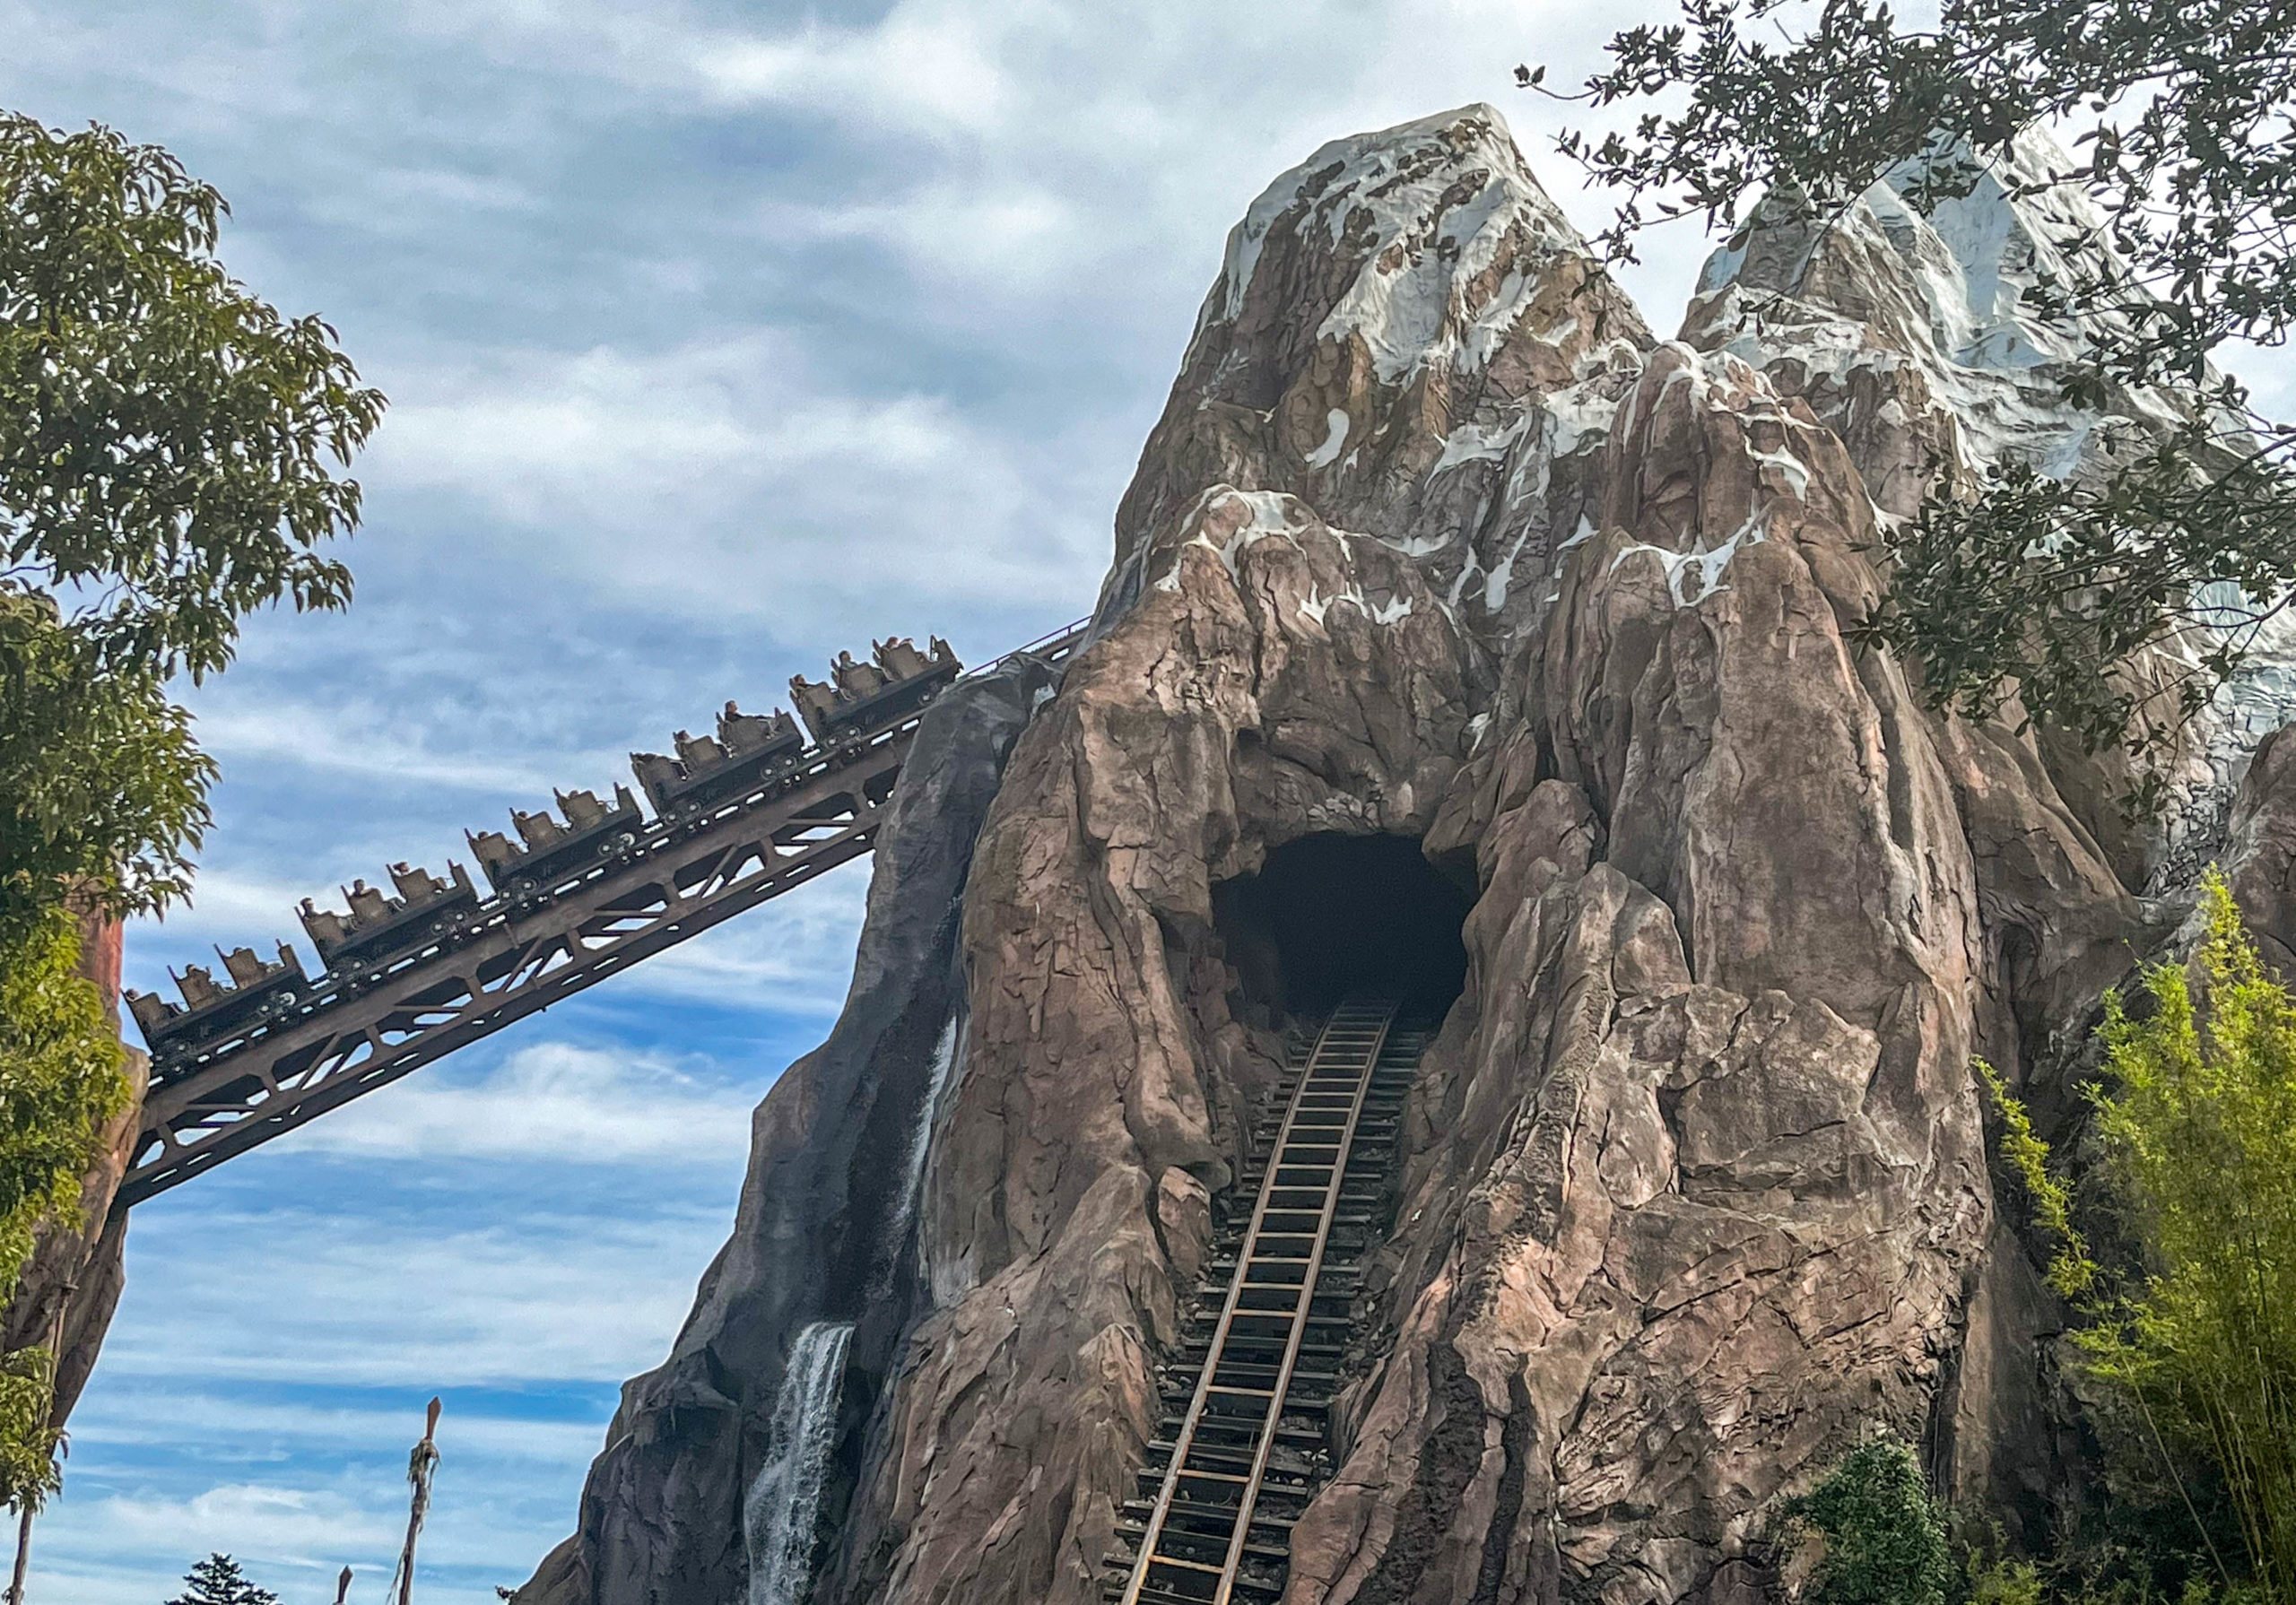
Expedition Everest
The most impacted attraction here will be Adventurers Outpost, which is no longer available to reserve via digital queue.
We’ll monitor these attractions to learn whether their wait times increase or decrease.
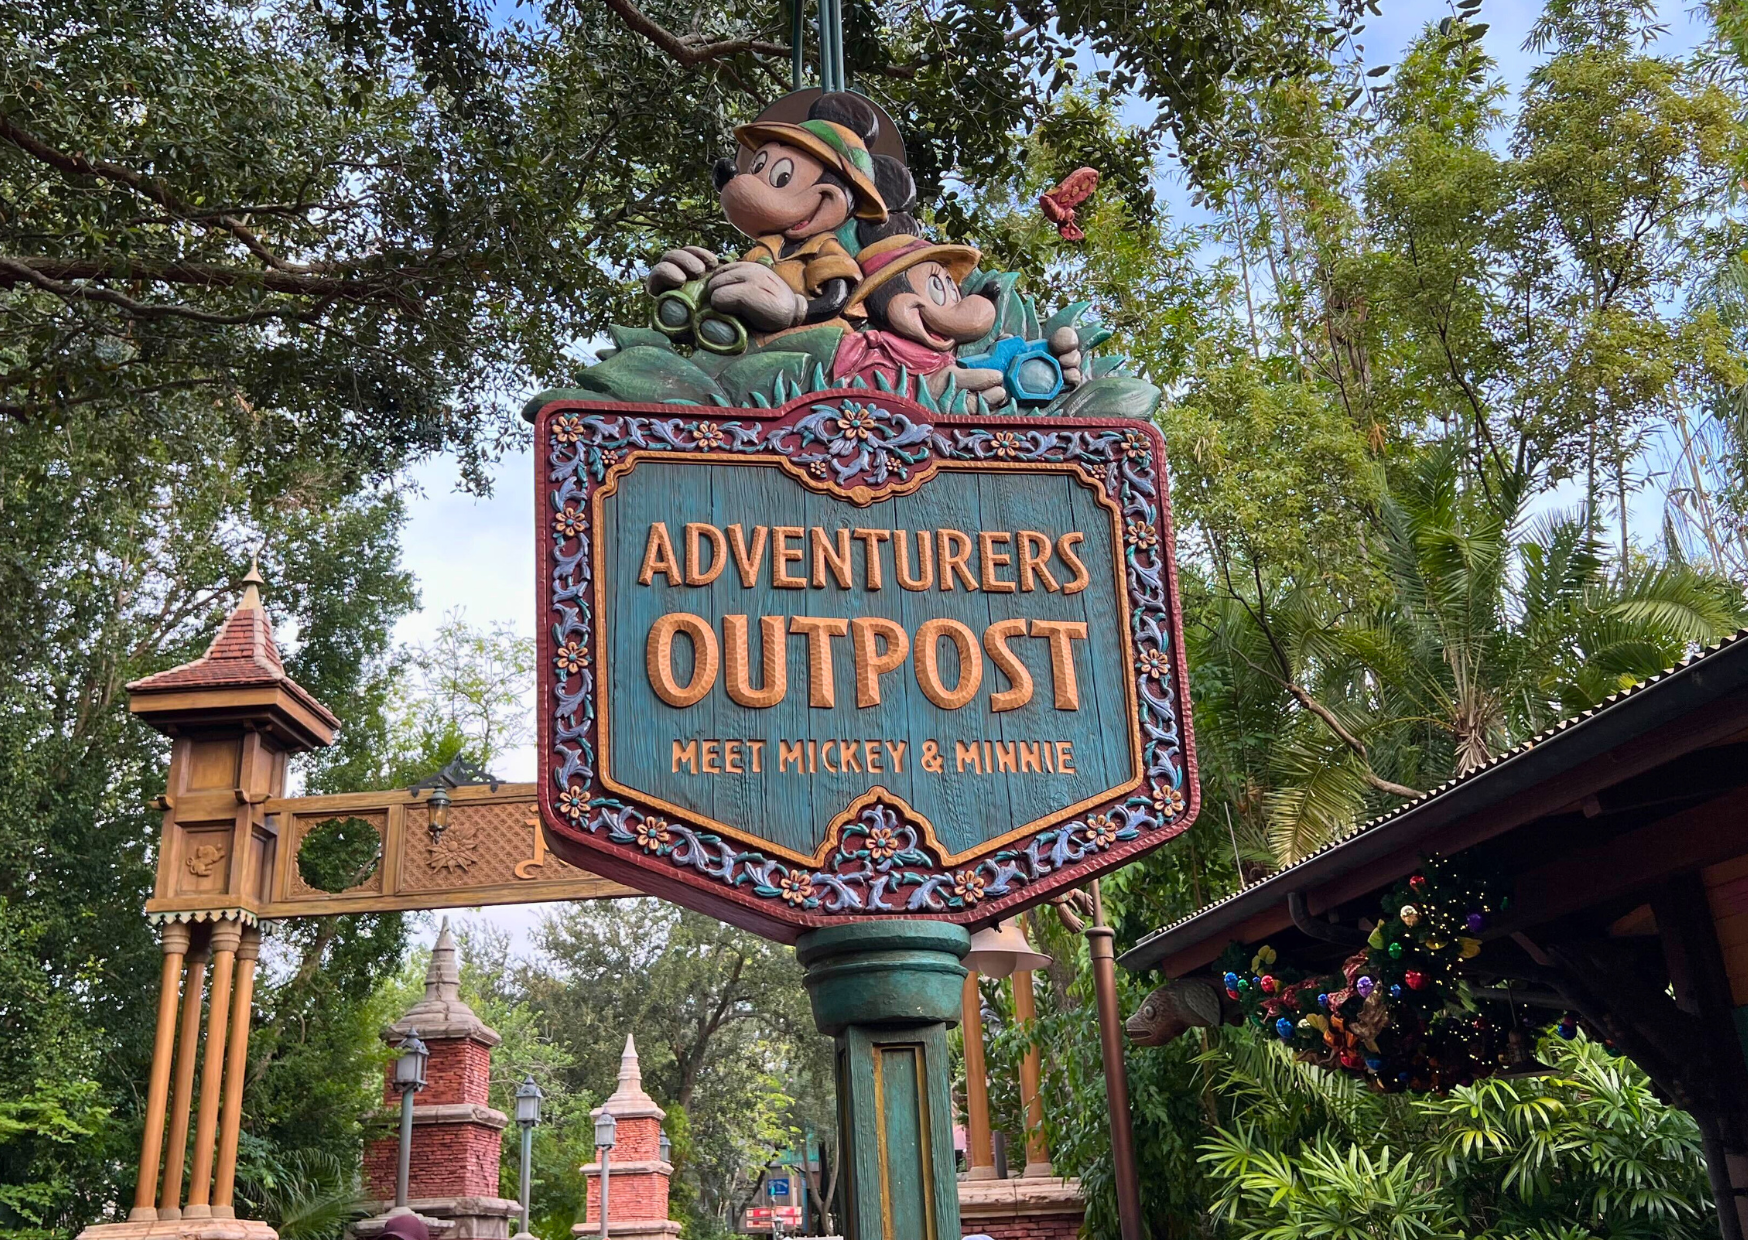
Adventurer’s Outpost
Please remember that the new Lightning Lane system didn’t occur until the middle of the week, though.
So, half of this data reflects the old system. Here are Animal Kingdom’s average wait times.
- Avatar Flight of Passage – 89 minutes, down 4
- Kali River Rapids – 60 minutes, down 1
- Na’vi River Journey – 60 minutes, no change
- Expedition Everest – 45 minutes, no change
- Adventurers Outpost – 40 minutes, down 2
- DINOSAUR – 34 minutes, up 6
- Kilimanjaro Safaris – 30 minutes, up 3
- It’s Tough to Be a Bug! – 10 minutes, no change
- TriceraTop Spin – 8 minutes, down 2
Overall, Animal Kingdom guests stood in line for an average of 42 minutes, the same as last week.
The question is whether the Adventurers Outpost drop is a blip or an indication that character greetings will require shorter waits now.
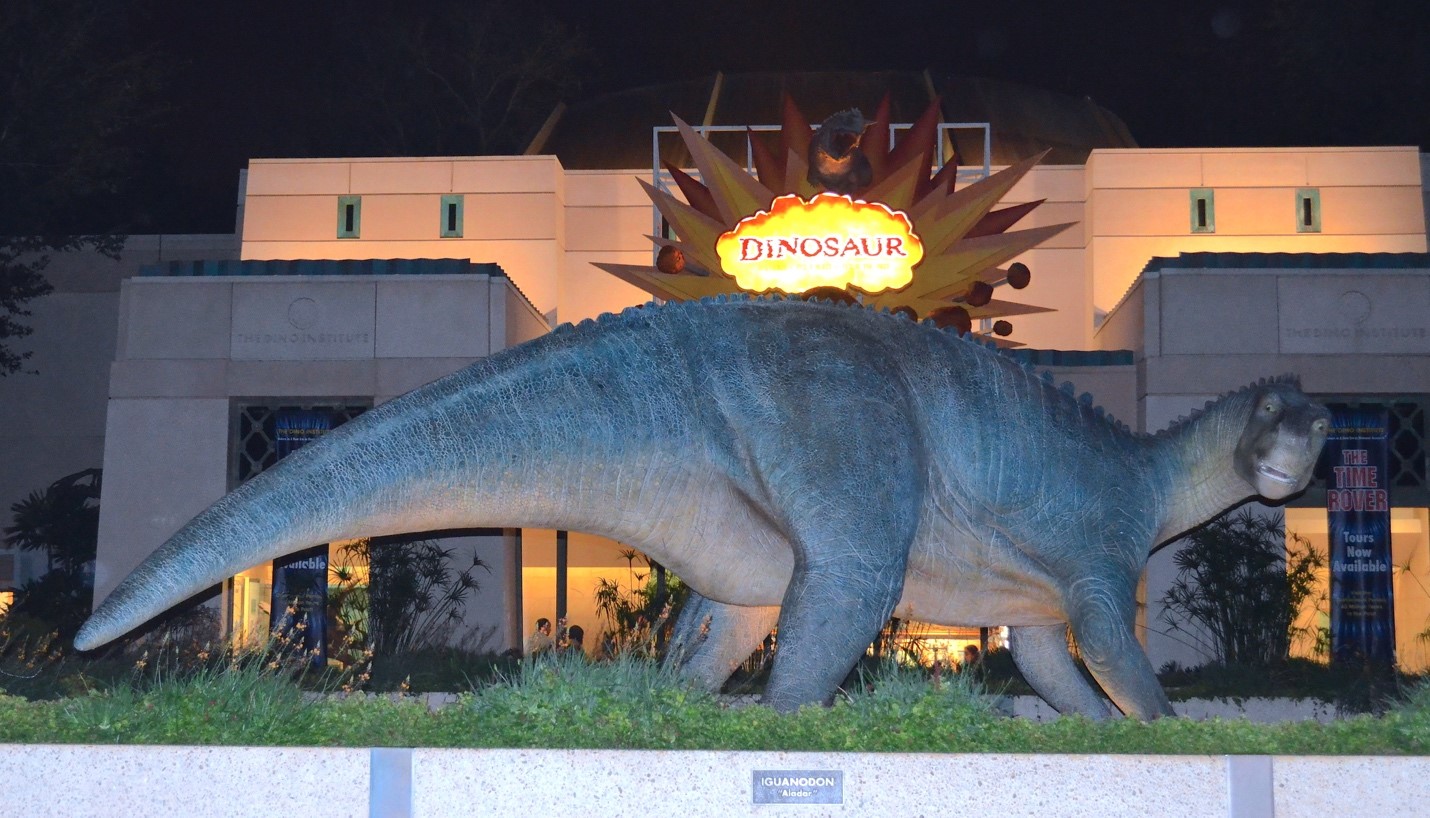
Dinosaur
We’ll track that at the other three parks and over the next several weeks.
Disney’s Hollywood Studios
Here’s the park I believe will witness the deepest impact under the new system.
Hollywood Studios has restored the tiers for LLMP, a much-needed change for a top-heavy theme park.
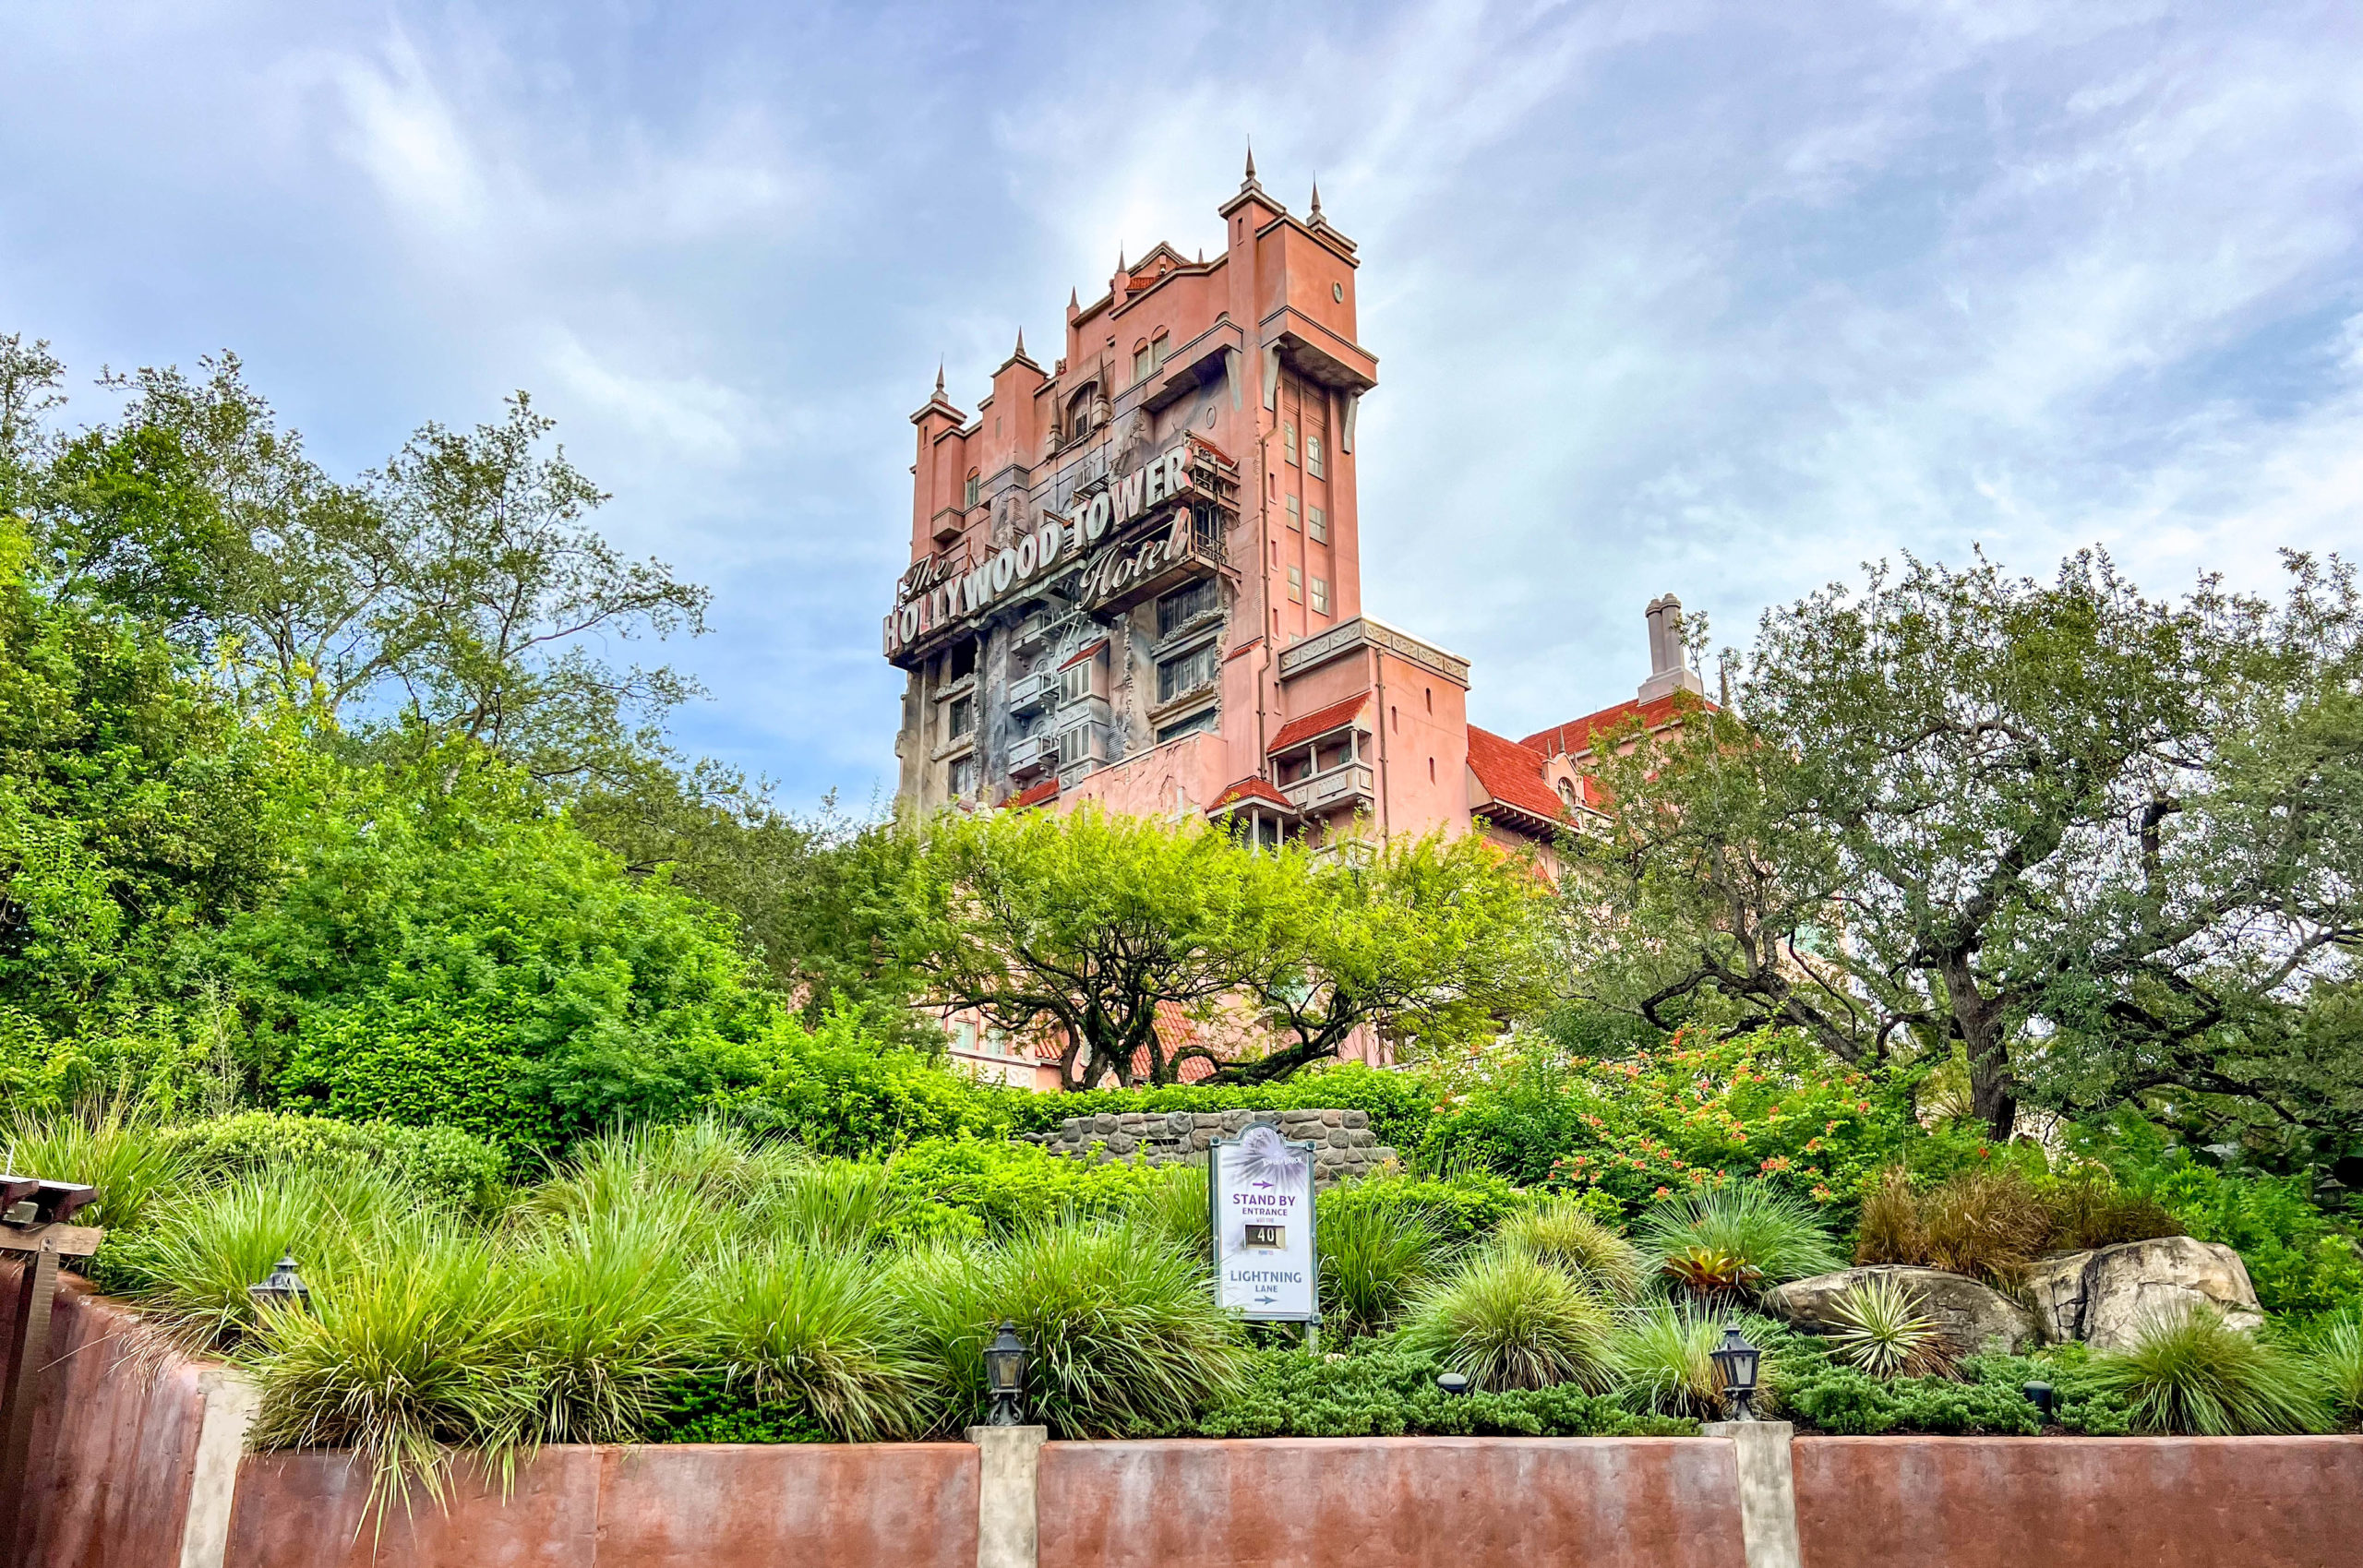
Tower of Terror
However, none of the changes are written in stone yet, as demonstrated by the fact that one already changed temporarily.
You should expect to witness some minor tweaks like this over the next few months as park officials evaluate early results.
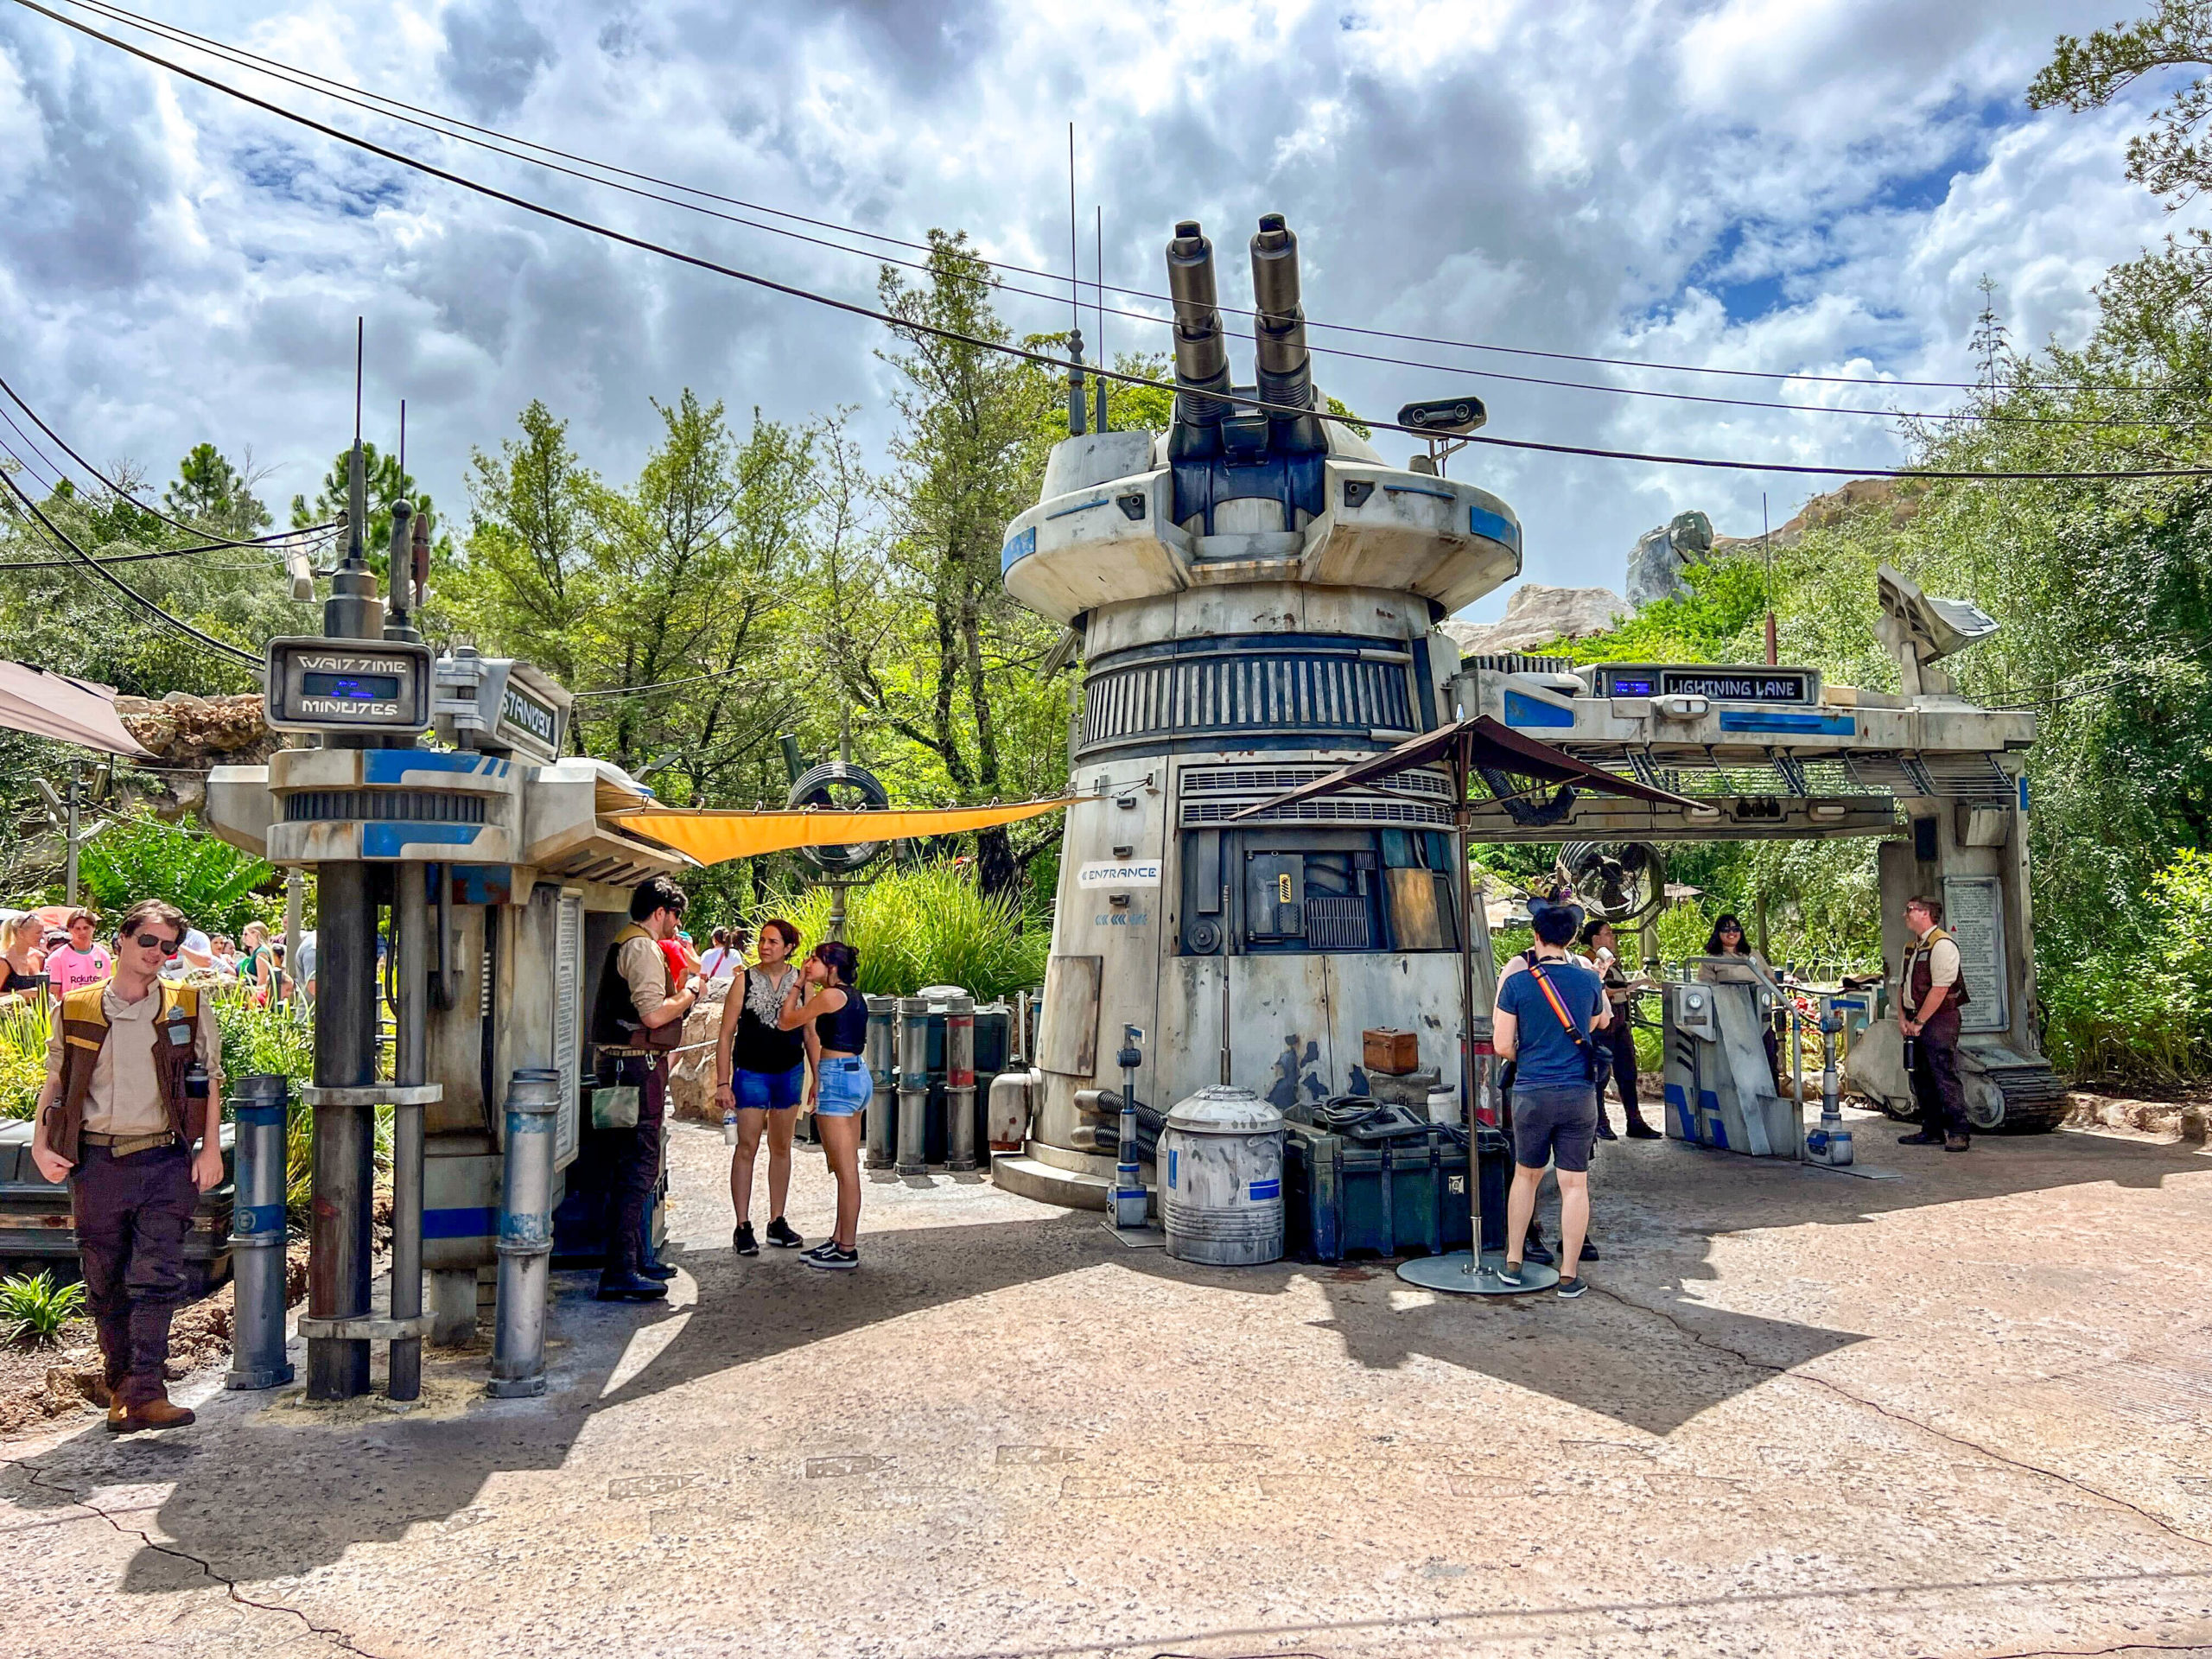
Star Wars: Rise of the Resistance
We’re closely tracking two attractions from this list, as Celebrity Spotlight and Red Carpet Dreams aren’t available on LLMP.
Still, the changes in E-ticket attraction wait times provide the most intrigue at Hollywood Studios.
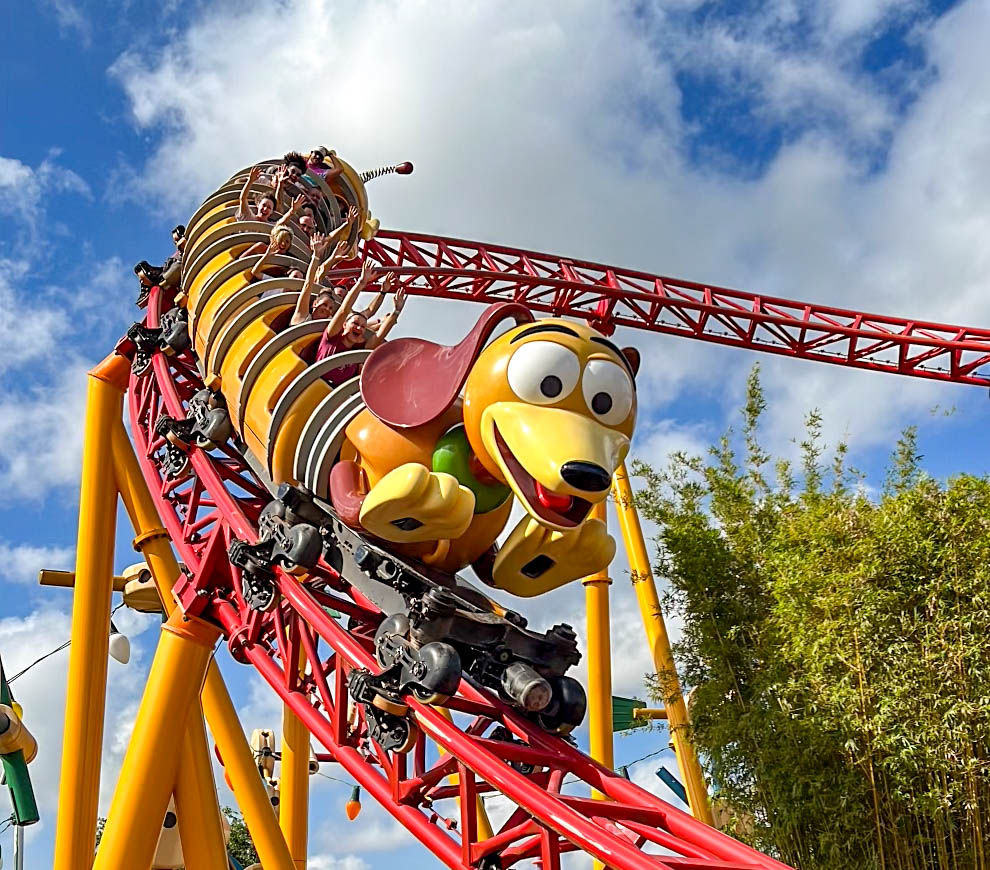
Slinky Dog Dash
Here are the park’s average wait times for the past week.
- Slinky Dog Dash – 80 minutes, up 6
- Rock ‘n’ Roller Coaster Starring Aerosmith – 75 minutes, up 8
- Star Wars: Rise of the Resistance – 70 minutes, up 6
- Millennium Falcon: Smugglers Run – 61 minutes, down 4
- Toy Story Mania! – 61 minutes, up 9
- Twilight Zone Tower of Terror – 60 minutes, up 3
- Mickey & Minnie’s Runaway Railway – 54 minutes, no change
- Red Carpet Dreams – 40 minutes, up 2
- Alien Swirling Saucers – 38 minutes, up 1
- Star Tours – The Adventures Continue! – 21 minutes, up 6
- Lightning McQueen’s Racing Academy – 15 minutes, no change
- Celebrity Spotlight – 15 minutes, up 1
- Muppet*Vision 3D – 10 minutes, no change
Overall, the average Hollywood Studios attraction required a wait of 43 minutes, which is four minutes more than last time.
So, that’s similar to last week. However, one stat jumps out here. It’s that the park’s most popular rides ticked up quite a bit.
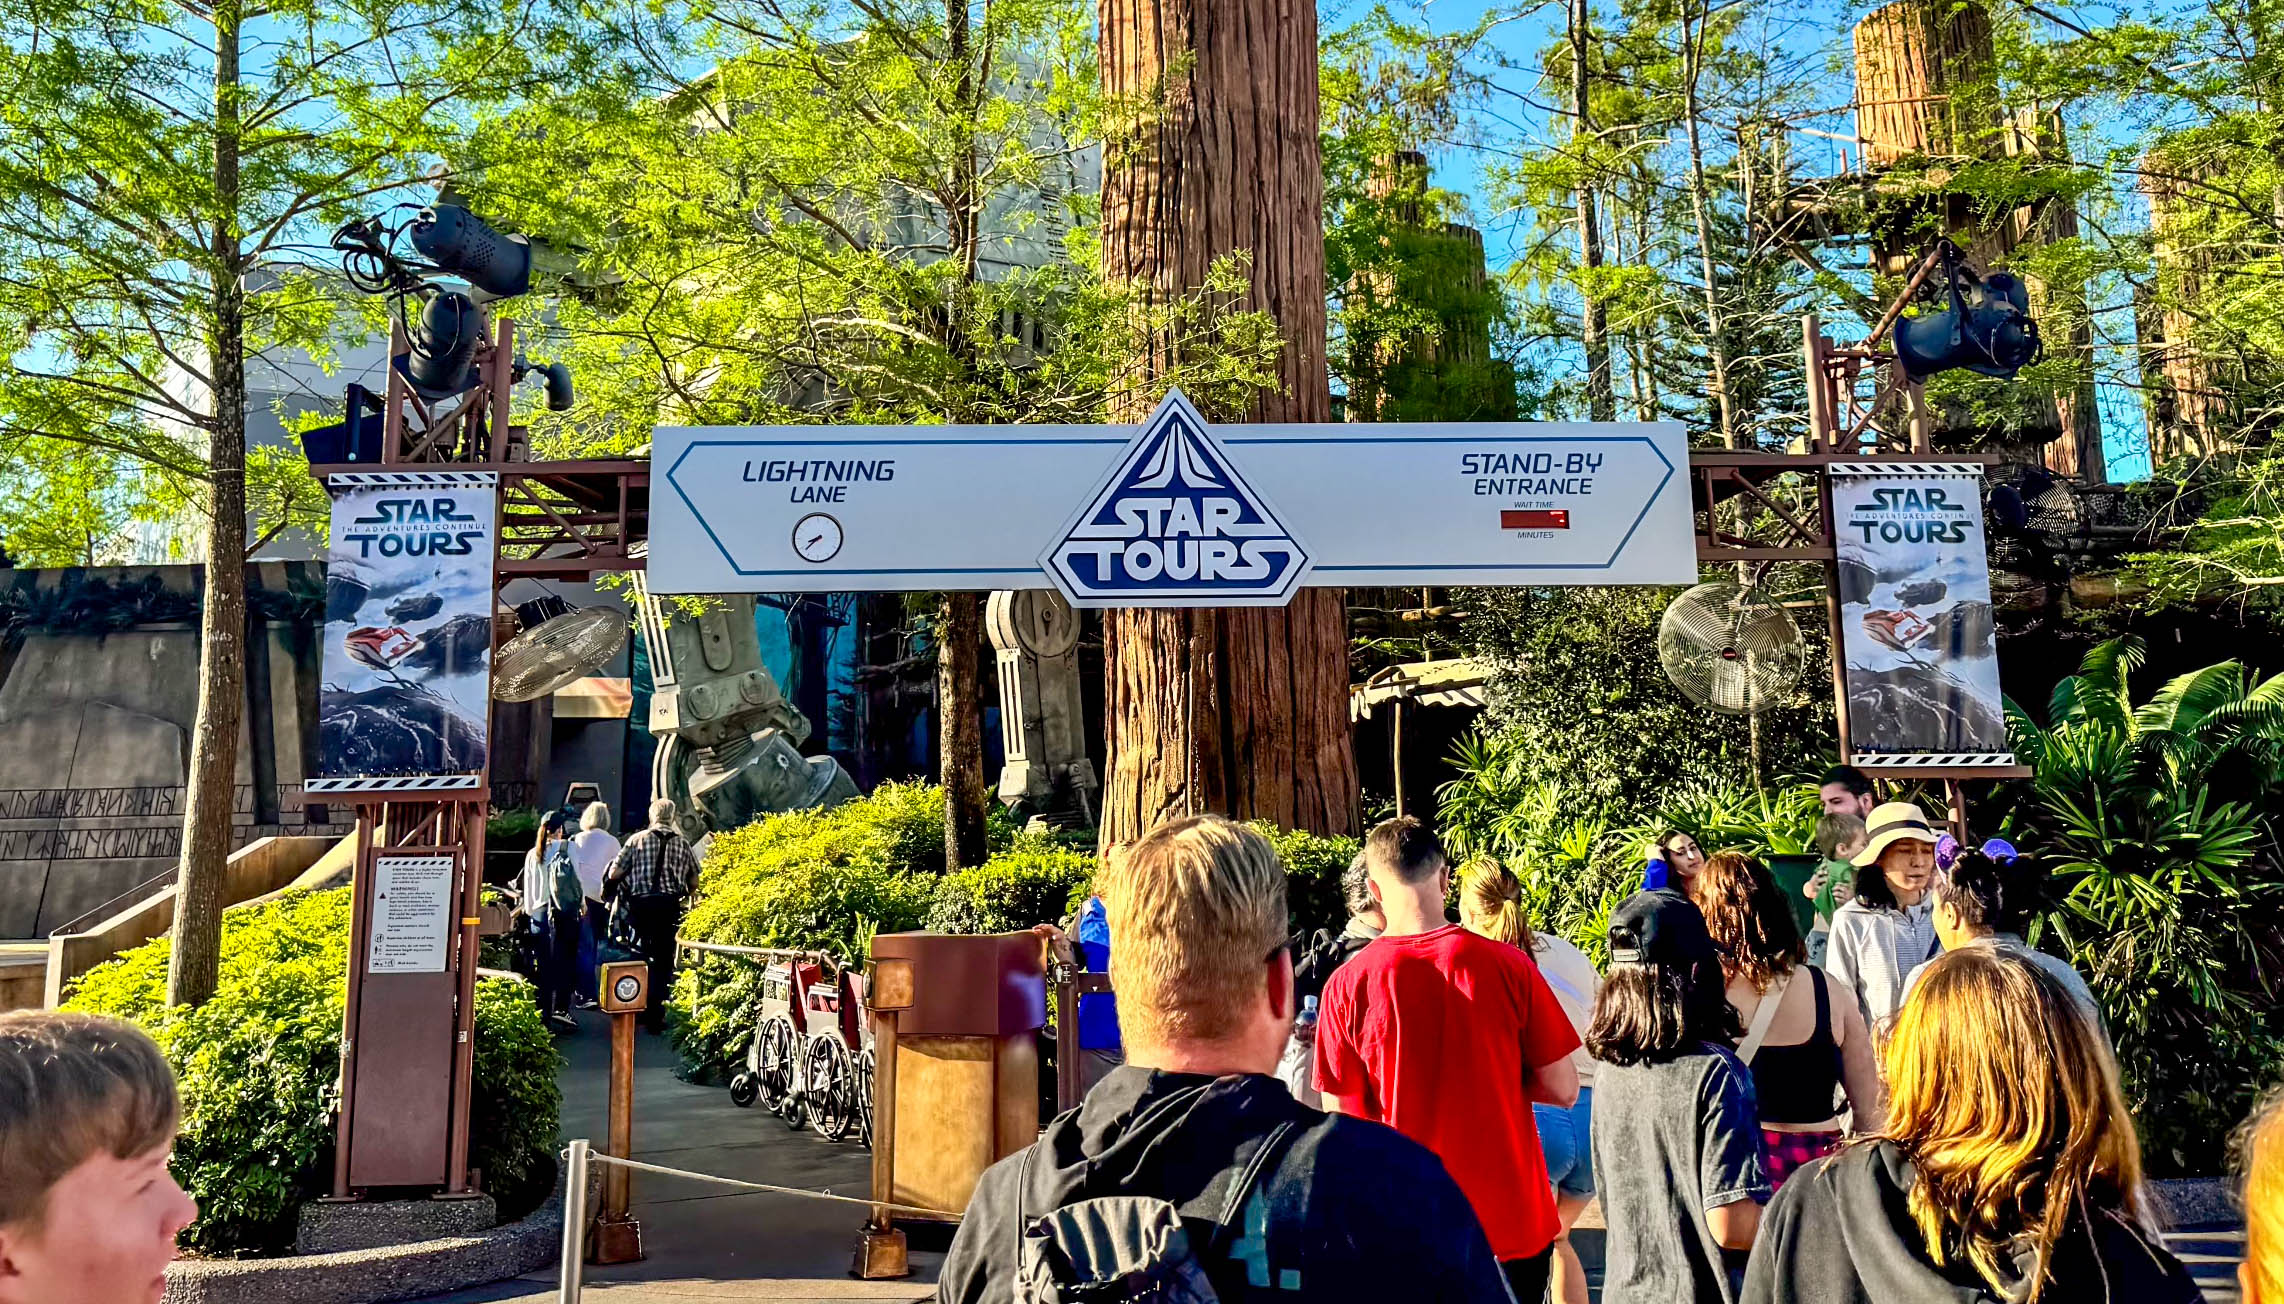
Star Tours
Is that noise in the data or a sign of things to come? I’m inclined to think the latter.
EPCOT
At EPCOT, two attractions tower above the rest. Those are obviously Frozen Ever After and Remy’s Ratatouille Adventure.
Now, they’re part of the top tier of LLMP, as is the ride that generally requires the third-longest wait, Soarin’ Around the World.
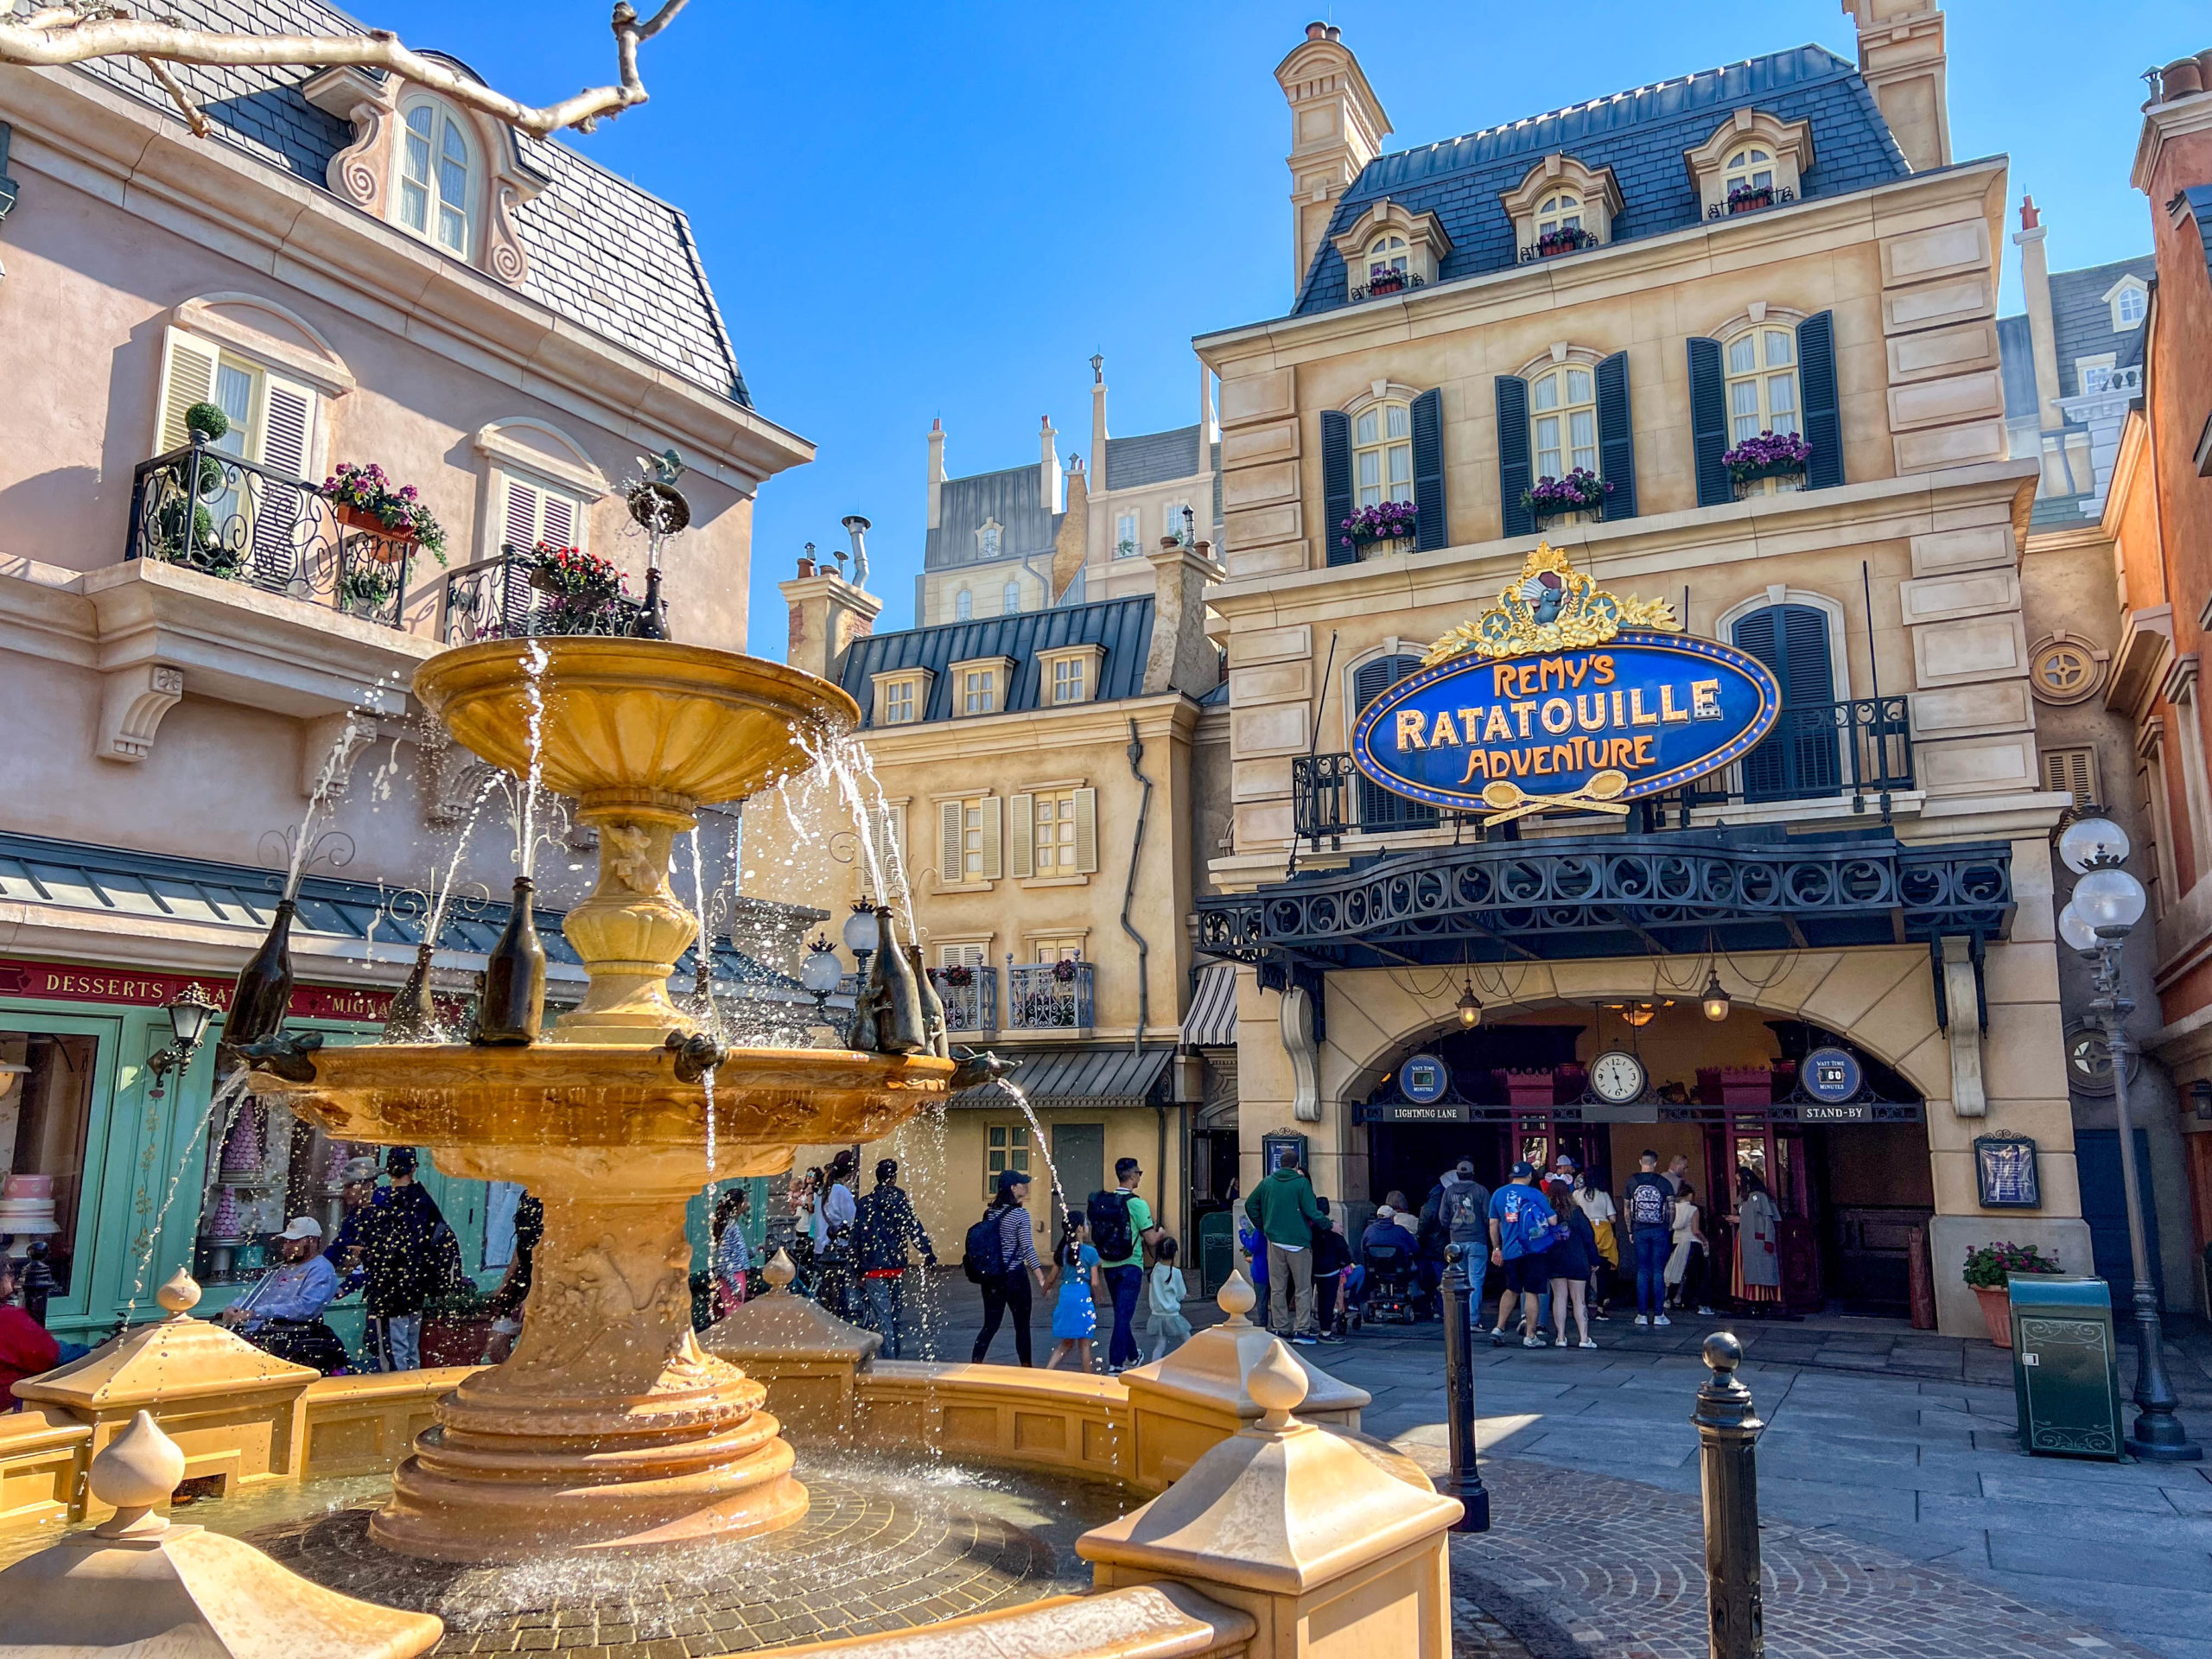
Remy’s Ratatouille Adventure
After those three, the attraction most directly impacted by the Lightning Lane change is Royal Sommerhus.
When Disney announced the new change, it was the first attraction that sprang to my mind.
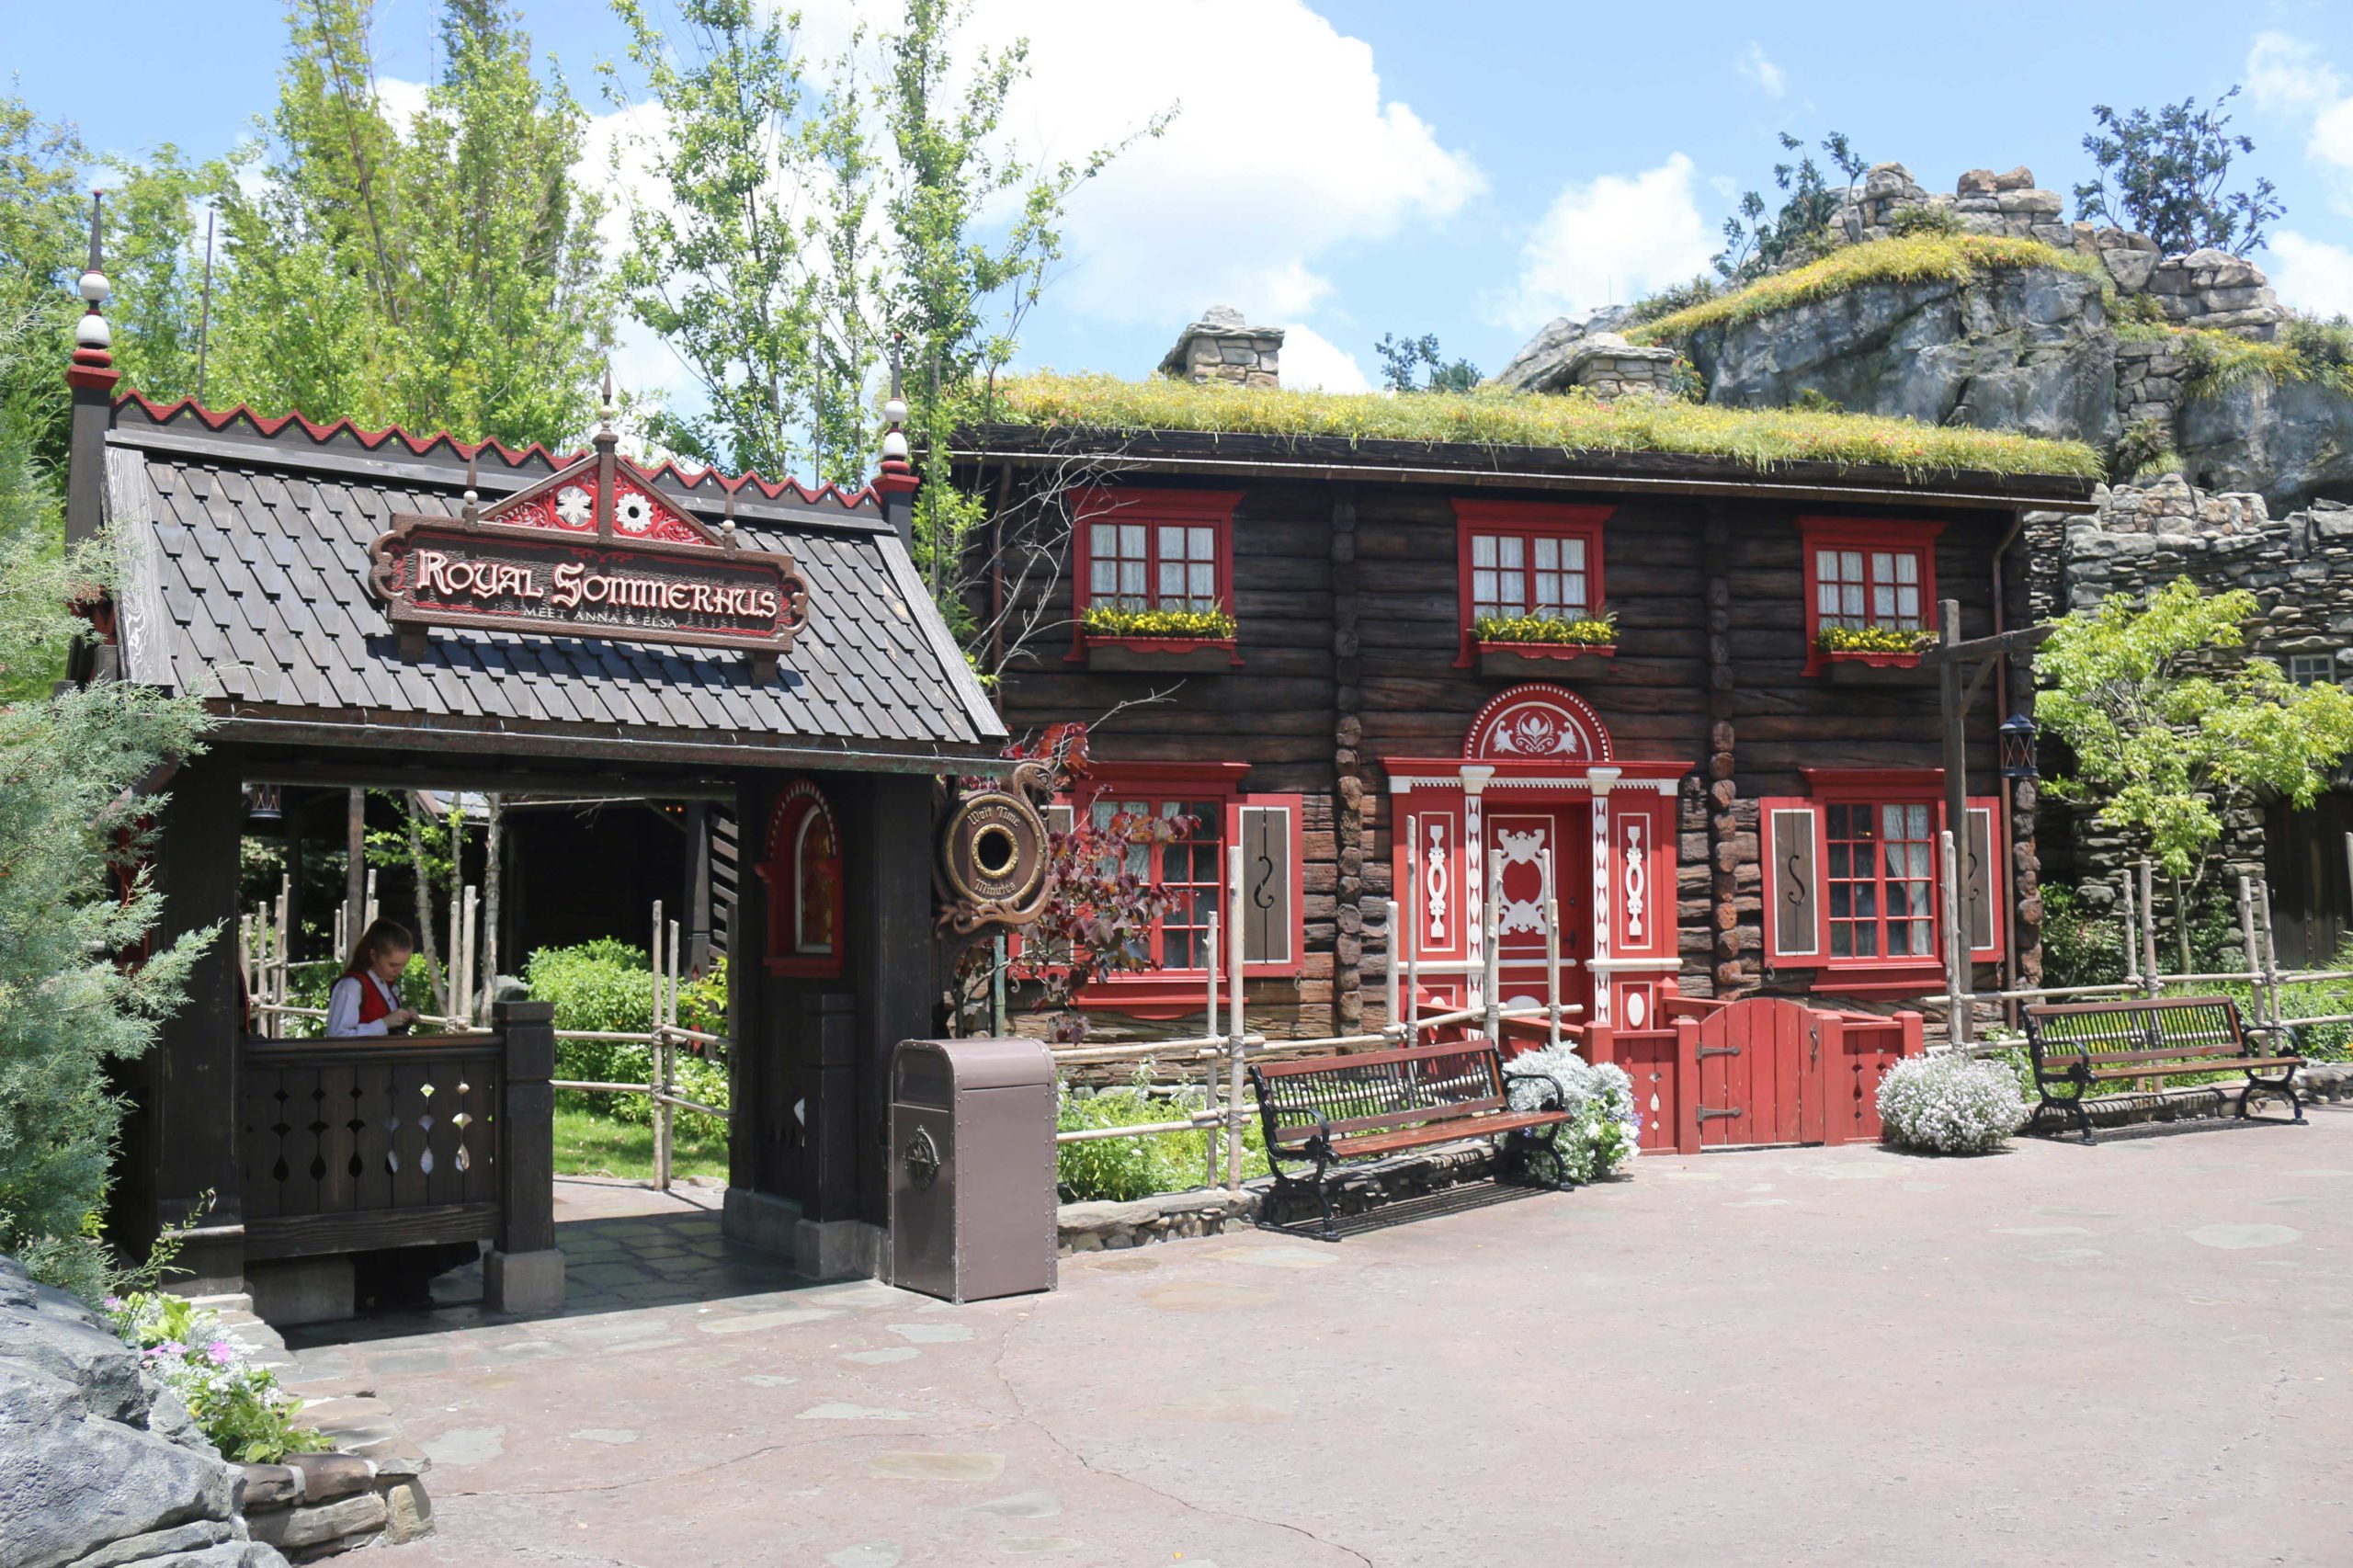
Royal Sommerhus at Norway Pavilion
Then again, the quirk here is that EPCOT’s newest experience, Meet Mickey & Friends, isn’t available for virtual queuing.
That’s a somewhat odd decision, but I’m confident Disney knows what it’s doing.
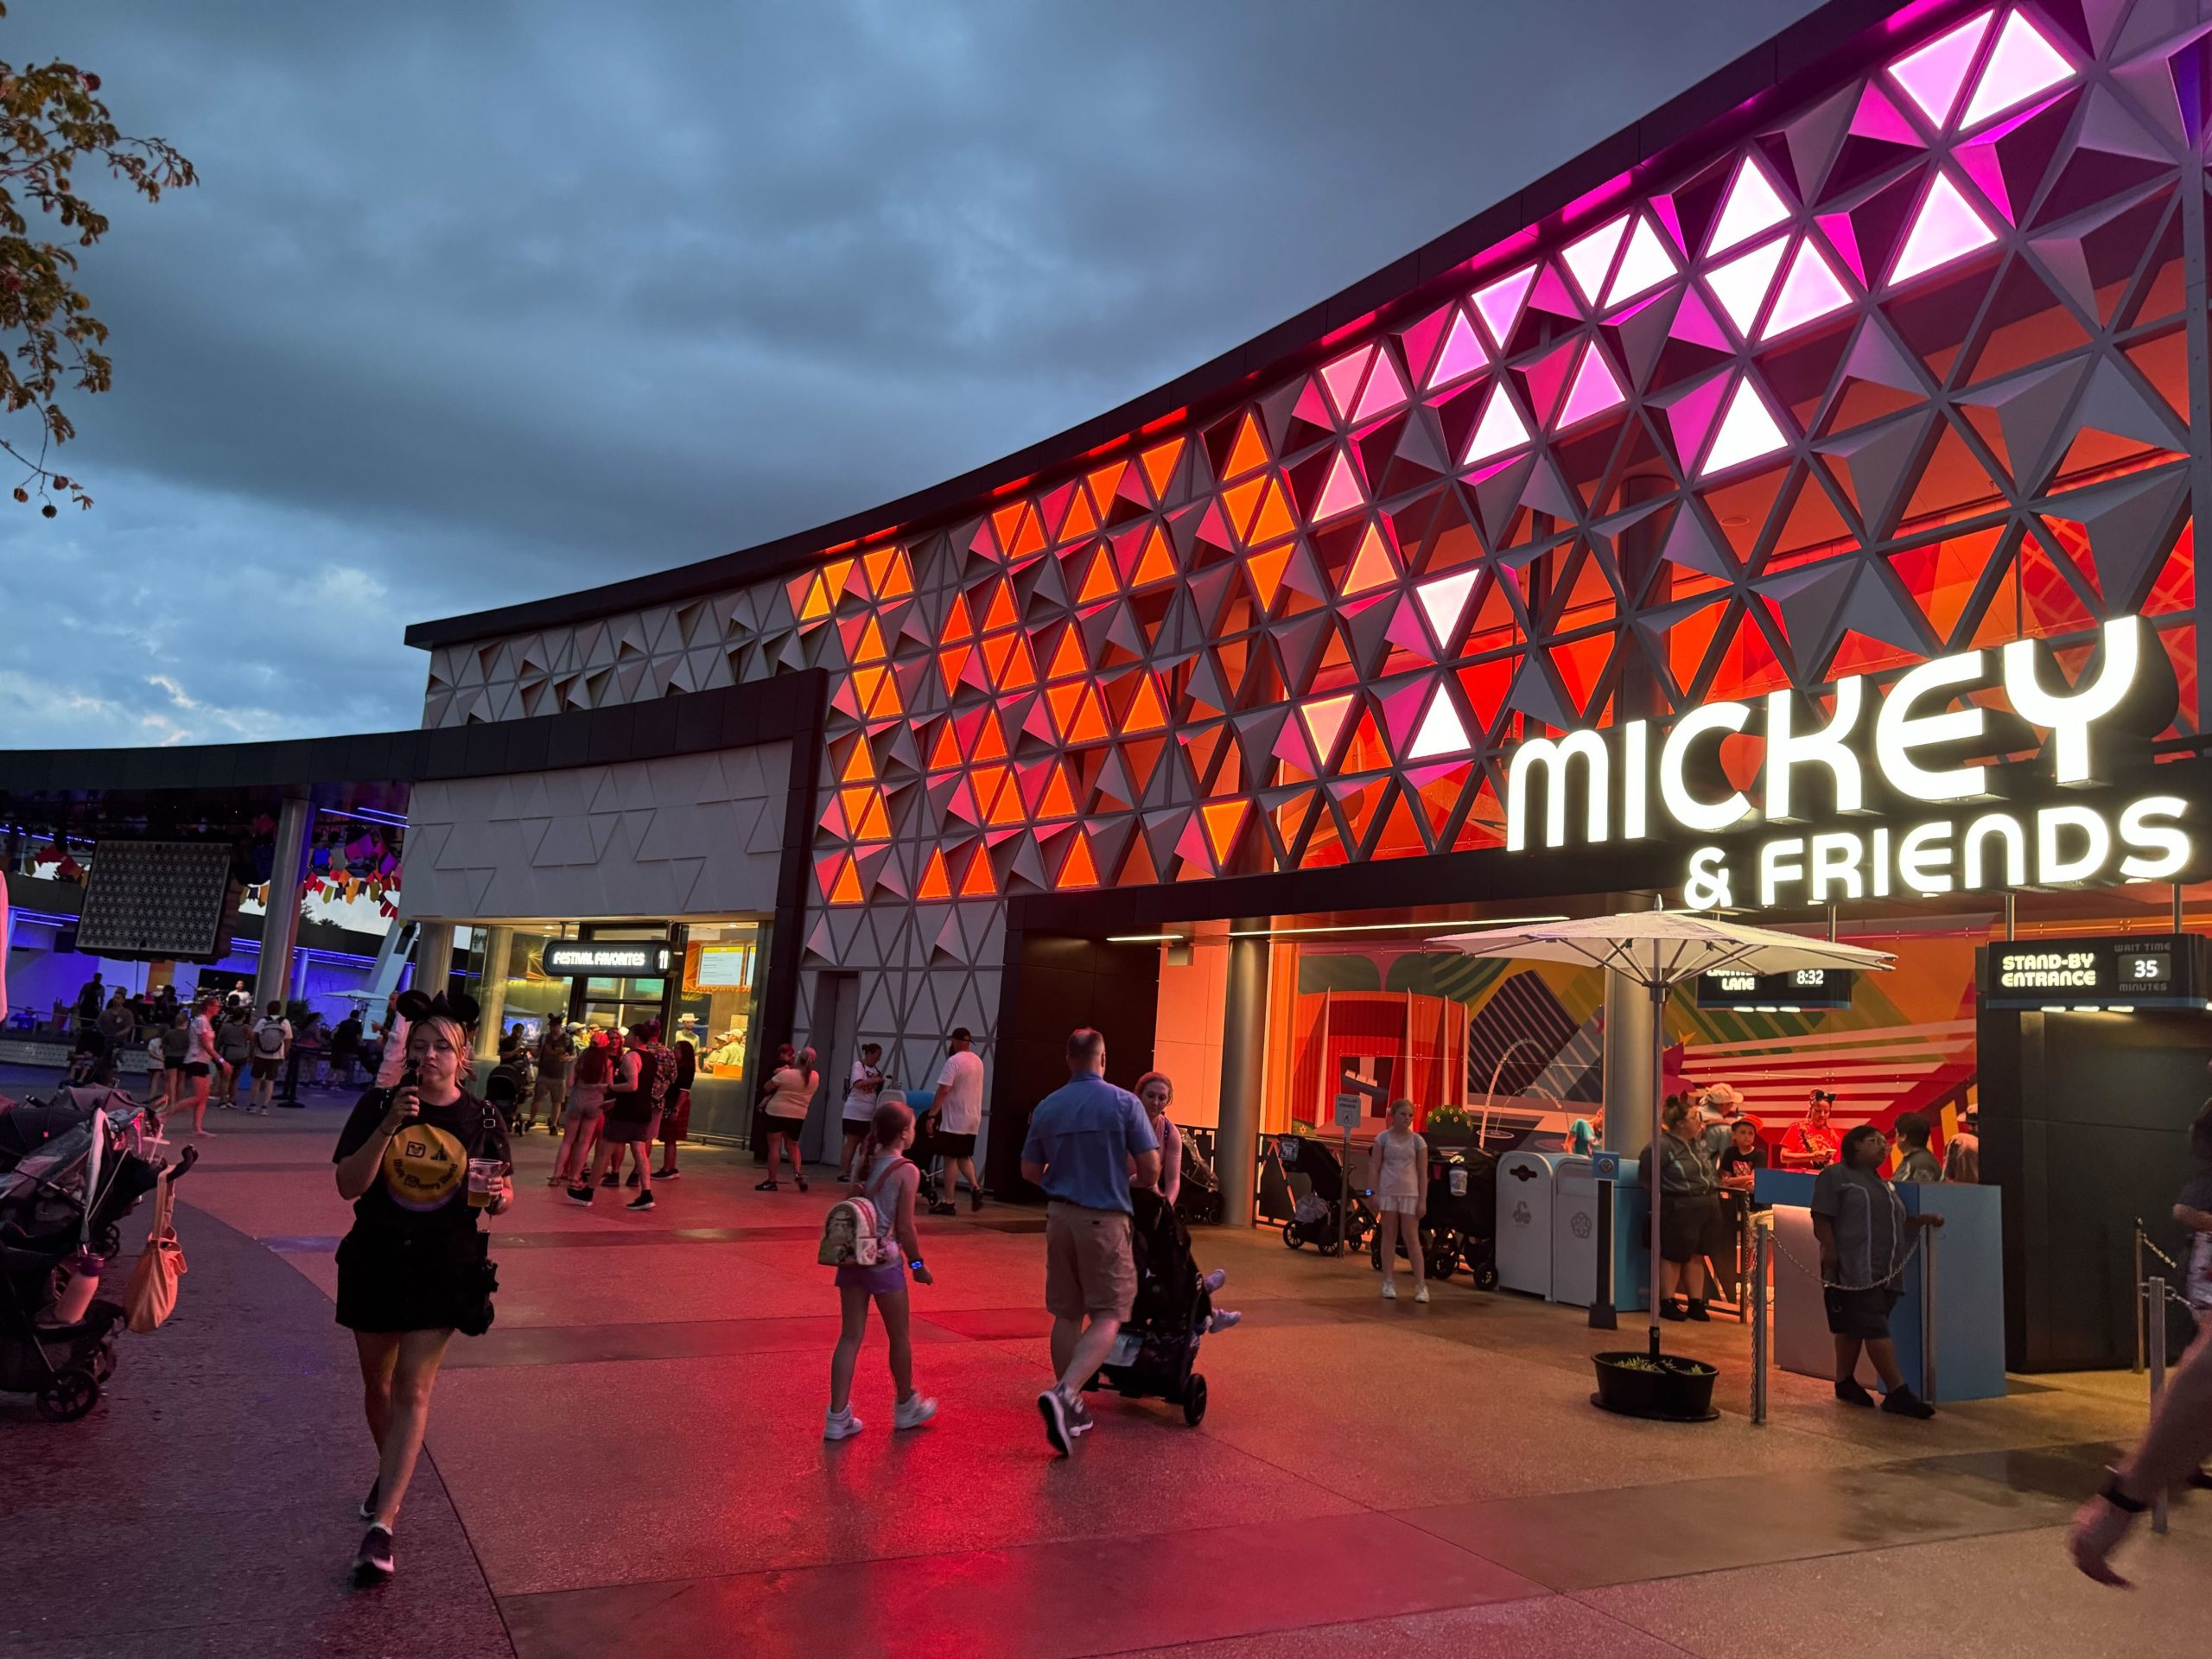
Mickey & Friends
Anyway, here are EPCOT’s average wait times last week:
- Remy’s Ratatouille Adventure – 58 minutes, up 4
- Frozen Ever After – 54 minutes, up 2
- Soarin’ Around the World – 40 minutes, up 2
- Meet Mickey & Friends – 32 minutes, down 2
- Royal Sommerhus – 30 minutes, up 1
- Mission: SPACE – 28 minutes, down 4
- Spaceship Earth – 20 minutes, up 1
- Turtle Talk with Crush – 18 minutes, no change
- Journey into Imagination with Figment – 15 minutes, up 1
- The Seas with Nemo & Friends – 15 minutes, up 3
- Gran Fiesta Tour Starring the Three Caballeros – 14 minutes, up 2
- Living with the Land – 13 minutes, up 1
Overall, EPCOT attractions averaged a wait of 28 minutes, which is one minute more than last time.
As you can tell, any conclusions we draw thus far are in the eye of the beholder, but I’m pleased with EPCOT’s wait times this past week.
Magic Kingdom
Here’s another park that should experience understated disruption due to the lack of character greeting pre-bookings.
Popular experiences like Ariel’s Grotto and Pete’s Silly Sideshow are old enough that it may not matter much, though.
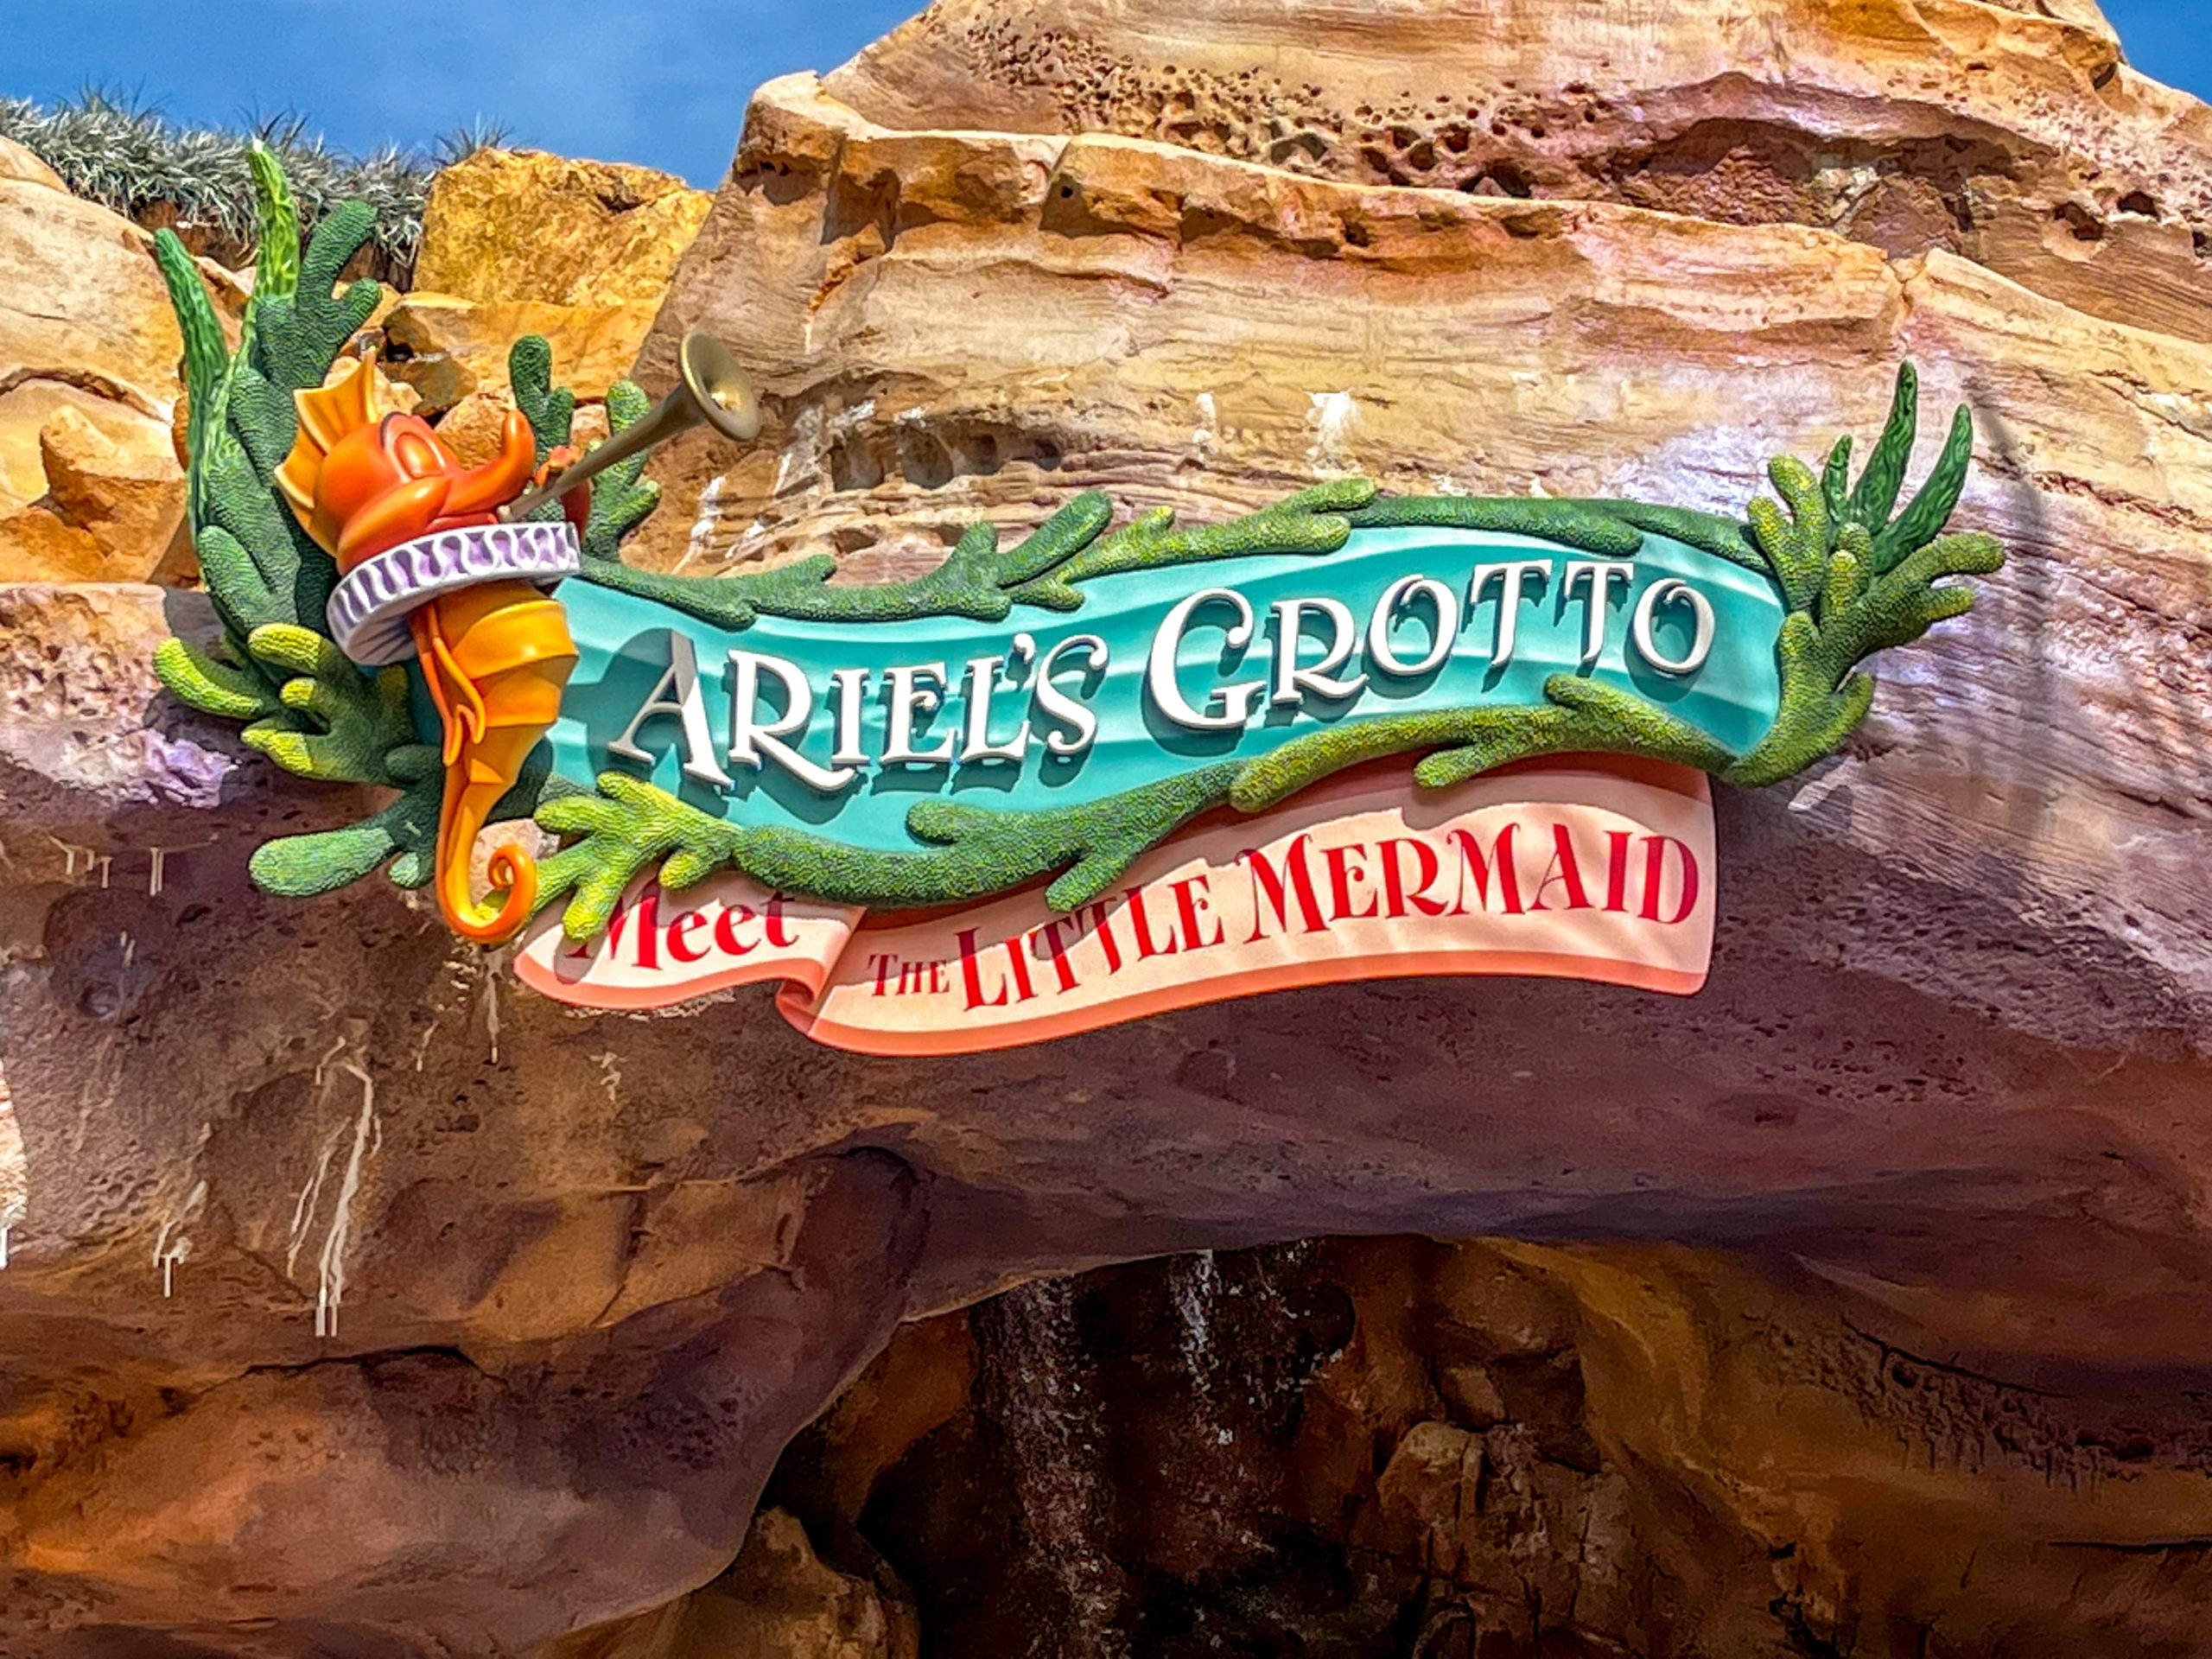
Ariel’s Grotto
While Disney has updated the attractions, they’re still more than a decade old and thereby less likely to be affected.
Here are Magic Kingdom’s average wait times last week:
- Seven Dwarfs Mine Train – 70 minutes, up 7
- Space Mountain – 57 minutes, up 3
- Princess Fairytale Hall – 47 minutes, down 4
- Big Thunder Mountain Railroad – 43 minutes, no change
- Jungle Cruise – 43 minutes, no change
- Haunted Mansion – 42 minutes, no change
- Town Square Theater – 39 minutes, down 1
- The Many Adventures of Winnie the Pooh – 38 minutes, up 2
- Ariel’s Grotto – 35 minutes, up 3
- Buzz Lightyear’s Space Ranger Spin – 35 minutes, no change
- Pete’s Silly Sideshow – 34 minutes, up 4
- Astro Orbiter – 33 minutes, up 5
- It’s a Small World – 31 minutes, up 3
- Pirates of the Caribbean – 31 minutes, up 1
- Enchanted Tales with Belle – 26 minutes, down 1
- Under the Sea ~ Journey of the Little Mermaid – 26 minutes, down 1
- Tomorrowland Speedway – 24 minutes, up 6
- The Barnstormer – 23 minutes, up 2
- Mickey’s PhilharMagic – 18 minutes, up 2
- Dumbo the Flying Elephant – 17 minutes, up 2
- The Magic Carpets of Aladdin – 16 minutes, down 2
- Monsters, Inc. Laugh Floor – 16 minutes, down 1
- Tomorrowland Transit Authority PeopleMover – 16 minutes, up 4
- Country Bear Musical Jamboree – 14 minutes, down 4
- Mad Tea Party – 14 minutes, up 2
- Prince Charming Regal Carrousel – 11 minutes, no change
- Walt Disney World Railroad – 11 minutes, no change
- Walt Disney’s Carousel of Progress – 5 minutes, no change
Final Thoughts
At Magic Kingdom, the average attraction wait time was 28 minutes, which was two minutes more than last time.
We obviously cannot draw any conclusions from such a limited amount of data, at least not with confidence.
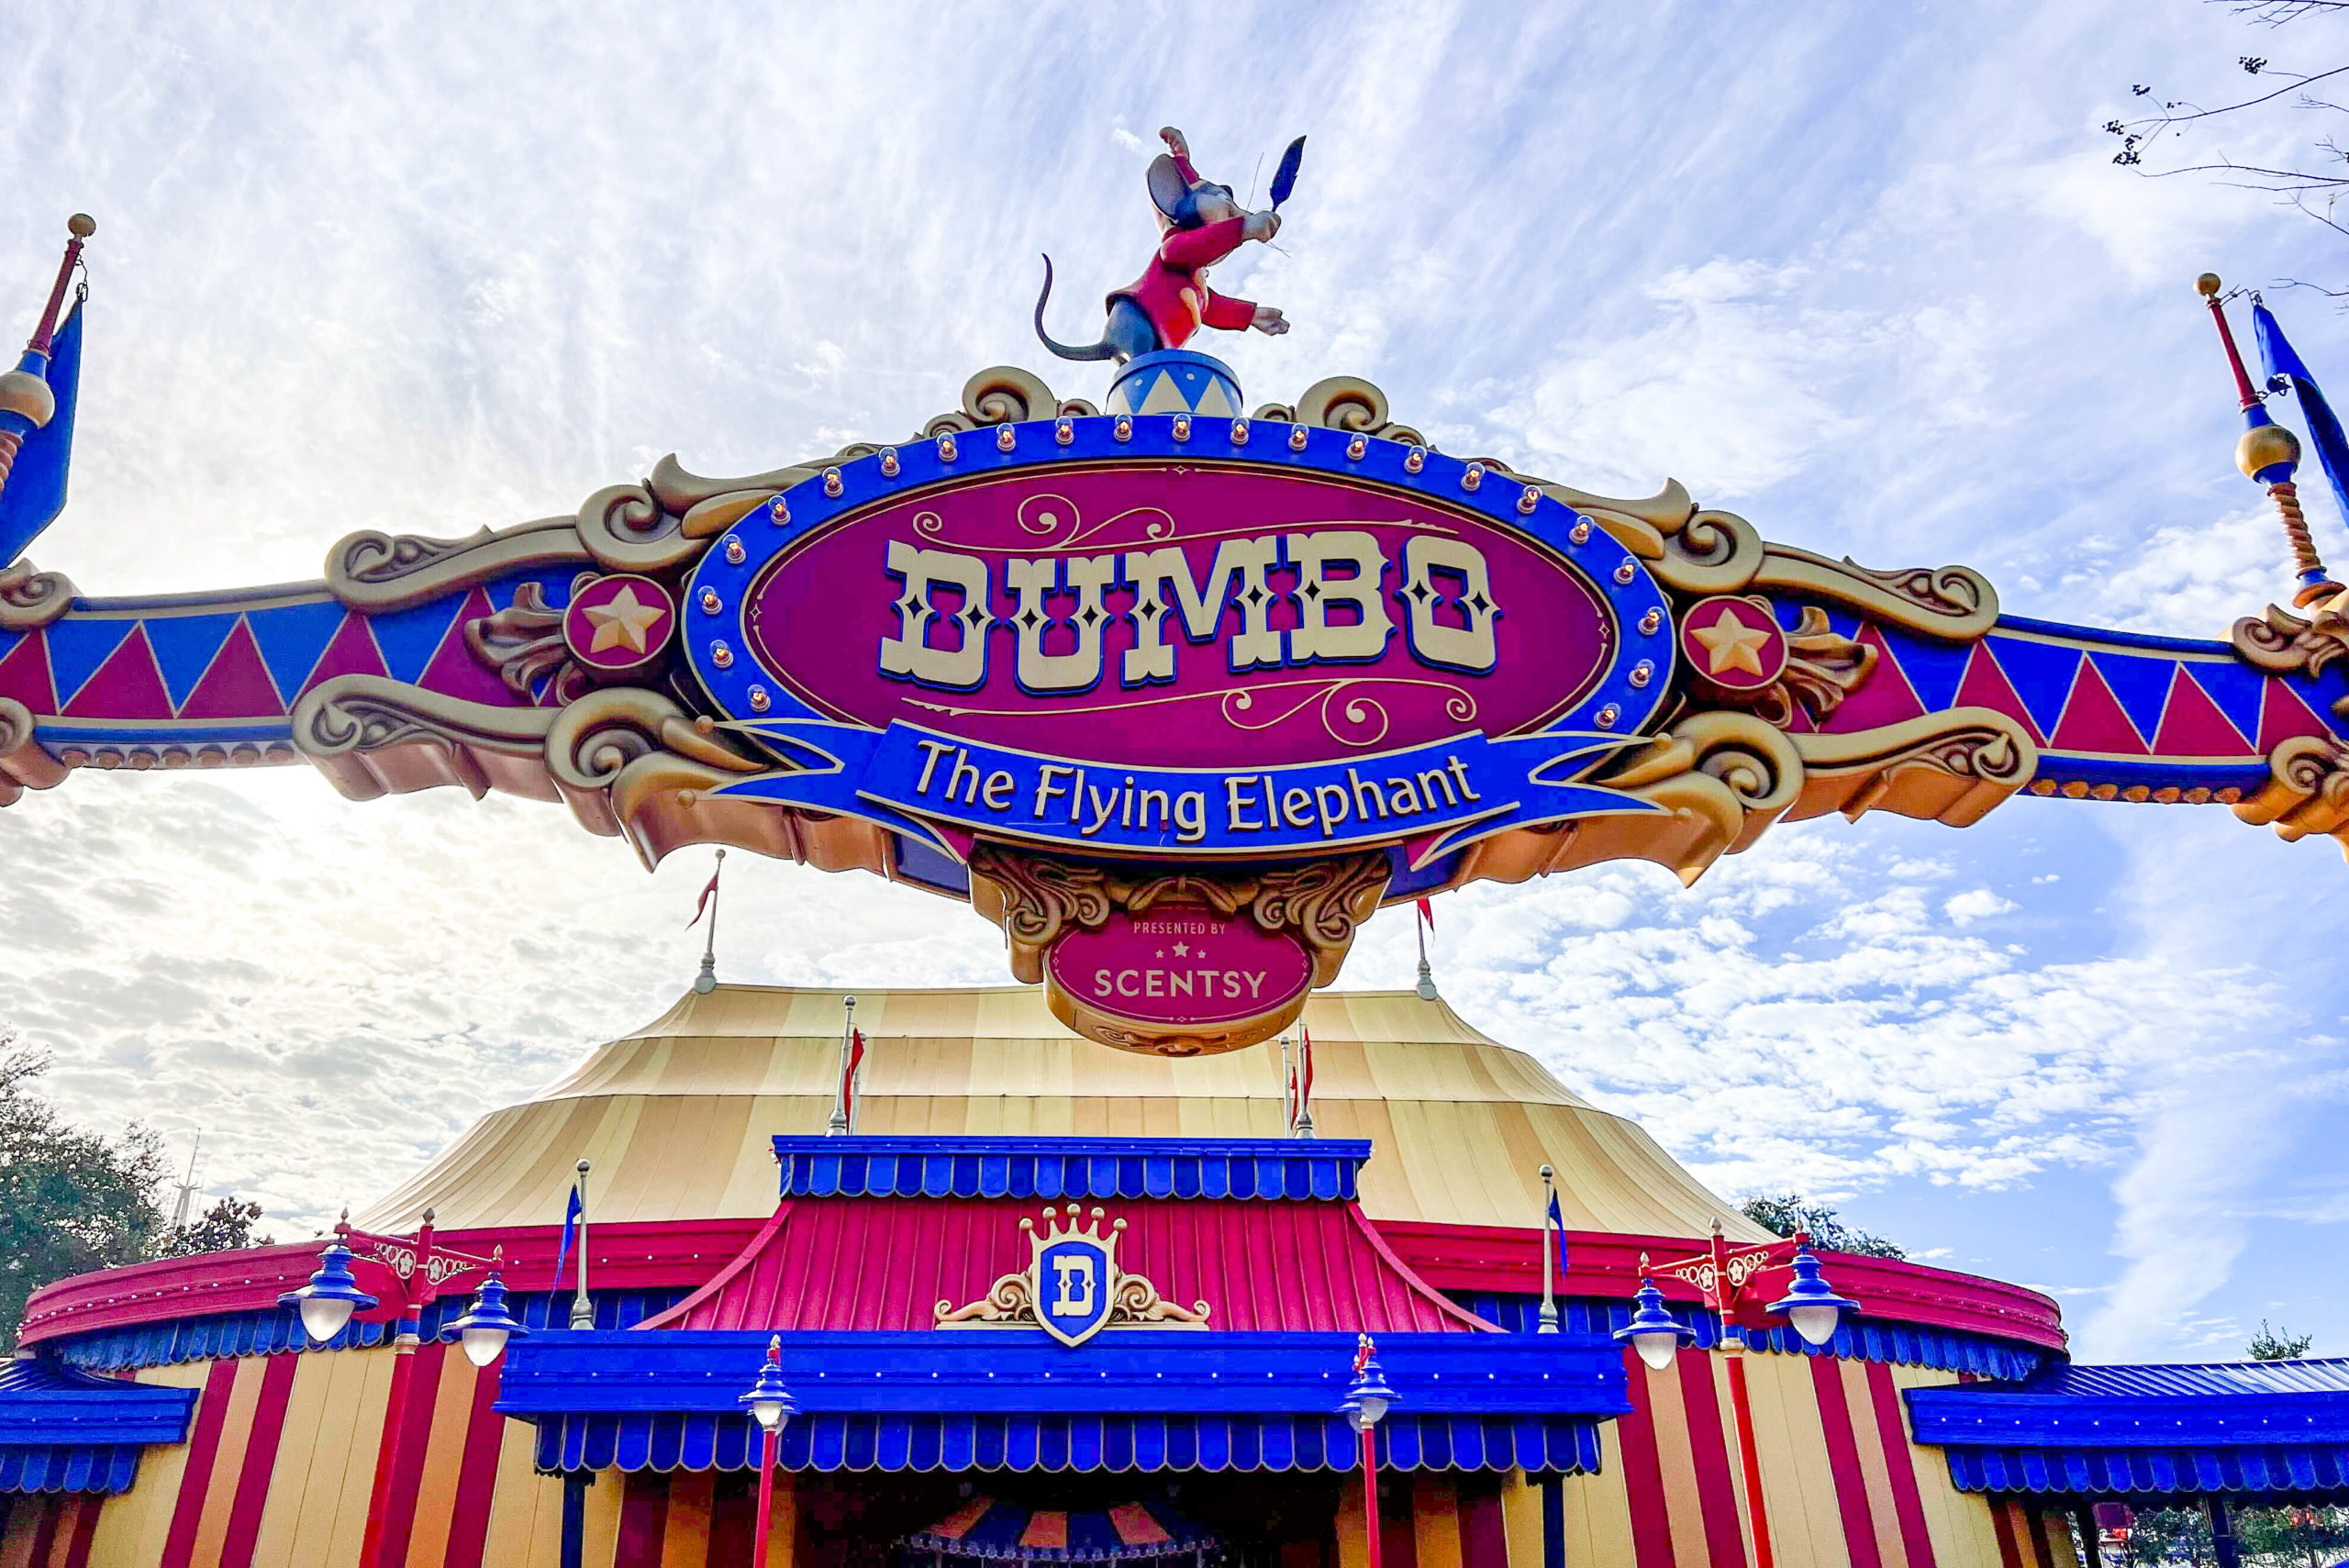
Dumbo
However, I do think it’s interesting that the various character interactions almost all increased their average waits.
Also, many of Walt Disney World’s most popular rides went up in wait time.
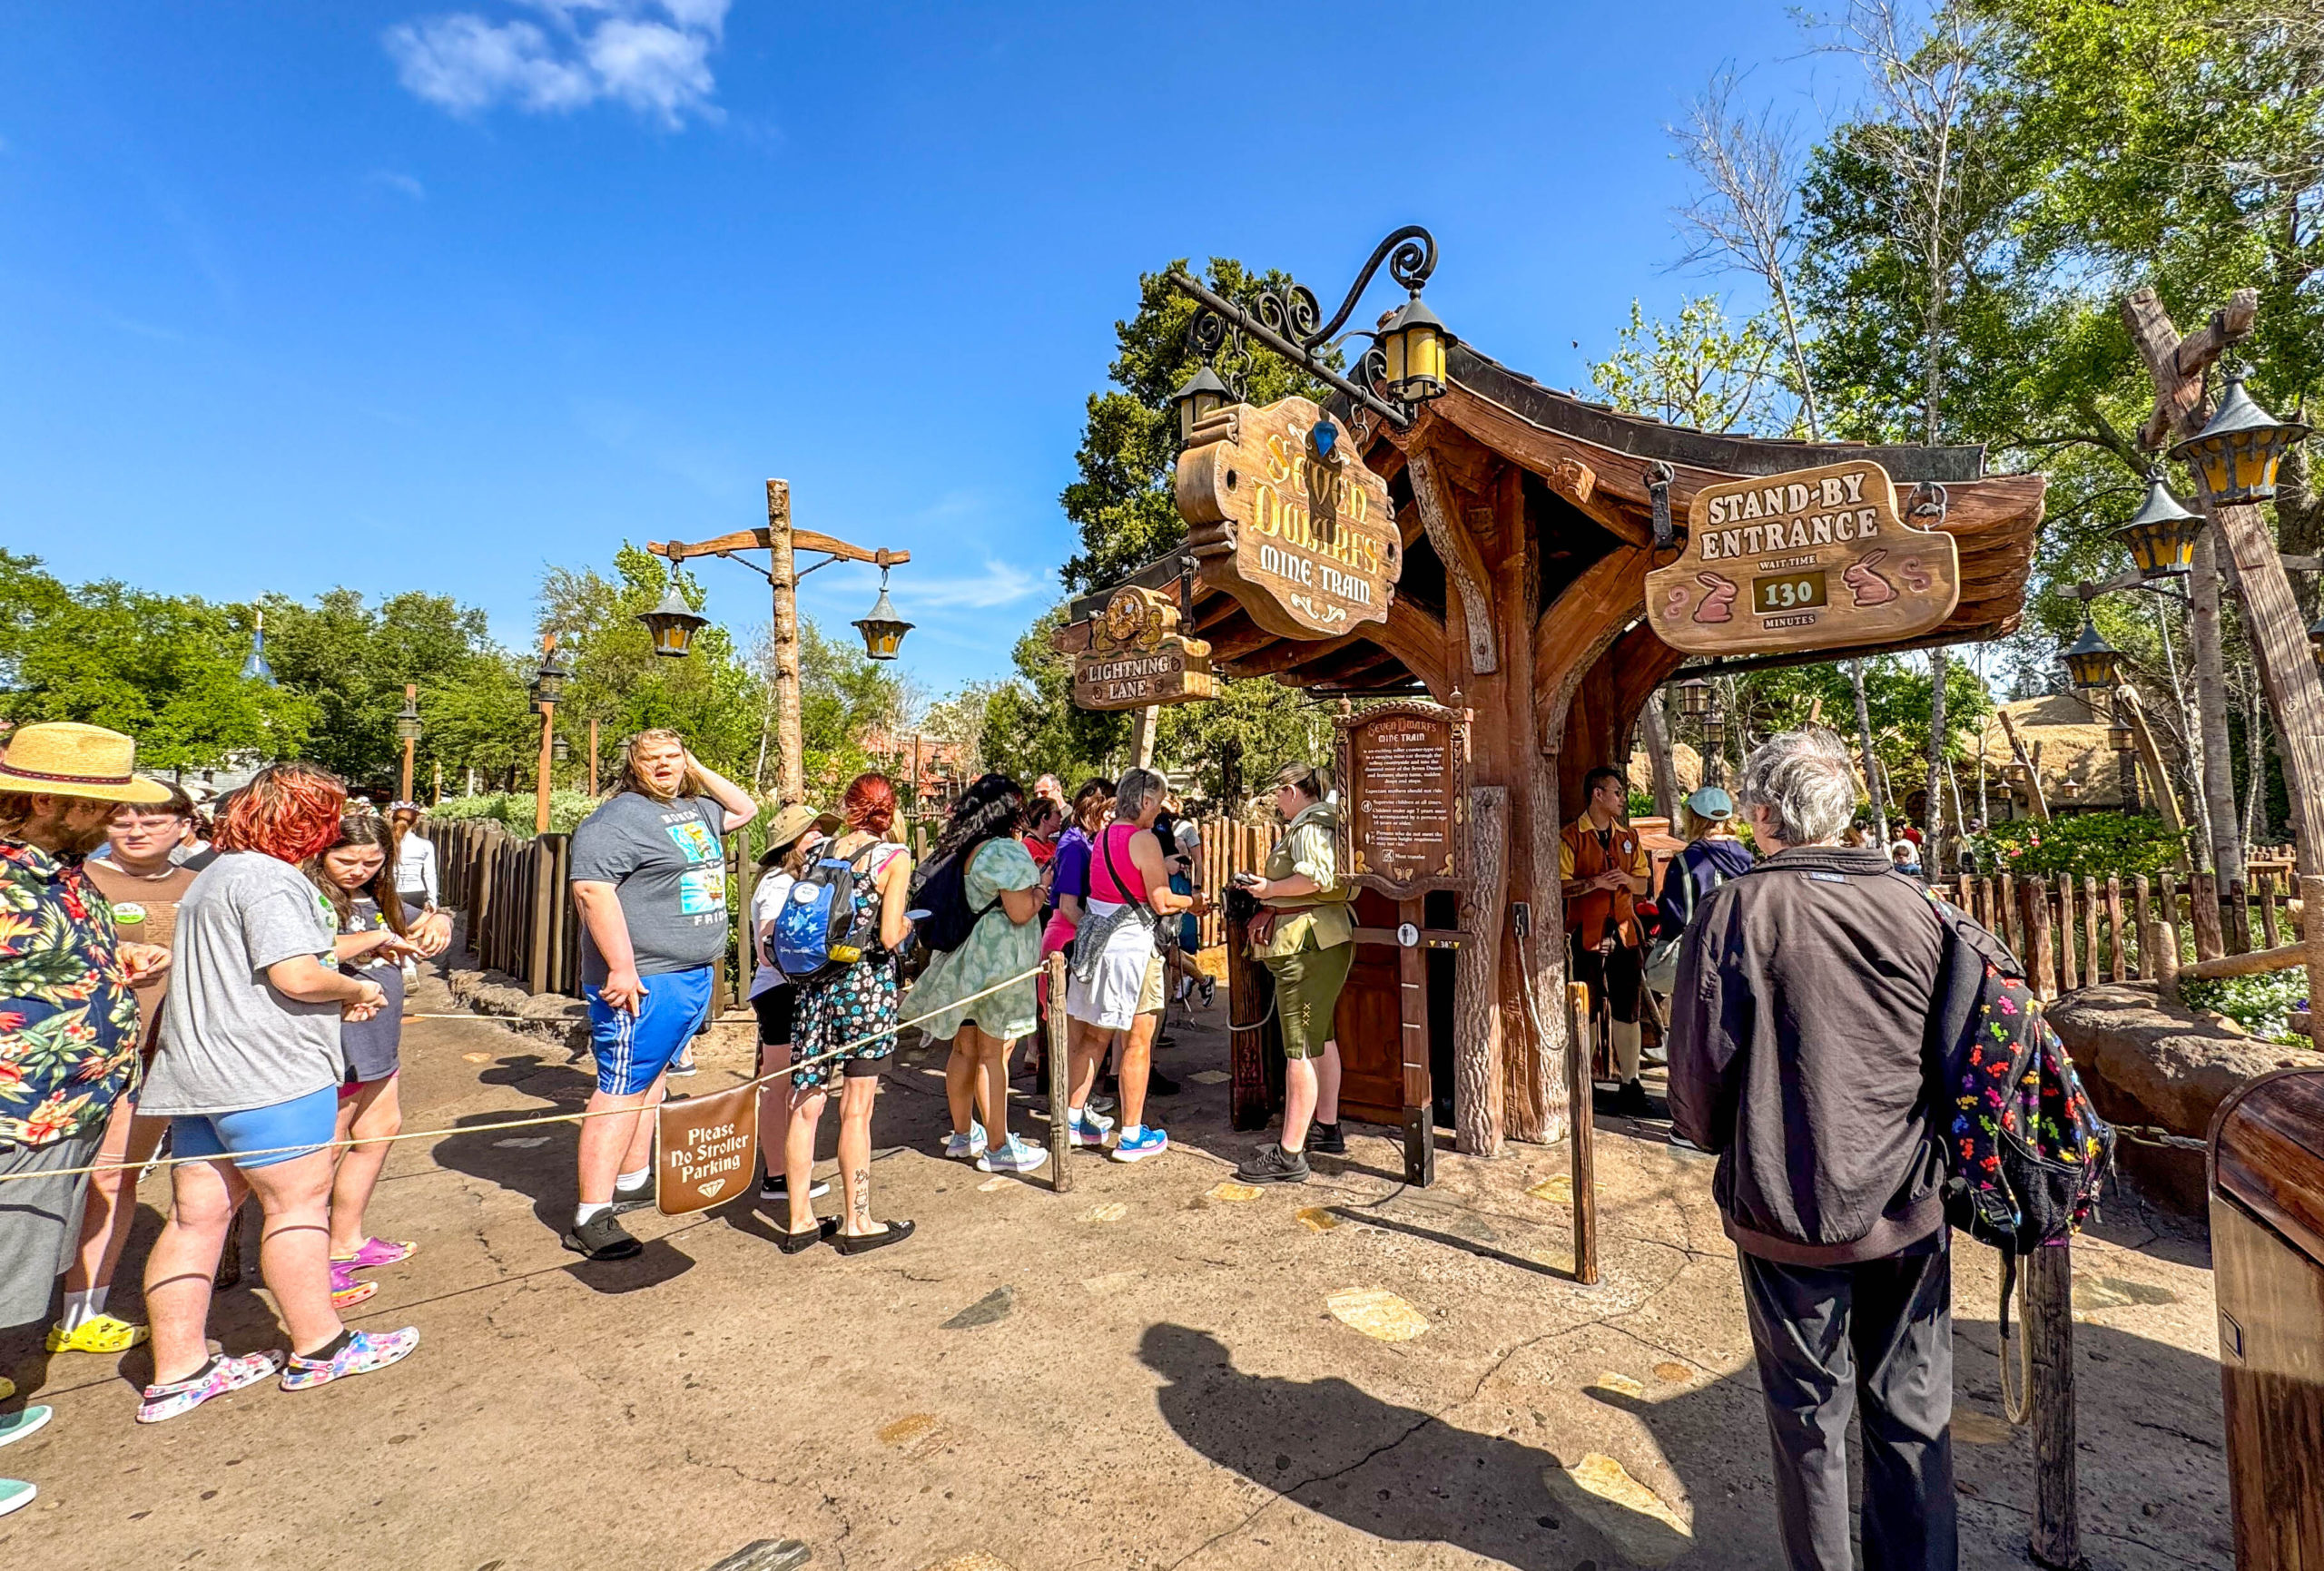
Seven Dwarfs Mine Train
While that could be attributable to standard weekly fluctuation, it could also hint that guests without LLMP waited in line longer.
We’ll pay careful attention to that consideration over the next few weeks.
![]()
Thanks for visiting MickeyBlog.com! Want to go to Disney? For a FREE quote on your next Disney vacation, please fill out the form below, and one of the agents from MickeyTravels, a Diamond Level Authorized Disney Vacation Planner, will be in touch soon!