Walt Disney World Wait Times for Third Week of October 2023
This past week, The Walt Disney Company celebrated its 100th anniversary.
As part of this event, Disney debuted a new attraction and some new character interactions.
Not coincidentally, tourists flocked to the parks. So, I won’t sugarcoat it.
The Walt Disney World wait times for the third week of October 2023 are gonna be longer than we’ve seen in recent weeks.
Disney’s Animal Kingdom
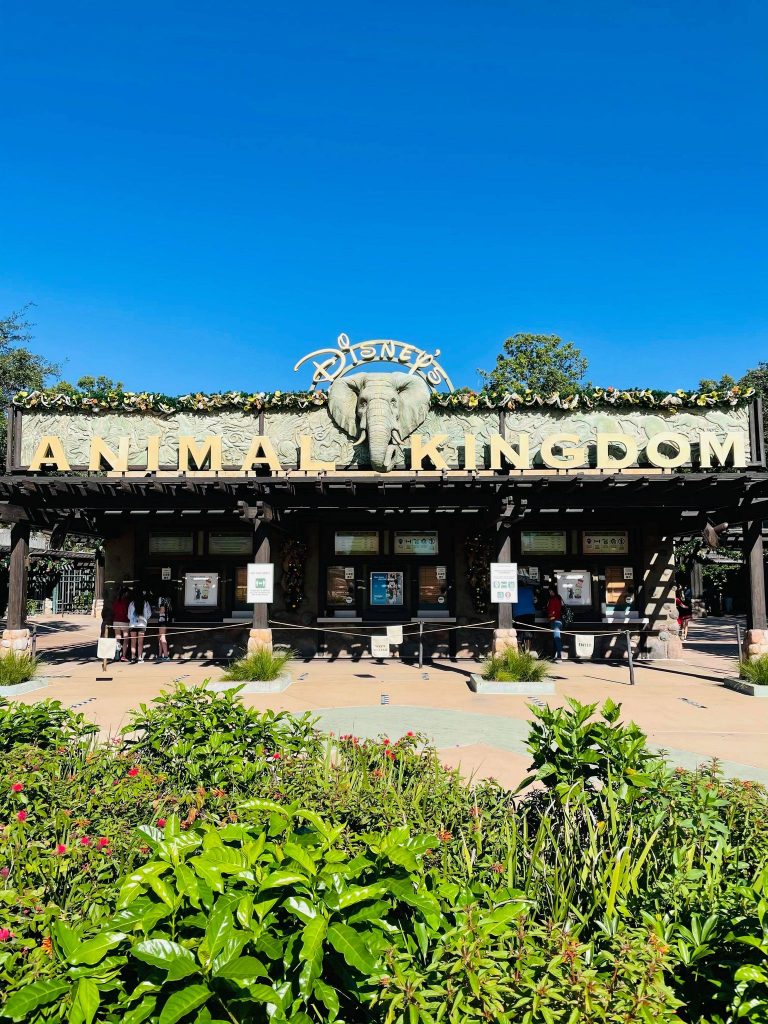
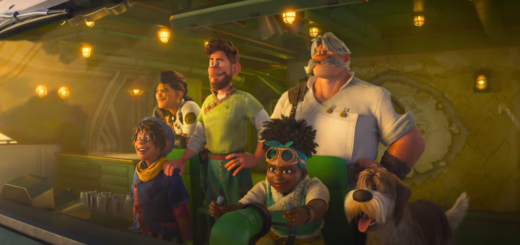
Here’s one of the parks that added new character interactions.
Sometimes, these offerings reduce average wait times because guests divide their time among more attractions.

Photo: Disney
I don’t expect that to be the case for this past week, though. Am I right?
Here are Animal Kingdom’s average wait times for the third week of October:
- Avatar Flight of Passage – 87 minutes, down 4
- Na’vi River Journey – 71 minutes, up 1
- Kilimanjaro Safaris – 51 minutes, up 2
- Adventurers Outpost – 48 minutes, up 2
- Expedition Everest – 35 minutes, up 2
- DINOSAUR – 28 minutes, down 4
- Kali River Rapids – 21 minutes, up 2
- TriceraTop Spin – 14 minutes, up 4
- It’s Tough to Be a Bug! – 10 minutes, no change

Overall, guests waited for an average of 41 minutes per attraction, which is only one minute more than last time. Color me surprised.
Disney’s Hollywood Studios
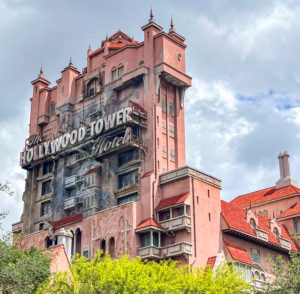
Will that trend continue with Disney’s Hollywood Studios?
Based on what I’ve heard and seen from last week, I really doubt it.

Photo: Matt Stroshane
Here are the park’s average wait times for the third week of October 2023:
- Slinky Dog Dash – 115 minutes, down 2
- Star Wars: Rise of the Resistance – 95 minutes, up 1
- Rock ‘n’ Roller Coaster Starring Aerosmith – 86 minutes, down 4
- Toy Story Mania! – 80 minutes, up 1
- Millennium Falcon: Smugglers Run – 72 minutes, down 2
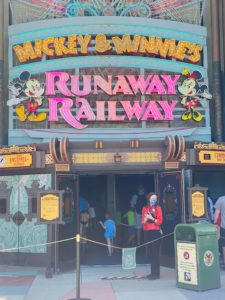
- Mickey & Minnie’s Runaway Railway – 69 minutes, up 1
- Twilight Zone Tower of Terror – 67 minutes, down 2
- Red Carpet Dreams – 44 minutes, up 3
- Alien Swirling Saucers – 42 minutes, no change
- Celebrity Spotlight – 24 minutes, up 2
- Star Tours – The Adventures Continue – 21 minutes, no change
- Lightning McQueen’s Racing Academy – 16 minutes, up 1
- Muppet*Vision 3D – 10 minutes, no change
And I’m wrong. Overall, guests stood in line for an average of 51 minutes per attraction.
Yes, that’s a lot, but it’s only one minute more than last time. So, we’re scratching the upper boundaries of Hollywood Studios wait times.
As the holidays approach, we’ll somehow find a way to surpass even those, but seven attractions with waits of at least 67 minutes is about as bad as this park can get.
EPCOT
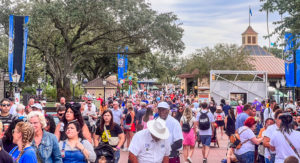
Thus far, the pattern appears to be large crowds, but they’re quite similar to last week.
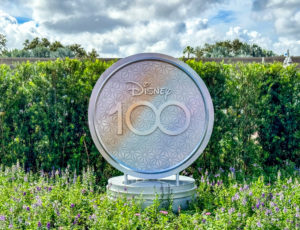
The one park that could deviate from that pattern is EPCOT, the hub for Disney100. Did it?

Credit: Disney
Here are EPCOT’s average wait times last week:
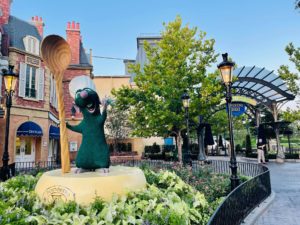
- Remy’s Ratatouille Adventure – 88 minutes, up 7
- Frozen Ever After – 82 minutes, up 5
- Test Track – 71 minutes, up 4
- Soarin’ Over California – 62 minutes, no change
- Royal Sommerhus – 37 minutes, no change
- Spaceship Earth – 25 minutes, up 4
- Mission: SPACE – 23 minutes, up 3
- The Seas with Nemo & Friends – 23 minutes, up 4
- Journey into Imagination with Figment – 21 minutes, no change
- Turtle Talk with Crush – 21 minutes, up 5
- Living with the Land – 16 minutes, up 2
- Gran Fiesta Tour Starring the Three Caballeros – 15 minutes, up 5
So, there you have it. Here’s where the crowds increased last week.
Overall, guests at EPCOT stood in line for an average of 43 minutes, which is four minutes more than last time.
Magic Kingdom
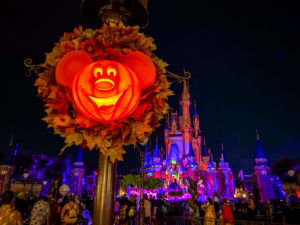
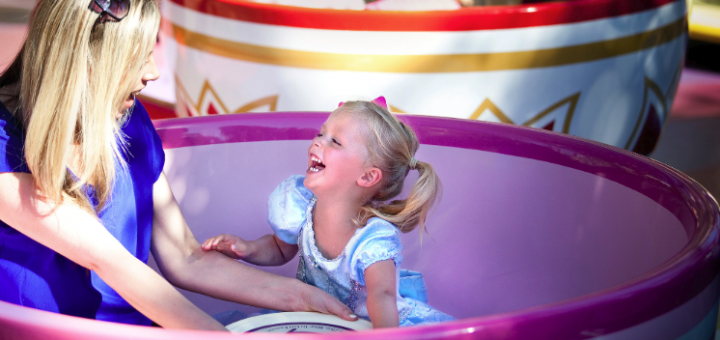
Mickey’s Not-So-Scary Halloween Party
With Mickey’s Not-So-Scary Halloween Party selling out, Magic Kingdom has remained crowded all month.
Here are the average wait times for the most recent week:
- Seven Dwarfs Mine Train – 85 minutes, no change
- Peter Pan’s Flight – 76 minutes, up 1
- Space Mountain – 59 minutes, up 2
- Jungle Cruise – 58 minutes, up 4
- Haunted Mansion – 54 minutes, up 2
- Big Thunder Mountain Railroad – 47 minutes, up 1
- Princess Fairytale Hall – 46 minutes, down 2
- Buzz Lightyear’s Space Ranger Spin – 45 minutes, down 2
- Ariel’s Grotto – 43 minutes, no change
- Town Square Theater – 43 minutes, up 2
- Pirates of the Caribbean – 40 minutes, down 2
- The Many Adventures of Winnie the Pooh – 39 minutes, up 1
- Pete’s Silly Sideshow – 37 minutes, up 1
- Enchanted Tales with Belle – 35 minutes, no change
- Astro Orbiter – 34 minutes, up 1
- It’s a Small World – 29 minutes, down 3
- Under the Sea ~ Journey of the Little Mermaid – 28 minutes, down 2
- The Barnstormer – 27 minutes, down 1
- Dumbo the Flying Elephant – 26 minutes, down 1
- The Magic Carpets of Aladdin – 23 minutes, down 2
- Tomorrowland Speedway – 23 minutes, down 1
- Walt Disney World Railroad – 21 minutes, up 2
- Mickey’s PhilharMagic – 19 minutes, down 1
- Country Bear Jamboree – 18 minutes, no change
- Mad Tea Party – 18 minutes, up 1
- Tomorrowland Transit Authority PeopleMover – 18 minutes, no change
- Monsters, Inc. Laugh Floor – 17 minutes, down 2
- Prince Charming Regal Carrousel – 16 minutes, no change
- Walt Disney’s Carousel of Progress – 5 minutes, no change
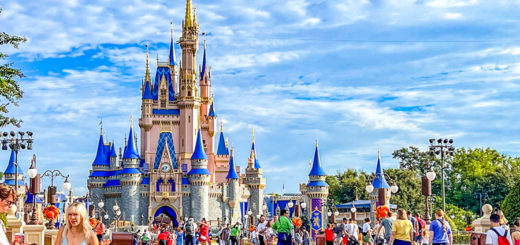
Final Thoughts

Low crowds near Cinderella Castle
Overall, Magic Kingdom guests waited in line for 35 minutes, which is one minute more than last time.
So, the crowds at the parks ticked up slightly for the most part, with the largest indicators at EPCOT, which makes sense.
After all, Disney selected EPCOT as the hub for Disney100. It should have had more crowds during the week Disney turned 100.
With Halloween approaching soon, I doubt the crowds grow much smaller, but the lure of Disney100 may have been temporary.
We’ll find out for sure in next week’s article!
Photo: MickeyBlog
Thanks for visiting MickeyBlog.com! Want to go to Disney? For a FREE quote on your next Disney vacation, please fill out the form below, and one of the agents from MickeyTravels, a Diamond Level Authorized Disney Vacation Planner, will be in touch soon!
Feature Photo: Disney