Walt Disney World Wait Times for Second Week of August 2023
Let’s start with a simple question. Is school back in session where you live?
The answer varies across North America. Locally, my answer is yes.

Photo: Disney
Our school reopened on Wednesday for the fall semester. But I’ve spoken with others whose schools won’t return until late in August.
Why is all this important? When kids aren’t in school, more families travel to the theme parks. So, we’re tracking an expected slowdown.

Photo: Pexel.com
Of course, tourism has grown unpredictable since the pandemic. Expected norms don’t always apply.
I guess what I’m saying is that anything can happen in the latest batch of Walt Disney World wait times.
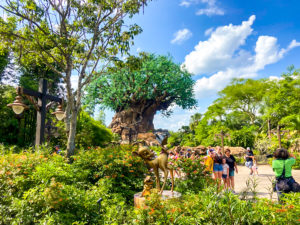
Disney’s Animal Kingdom
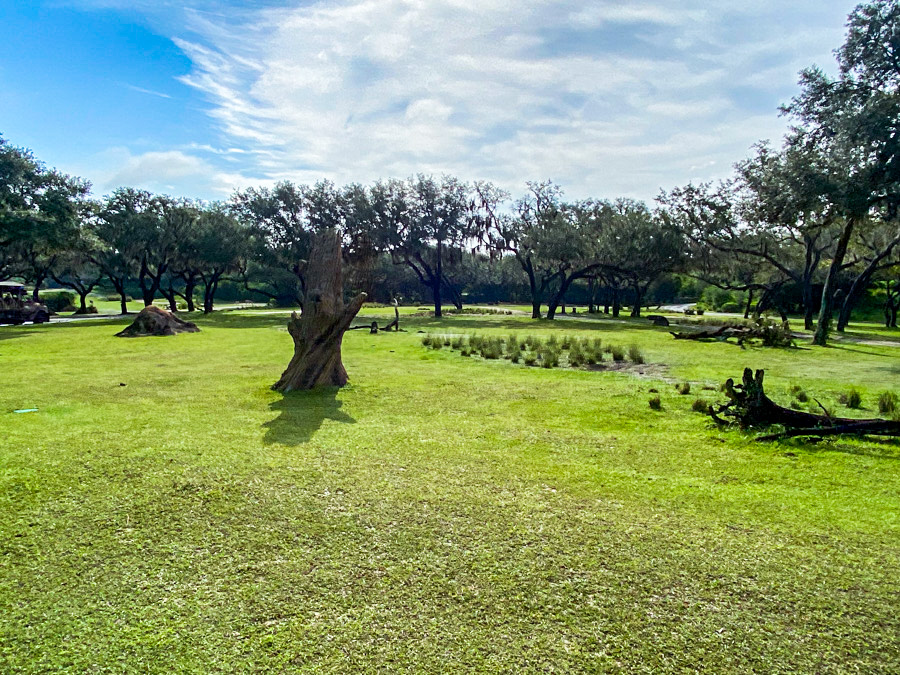
Disney recently revealed a few insights about the parks.
As one of the acknowledgments, the company revealed a modest slowdown at Walt Disney World.
Animal Kingdom
Attendance softened slightly during the timeframe from April through June, which we’d tracked in our wait times articles as well.
While Disney expects steady park traffic for the foreseeable future, the wild wait times of 2022 appear to be a thing of the past.

So, Disney itself has predicted steady attendance levels for the rest of the year.
How does that look in terms of wait times? Let’s check, starting with the average waits at Animal Kingdom:
- Avatar Flight of Passage – 89 minutes, down 3
- Na’vi River Journey – 74 minutes, down 9
- Kali River Rapids – 48 minutes, down 1
- Adventurers Outpost – 45 minutes, up 2
- Expedition Everest – 37 minutes, no change
- DINOSAUR – 29 minutes, down 4
- Kilimanjaro Safaris – 24 minutes, down 7
- It’s Tough to Be a Bug! – 10 minutes, no change
- TriceraTop Spin – 8 minutes, down 2
Photo: Disney
Overall, the trend at Animal Kingdom was slightly smaller crowds, which aligns with the thought that at least some schools are back in session.
Guests stood in line for an average of 39 minutes per attraction, which is two minutes less than last time.
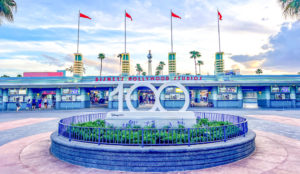
Disney’s Hollywood Studios
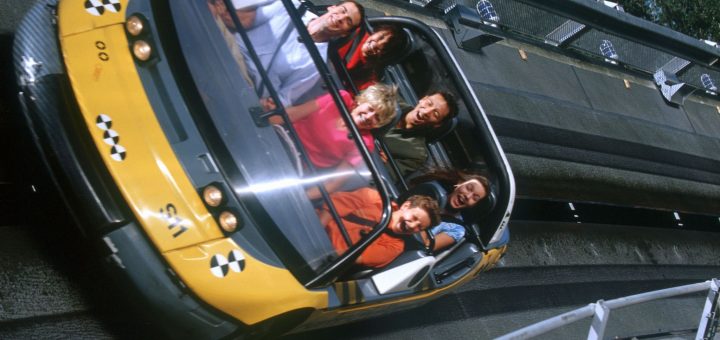
The trend will accelerate at Hollywood Studios, where crowds simply weren’t as significant last week.
We know this because Slinky Dog Dash, the attraction most severely impacted by throughput limitations, witnessed a drop.
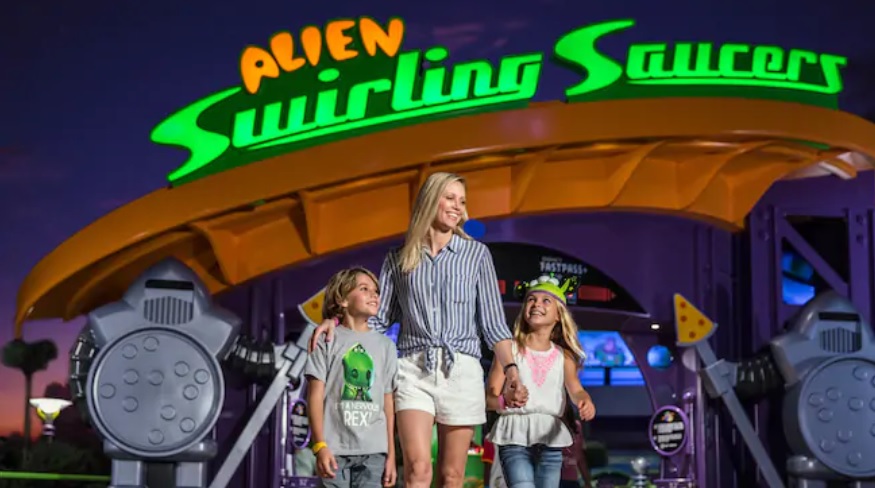
Photo: Disney
For the past week, guests waited for an average of 97 minutes, which is 22 minutes less than the previous week.
Of course, that’s still a long wait, which means Slinky Dog Dash still has plenty of room to drop as we move toward September, the slow season.
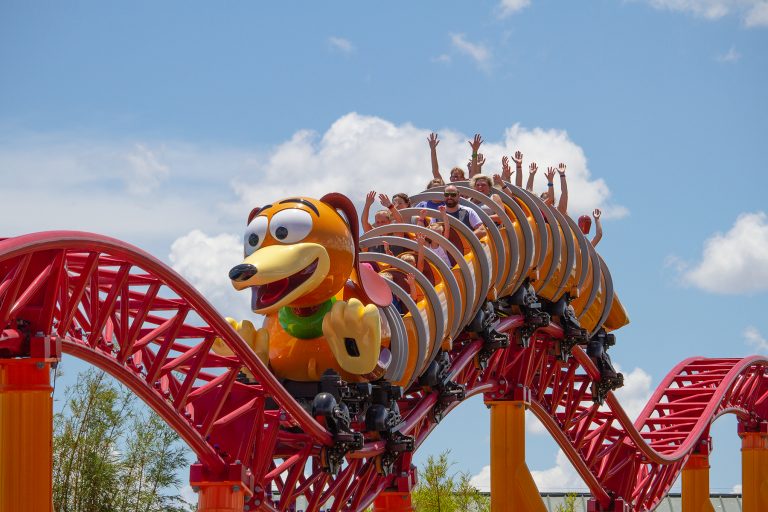
Photo: TheCoasterKings.com
Here are the other average waits at Hollywood Studios:
- Star Wars: Rise of the Resistance – 84 minutes, down 6
- Rock ‘n’ Roller Coaster Starring Aerosmith – 70 minutes, down 4
- Mickey & Minnie’s Runaway Railway – 67 minutes, down 5
- Millennium Falcon: Smugglers Run – 64 minutes, down 10
- Toy Story Mania! – 63 minutes, down 11
- Twilight Zone Tower of Terror – 52 minutes, down 7
- Red Carpet Dreams – 40 minutes, no change
- Alien Swirling Saucers – 33 minutes, down 7
- Celebrity Spotlight – 18 minutes, up 1
- Lightning McQueen’s Racing Academy – 18 minutes, up 3
- Star Tours – The Adventures Continue – 17 minutes, down 2
- Muppet*Vision 3D – 10 minutes, no change
While virtually everything dropped from the previous week, the park remained crowded.
I’ve previously mentioned how I define busy Hollywood Studios days. Any day with six or more attractions that require 60+ minute waits is hectic.
When the total is seven, the park can be a struggle. While we’re at six, we could drop to four as soon as next week.
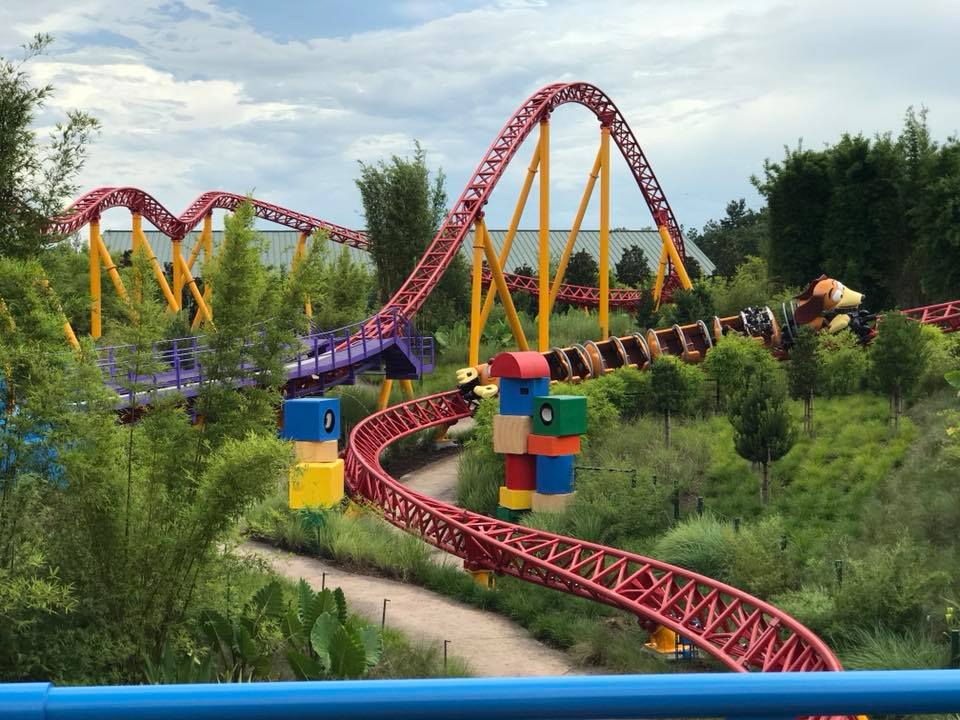
Image Credit: Disney
In other words, wait times are tolerable now and will likely be quite reasonable soon.
Overall, guests waited for an average of 45 minutes per attraction, which is three minutes less than last time.
EPCOT
![]()
I expect some normalization and a slight drop at EPCOT this week.
I say this because the opening rush for the EPCOT International Food & Wine Festival has passed.
Am I right? Here are EPCOT’s average wait times last week:
- Test Track – 81 minutes, up 7
- Frozen Ever After – 73 minutes, down 4
- Remy’s Ratatouille Adventure – 63 minutes, down 9
- Soarin’ Around the World – 44 minutes, down 2
- Royal Sommerhus – 28 minutes, down 1
- Mission: SPACE – 25 minutes, down 5
- Spaceship Earth – 22 minutes, down 3
- Turtle Talk with Crush – 19 minutes, down
- The Seas with Nemo & Friends – 14 minutes, down 2
- Journey into Imagination with Figment – 13 minutes, down 4
- Living with the Land – 13 minutes, no change
- Gran Fiesta Tour Starring the Three Caballeros – 11 minutes, down 3
So, I was mostly correct, as EPCOT attractions averaged a 34-minute wait, which is three minutes less than last time.
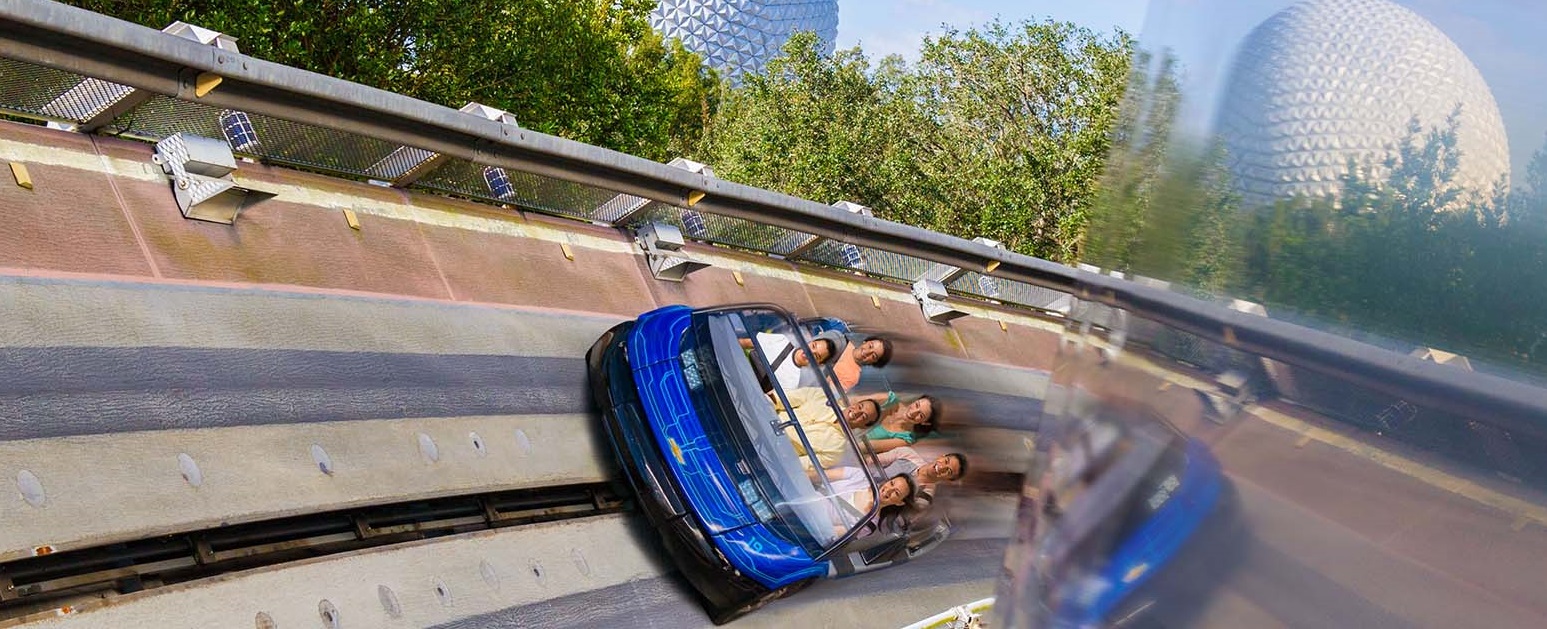
Photo: Disney
We did have the weirdness with Test Track crowds expanding, but everything else at the park dropped.
I’ll be curious to see whether the Disney100 event changes anything in a month.
Magic Kingdom
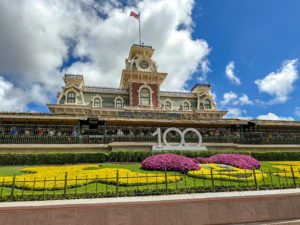
Okay, the trend is readily apparent at this point. Crowds remain large overall, but they’re slightly down from last week.
Did Magic Kingdom follow this pattern? Here are the park’s average wait times:
Credit: Disney
- Seven Dwarfs Mine Train – 84 minutes, down 11
- Peter Pan’s Flight – 78 minutes, down 5
- Space Mountain – 62 minutes, down 4
- Jungle Cruise – 52 minutes, down 3
- Buzz Lightyear’s Space Ranger Spin – 49 minutes, down 6
- Haunted Mansion – 46 minutes, down 9
- Big Thunder Mountain Railroad – 42 minutes, down 4
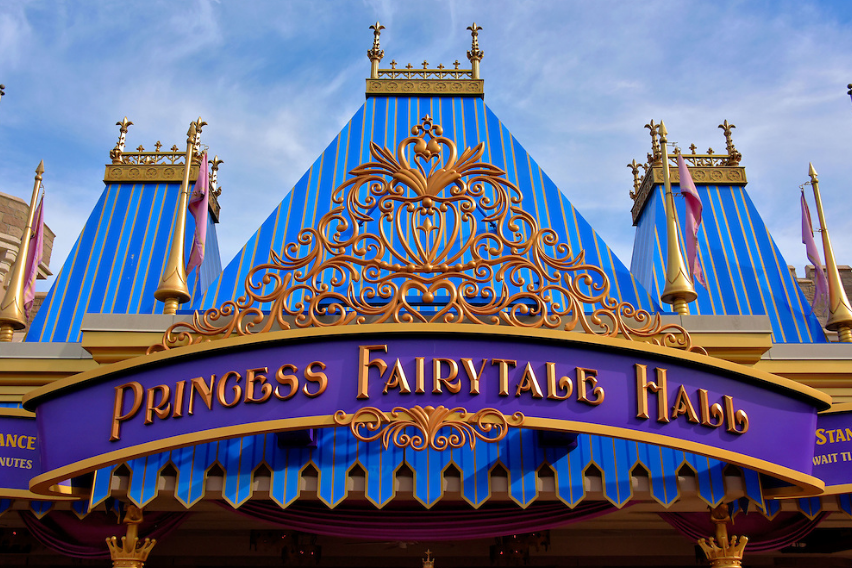
- Princess Fairytale Hall – 42 minutes, down 1
- Town Square Theater – 41 minutes, down 2
- Pirates of the Caribbean – 40 minutes, down 4
- Ariel’s Grotto – 36 minutes, down 4
- The Many Adventures of Winnie the Pooh – 36 minutes, down 4
- Pete’s Silly Sideshow – 35 minutes, up 3
- Astro Orbiter – 32 minutes, down 5
- It’s a Small World – 30 minutes, down 3
- Enchanted Tales with Belle – 29 minutes, down 2
- Tomorrowland Speedway – 26 minutes, up 1
- Under the Sea ~ Journey of the Little Mermaid – 26 minutes, down 3
- The Barnstormer – 21 minutes, down 4
- Monsters, Inc. Laugh Floor – 19 minutes, up 1
- Mickey’s PhilharMagic – 18 minutes, up 2
- Tomorrowland Transit Authority PeopleMover – 16 minutes, down 3
- Dumbo the Flying Elephant – 14 minutes, down 4
- Magic Carpets of Aladdin – 14 minutes, down 5
- Walt Disney World Railroad – 13 minutes, down 2
- Mad Tea Party – 12 minutes, down 2
- Prince Charming Regal Carrousel – 10 minutes, no change
- Country Bear Jamboree – 5 minutes, no change
- Walt Disney’s Carousel of Progress
Final Thoughts
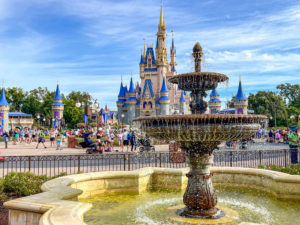
Overall, Magic Kingdom guests waited for an average of 31 minutes per attraction, which is two minutes less than last time.
More importantly, this park is reaching the level where I consider its average waits quite reasonable.
Any week where you’re spending less than 30 minutes waiting for something here, you’re doing well.
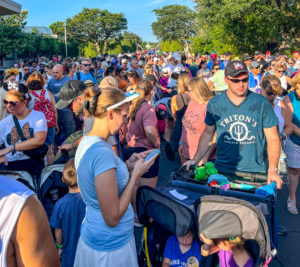
So, we can tell that summer vacation has ended for at least some schools.
Photo: MickeyBlog
Thanks for visiting MickeyBlog.com! Want to go to Disney? For a FREE quote on your next Disney vacation, please fill out the form below, and one of the agents from MickeyTravels, a Diamond Level Authorized Disney Vacation Planner, will be in touch soon!
Feature Photo: Disney