Disneyland Wait Times for August 2022
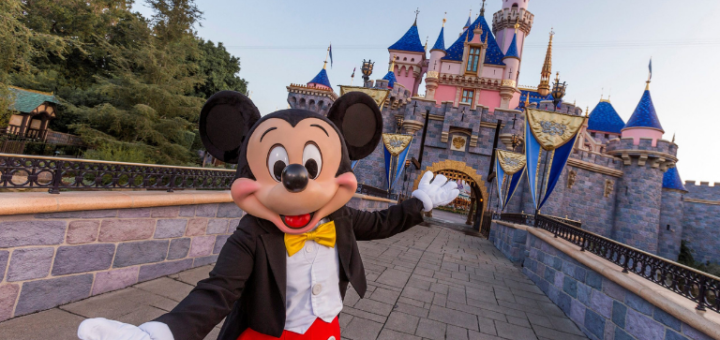
Today, we’ll talk about the past month at Disneyland Resort. Please don’t let the title confuse you, though.
The concept of time prevents me from posting wait times for August. I…don’t know those yet.
So, we’ll discuss the average attraction wait times for last month, July.
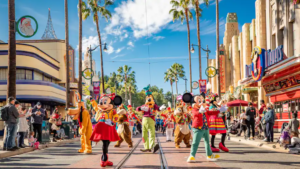
Photo: Disneyland
As a reminder, July is usually the most popular month for tourism, and that’s doubly true at the Happiest Place on Earth.
Only Christmas Week witnesses a similar amount of crowd traffic as the month of July.

Photo: Disney Parks Blog
What I’m trying to do here is soften the blow, as these wait times will likely be the largest ones we track in 2022.
Without further ado, here are the Disneyland Resort wait times for July 2022, i.e., the busy season.

Credit: Disney
Disneyland Resort
I’ve previously discussed the demand for Star Wars: Rise of the Resistance.
This attraction anchors the newest expansion at Disneyland Park and dominates tourist attention.
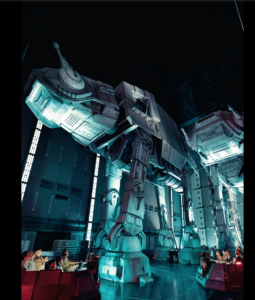
Photo: Disneyland
Despite this fact, Disneyland guests should consider themselves fortunate, as the waits for this version of Rise of the Resistance are shorter than at Disney’s Hollywood Studios.
For example, the Walt Disney World version of the ride averaged a wait of 125 minutes during a recent week.

Photo by Jeff Gritchen, Orange County Register/SCNG
For the month of July, the Disneyland version averaged only 80 minutes. So, you can do another attraction or two during that extra 45 minutes!
Rise of the Resistance also dropped five minutes from its average June wait time, which is interesting. Let’s see whether other attractions follow suit.

Image Credit: Disney
Average Waits at Disneyland Park
Here are the other average waits at Disneyland Park this month:
- Splash Mountain – 74 minutes, up 4
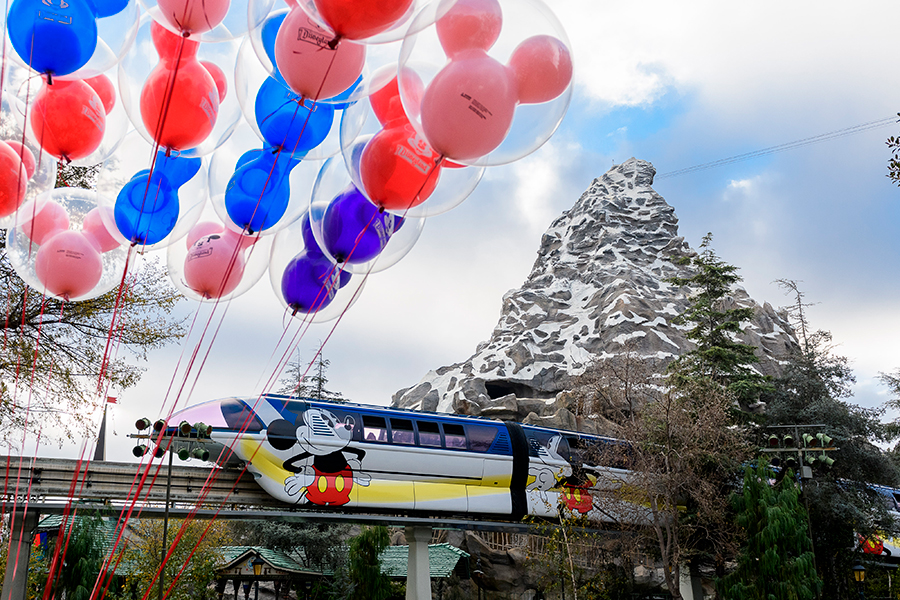
- Space Mountain – 65 minutes, down 7
- Matterhorn Bobsleds – 60 minutes, down 2
- Indiana Jones Adventure – 60 minutes, down 6
- Millennium Falcon: Smugglers Run – 57 minutes, down 8
- Finding Nemo Submarine Village – 51 minutes, n/a
- Big Thunder Mountain Railroad – 45 minutes, down 5
- Buzz Lightyear Astro Blasters – 41 minutes, down 2
- Pirates of the Caribbean – 41 minutes, n/a
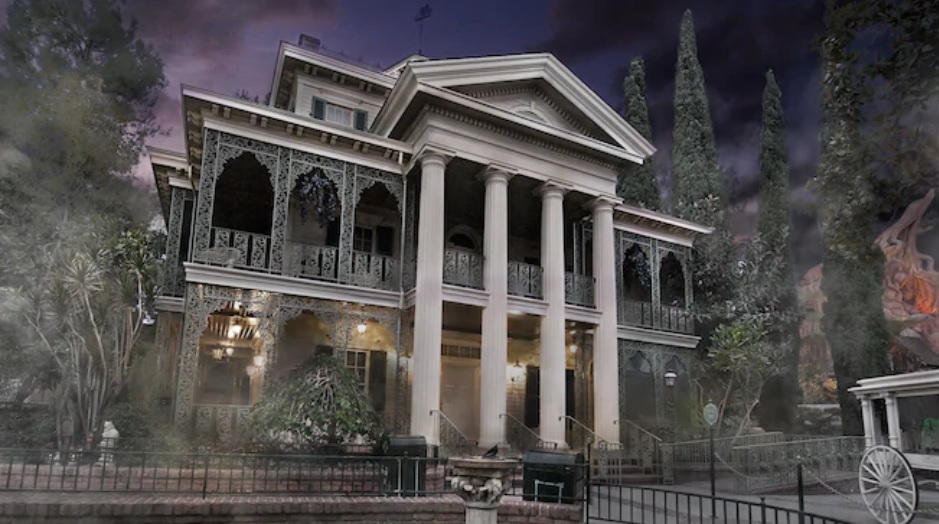
- Haunted Mansion – 40 minutes, down 6
- Star Tours – The Adventures Continue! – 39 minutes, down 6
- Peter Pan’s Flight – 38 minutes, down 4
- Alice in Wonderland – 37 minutes, down 2
- Jungle Cruise – 37 minutes, down 3
- Dumbo the Flying Elephant – 36 minutes, down 2
- Autopia – 35 minutes, no change
- Astro Orbiter – 34 minutes, down 2
- Storybook Land Canal Boats – 30 minutes, down 2
- Toad’s Wild Ride – 25 minutes, down 2
- Snow White’s Enchanted Wish – 24 minutes, down 4
- Disneyland Railroad – 23 minutes, down 3
- Casey Jr. Circus Train – 20 minutes, down 4
- It’s a Small World – 19 minutes, down 7
- Pinocchio’s Daring Journey – 18 minutes, down 5
- Davy Crockett’s Explorer Canoes – 17 minutes, n/a
- The Many Adventures of Winnie the Pooh – 16 minutes, down 4
- Mad Tea Party – 15 minutes, down 4
- King Arthur Carrousel – 14 minutes, down 2
- Disneyland Monorail – 9 minutes, up 1
Overall, Disneyland Park attractions came with a wait of 37 minutes, a drop of two minutes from June.
Disneyland Park Thoughts
I should add a couple of caveats here. First, some attractions we weren’t tracking in June came back in July.
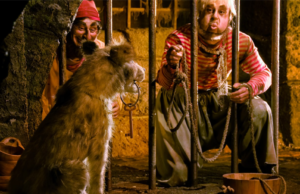
Photo: Disneyland
Two of them are Pirates of the Caribbean and Finding Nemo Submarine Voyage. Notably, they raised the average slightly.
Conversely, Davy Crockett’s Explorer Canoes is one I only recently started tracking. Nevertheless, its modest wait time drops the overall average by more than a minute.
Credit: Disney
Still, this data suggests that crowds were smaller at Disneyland Park in July than in June, a surprising outcome.
We will contrast the data at Disney California Adventure before forming any conclusions, though.
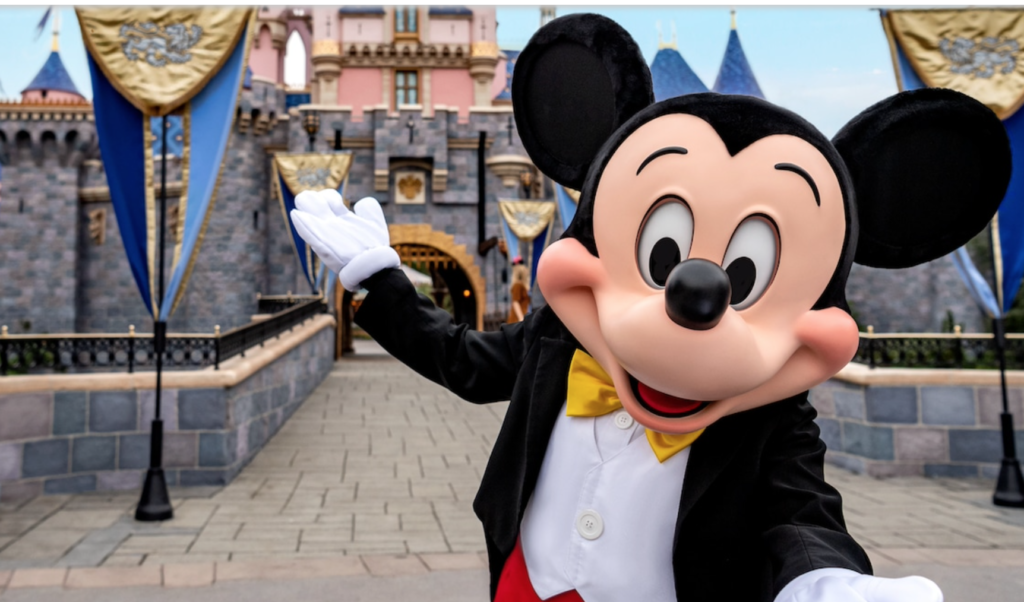
Photo: Disneyland
Disney California Adventure
Over the last few months, the top two attractions at Disney California Adventure have remained the same and likely will do so indefinitely.
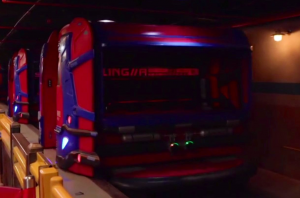
Those rides are the classic, Radiator Springs Racers, and the newest addition, WEBSLINGERS: — A Spider-Man Adventure.
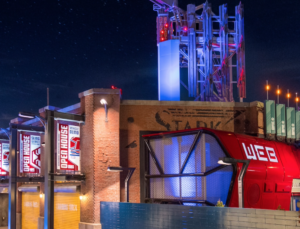
Photo: Disneyland
During July, Radiator Springs Racers averaged a 98-minute wait overall, which is about the same as June. It’s a modest decline of two minutes.
Meanwhile, WEBSLINGERS held steady at 68 minutes, the same as last month.
Source: DLP Report Podcast
We may have found the theoretical roof on Disneyland Resort wait times during the Park Pass era, my friends.
Wait Times at Disney California Adventure
Let’s evaluate the other attraction data to decide for sure:
- Grizzly River Run – 63 minutes, no change
- Toy Story Midway Mania! – 60 minutes, down 4
- Soarin’ Around the World – 57 minutes, no change
- Guardians of the Galaxy – Mission: BREAKOUT! – 55 minutes, down 10
- Goofy’s Sky School – 45 minutes, no change
- Monsters, Inc. Mike & Sulley to the Rescue! – 44 minutes, no change
- The Incredicoaster – 43 minutes, down 1
- Pixar Pal-A-Round – 37 minutes, up 2
- Luigi’s Rollickin’ Roadsters – 28 minutes, no change
- Inside Out Emotional Whirlwind – 23 minutes, no change
- Silly Symphony Swings – 20 minutes, up 1
- Little Mermaid ~ Ariel’s Undersea Adventure – 18 minutes, down 2
- Mater’s Junkyard Jamboree – 17 minutes, down 1
- Jumpin’ Jellyfish – 15 minutes, down 1
- Golden Zephyr – 11 minutes, down 1
- Jessie’s Critter Carousel – 7 minutes, no change
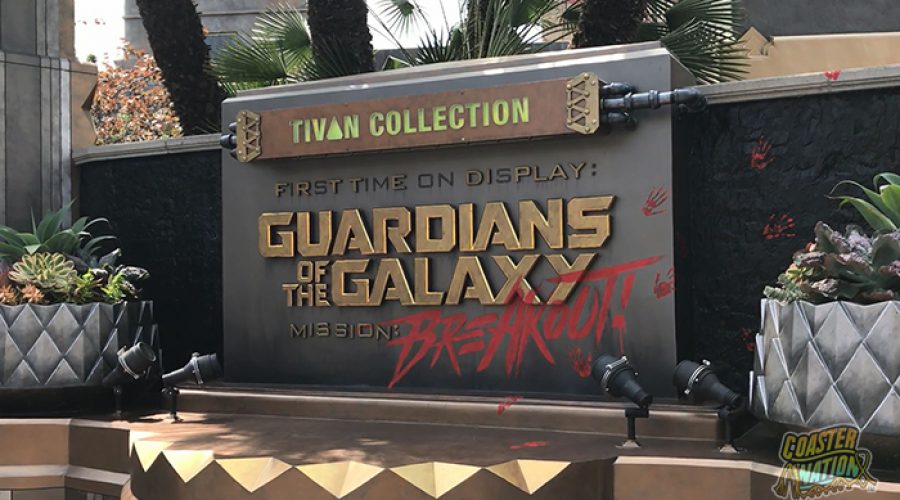
Photo Credit: www.coaster-nation.com
Overall, Disney California Adventure guests waited an average of 39 minutes at the park, the same as during June.
So, yeah. It appears that Disney’s current strategy of fewer guests paying more money is keeping wait times in check.
Thanks for visiting MickeyBlog.com! Want to go to Disney? For a FREE quote on your next Disney vacation, please fill out the form below and one of the agents from MickeyTravels, a Platinum level Authorized Disney Vacation Planner, will be in touch soon!
Feature Image: Disney