Walt Disney World Wait Times for Second Week of August 2021
Okay, everything improved at the parks the last time we talked. We’re still in the heart of the summer, though.
Until most kids are back in school – some already are – lines are unlikely to decrease dramatically.
However, we are hoping for some gradual improvement this week. Did we get it?
Let’s look at the Walt Disney World wait times for the second week of August of 2021.
Disney’s Animal Kingdom
As always, we can tell a lot just from the first ride. So, how long were the lines at Avatar Flight of Passage last week?
Suffice to say that the lines were shorter than in a long time. For example, to fly through Pandora on a Banshee, guests waited an average of 75 minutes.
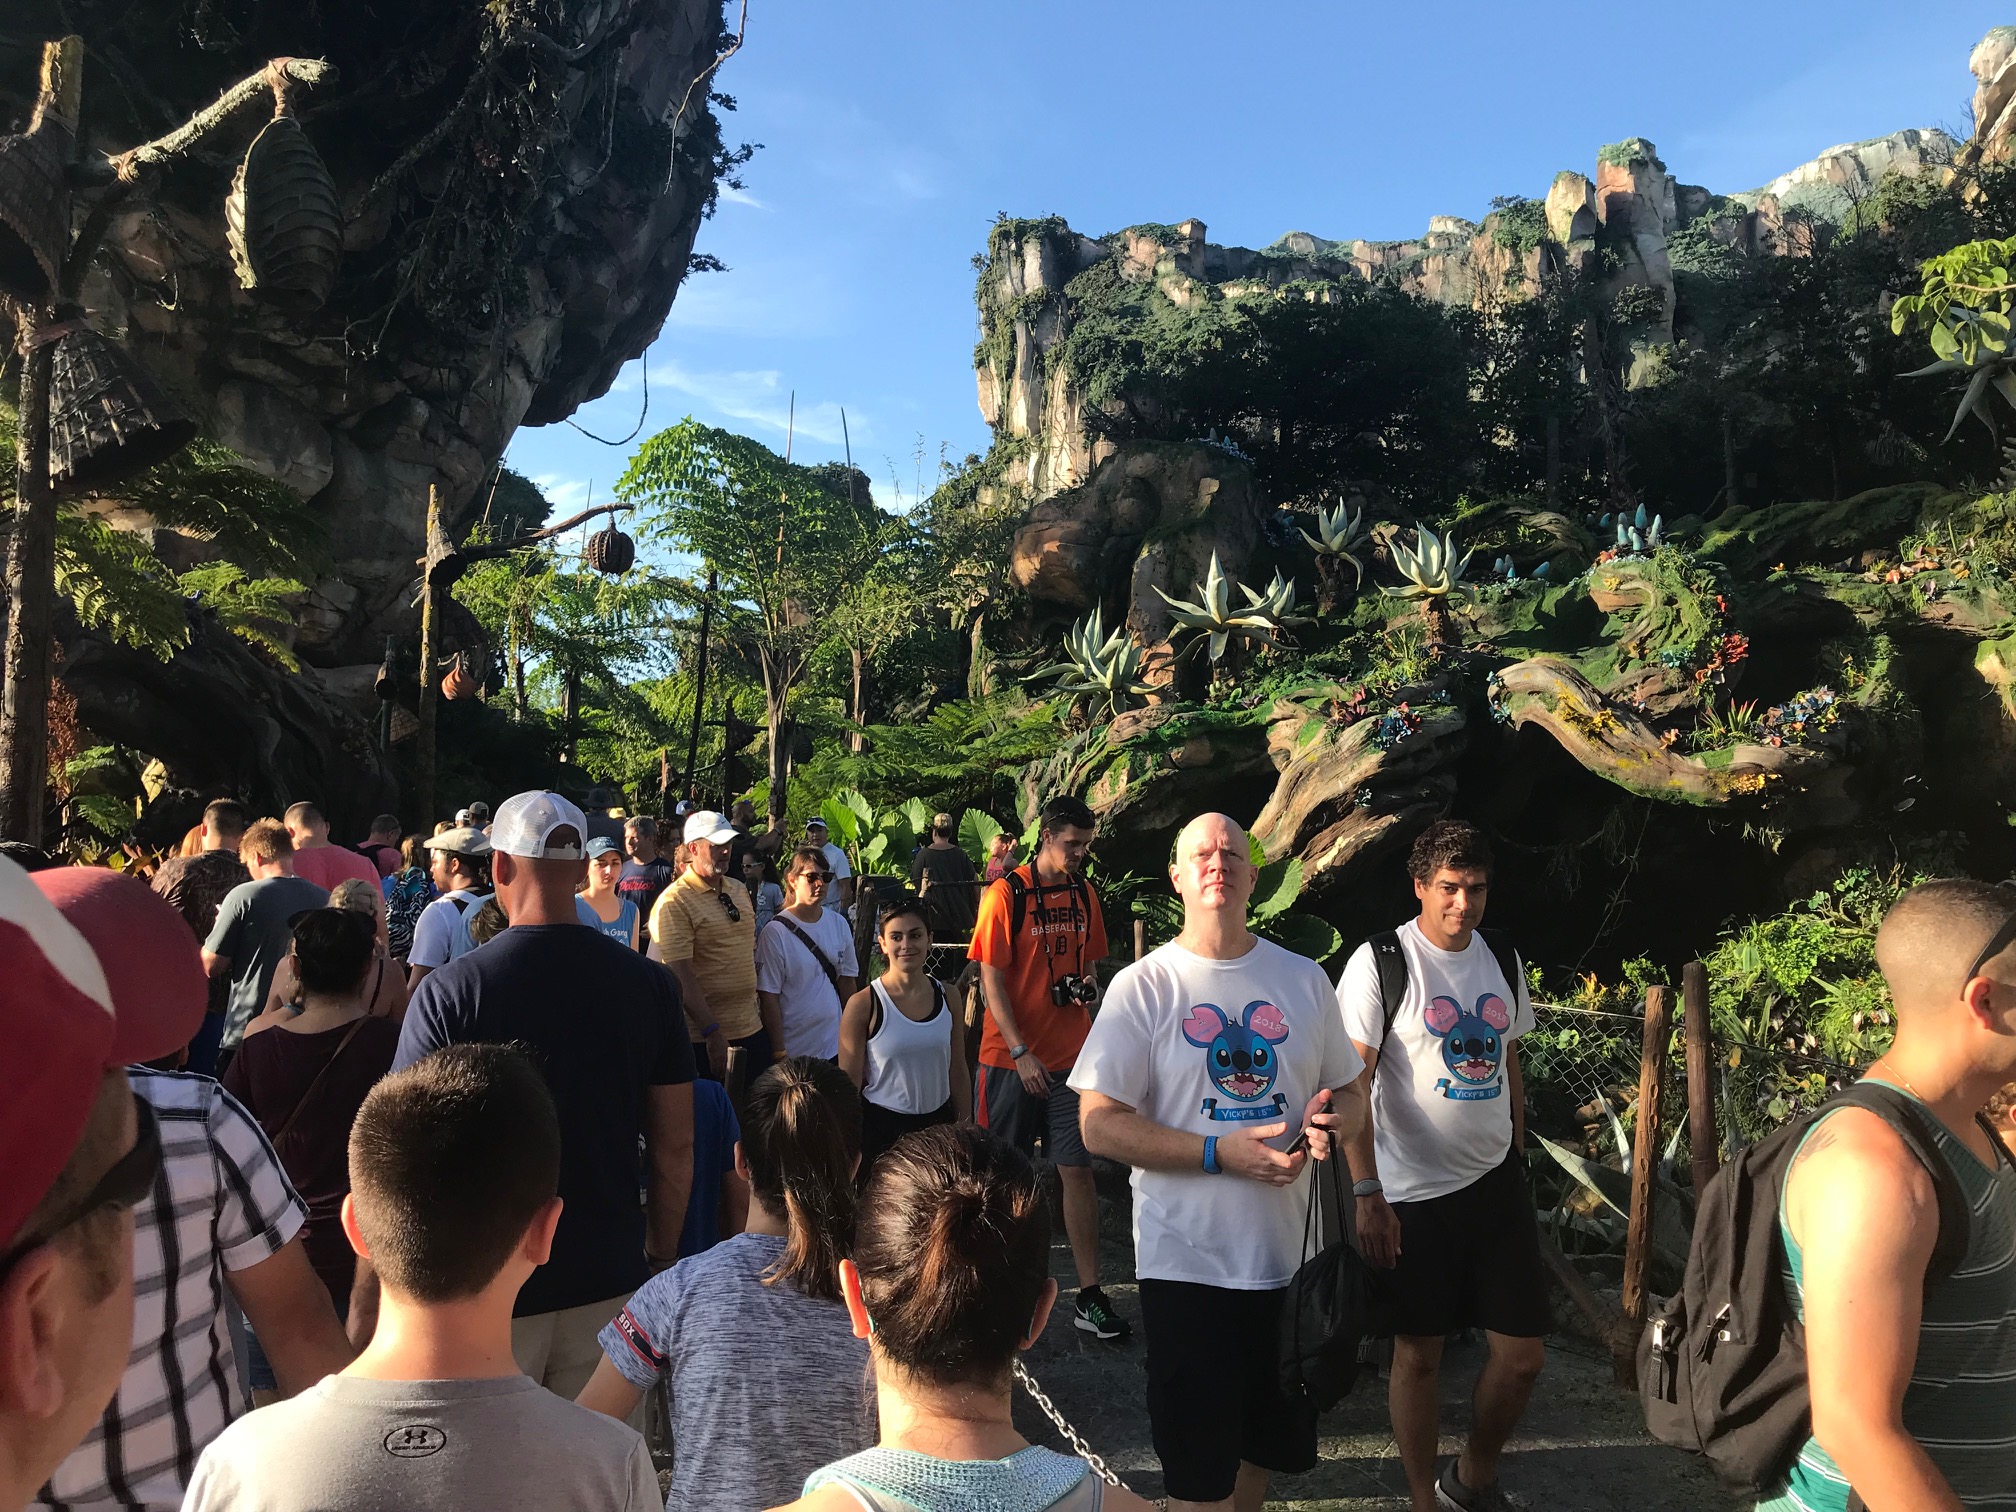
That’s a 35-minute drop from the last time! We’re off to a terrific start!
How about the other Pandora trip? Well, Na’vi River Journey fell from 52 minutes to 40 minutes. Again, signs point to lesser crowds at Animal Kingdom.
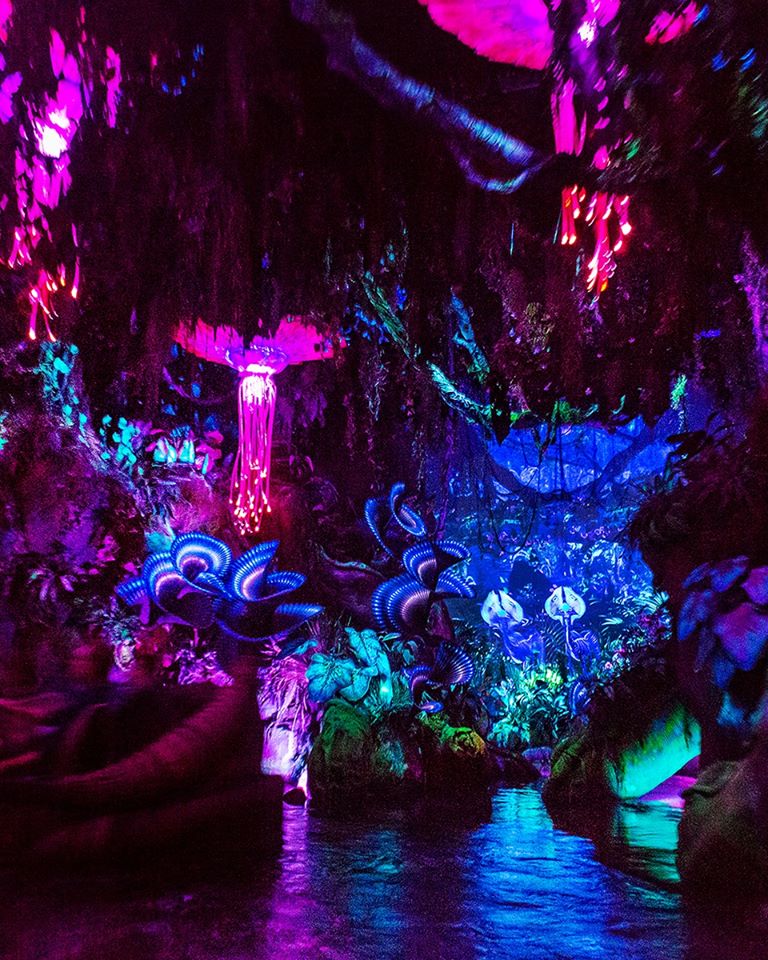
Photo Credit: The Verge via Facebook
Kali River Rapids and Kilimanjaro Safaris are usually the next two longest lines at the park. They were again this past week.
The water ride required a 31-minute wait, down 11 minutes from last time. The safari ride came with a 28-minute wait, down 22 minutes (!) week over week.
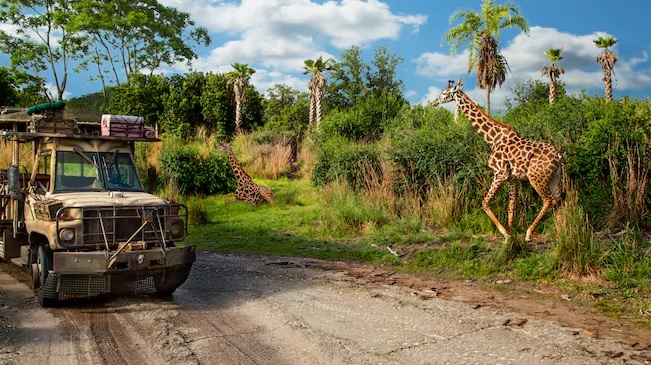
Photo: Disney
I think you can tell where we’re going with this. Let’s quickly glance at the other Animal Kingdom rides:
- Expedition Everest – 22 minutes, down 15
- DINOSAUR – 17 minutes, down 13
- It’s Tough to Be a Bug! – 10 minutes, down 3
- TriceraTop Spin – 5 minutes, down 5
Overall, the average Animal Kingdom attraction required a wait of 29 minutes. That’s down 15 minutes from the first week of August!
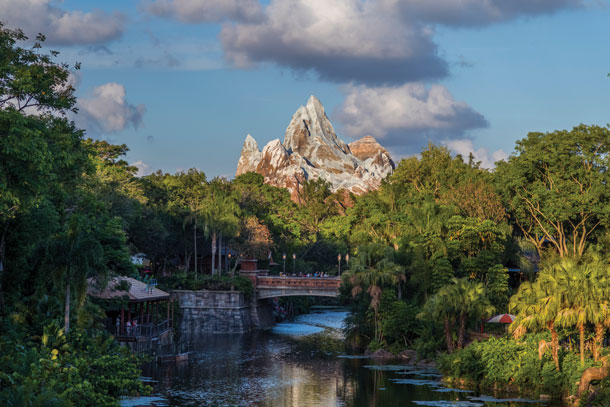
Photo: Disney
In other words, in just seven days, Animal Kingdom ride wait times shrunk by more than 50 percent!
We can speculate how much of this is schools starting vs. the latest COVID-19 outbreak, but it doesn’t really matter for Disney fans.
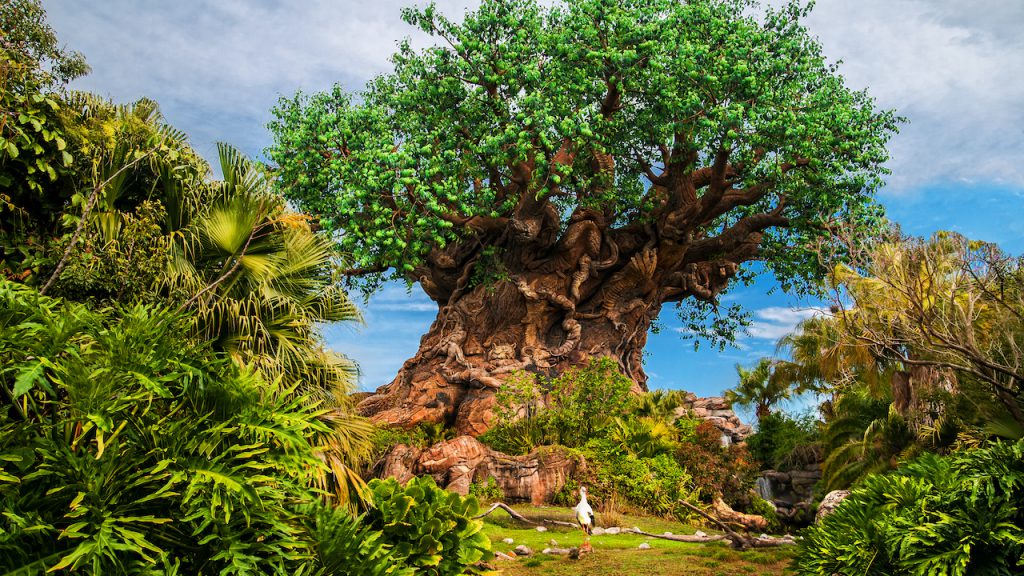
Image Credit: Disney
What’s important is that line queues were substantially shorter.
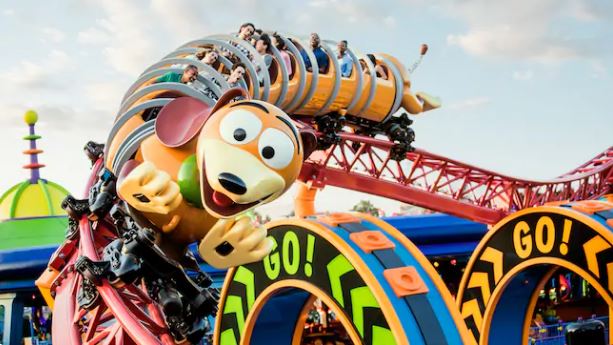
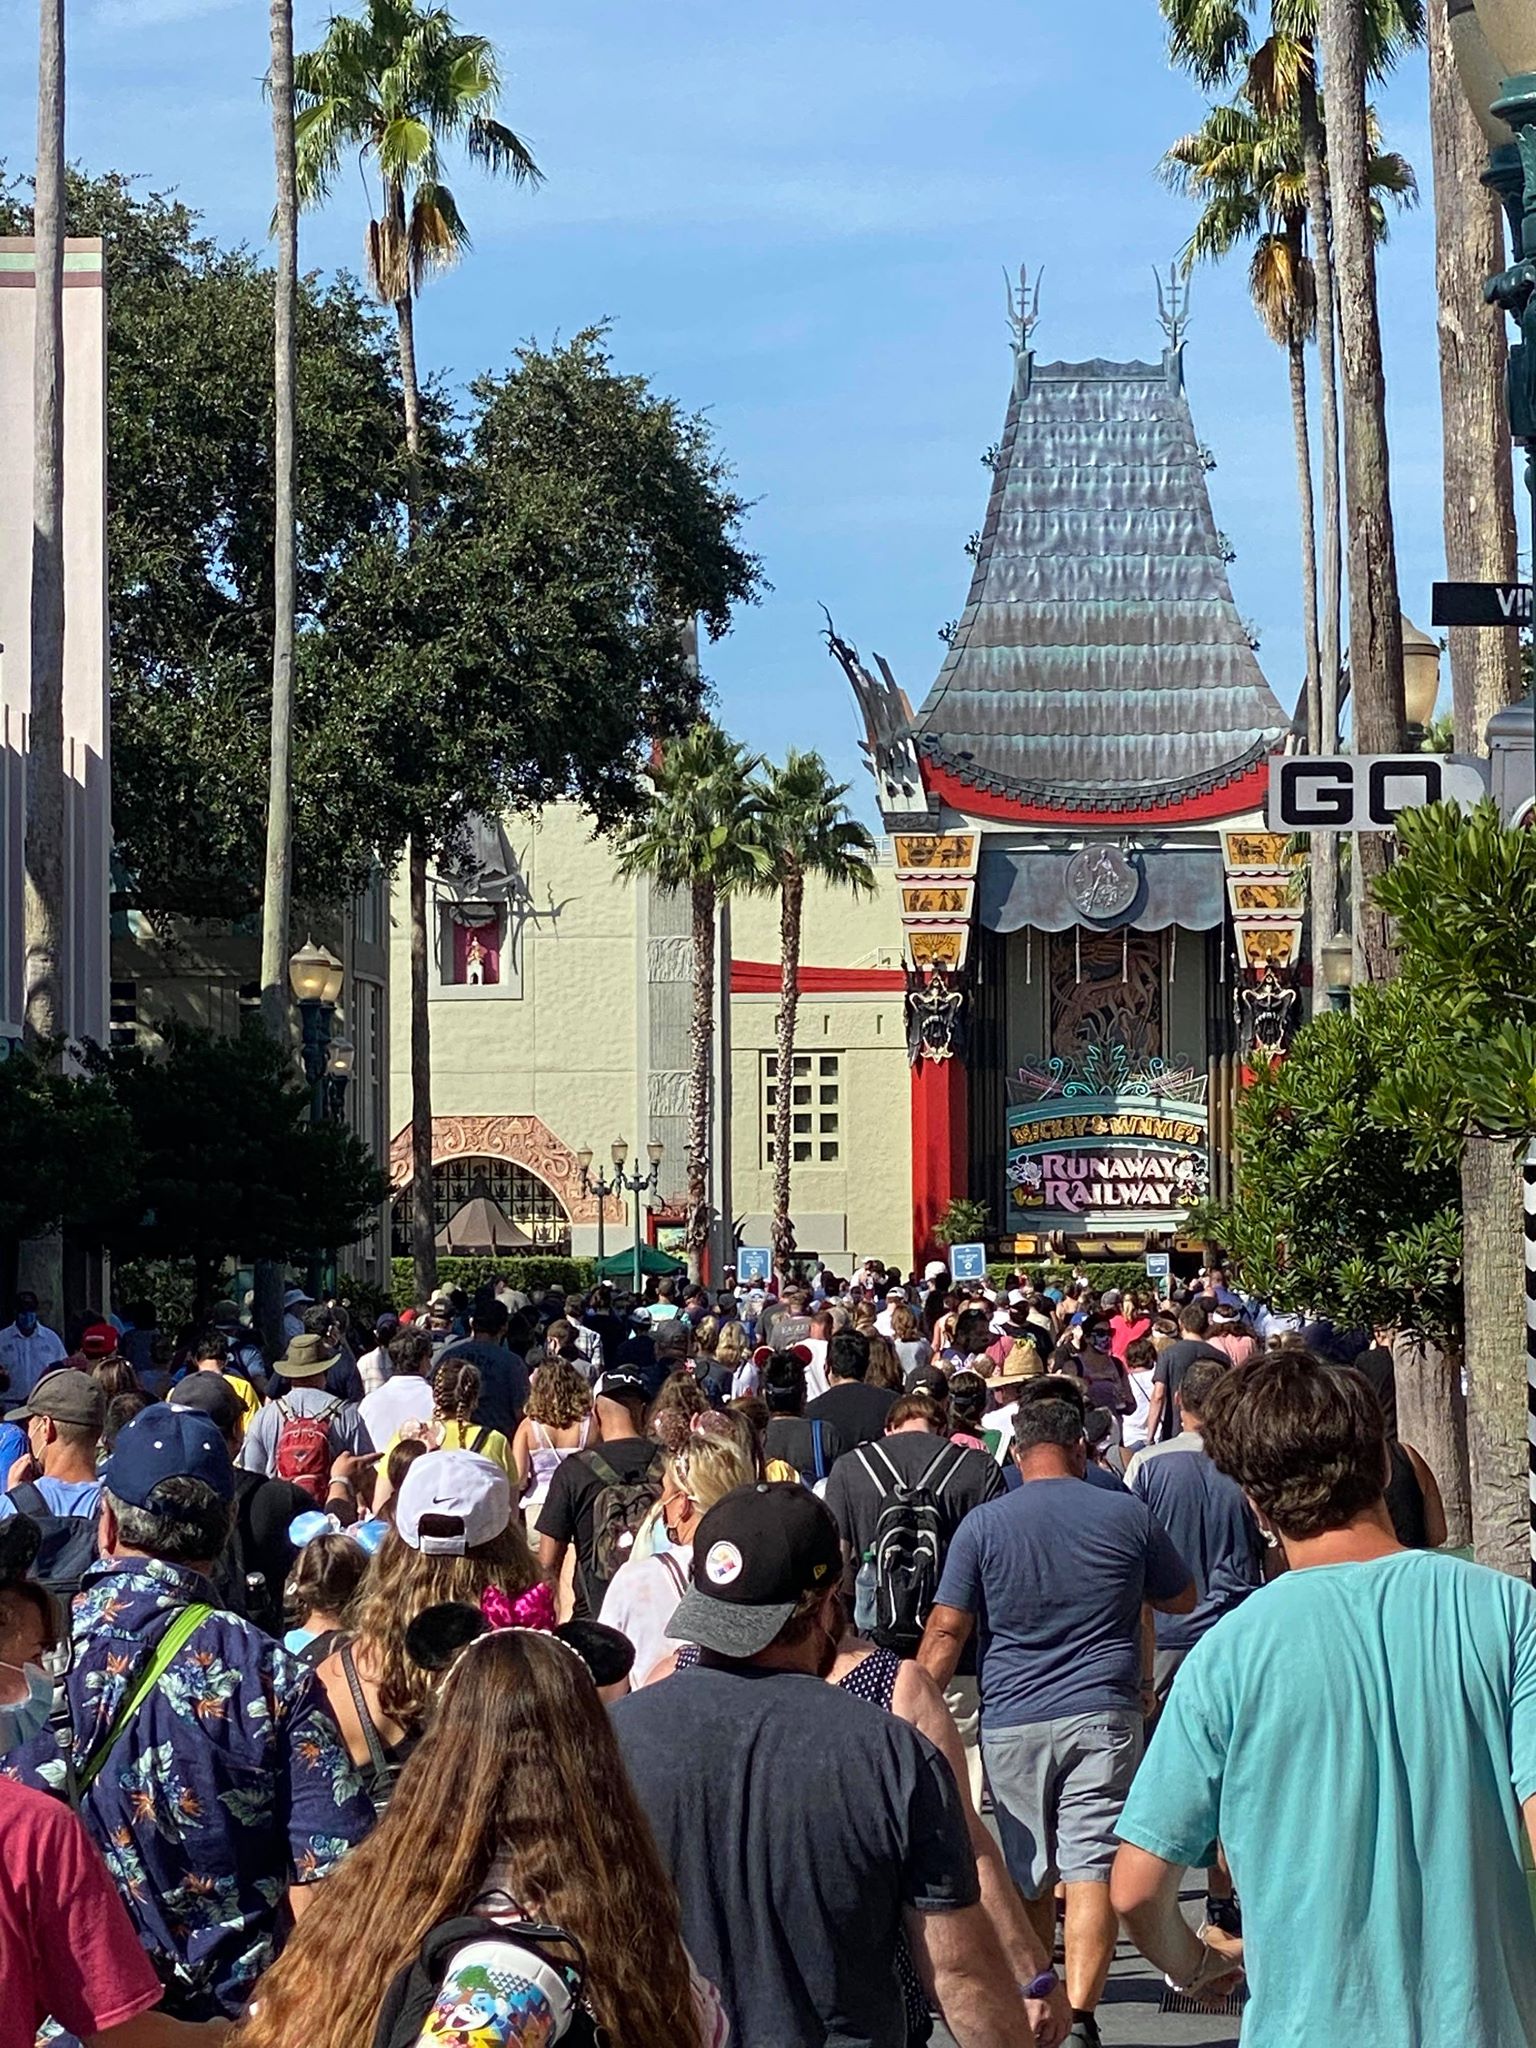
Disney’s Hollywood Studios
As usual, we start with Slinky Dog Dash at this park. It’s the indicator of what happens next.
By way of explanation, when the longest line at the park doesn’t require as much time, people have more free time for other attractions.
So, what we just witnessed with Animal Kingdom applies everywhere. When lines go down for Avatar Flight of Passage, everything else should shrink accordingly.
Photo: PassportToTheParks.com
The same premise isn’t quite as foolproof at Hollywood Studios, but it’s generally accurate.
Keeping that in mind, the Slinky roller coaster averaged a wait time of 82 minutes. That’s down a whopping 28 minutes from the first week of August.
Image Credit: Disney
The news should be universally positive for the other rides based on this one piece of intel. So let’s check to verify:
- Millennium Falcon: Smugglers Run – 70 minutes, down 19
- Rock ‘n’ Roller Coaster Starring Aerosmith – 57 minutes, down 17
- Mickey & Minnie’s Runaway Railway – 56 minutes, down 14
- Twilight Zone Tower of Terror – 48 minutes, down 12
- Toy Story Mania! – 45 minutes, down 7
- Alien Swirling Saucers – 35 minutes, down 7
- Star Tours – The Adventures Continue – 23 minutes, down 7
- Lightning McQueen’s Racing Academy – 14 minutes, down 3
- Muppet*Vision 3D – 11 minutes, up 1
Overall, we’ve had one attraction increase its wait time by one minute. Everything else has universally dropped.
Now, I should add that we’re still discussing fairly significant line time overall at Hollywood Studios.
The average attraction came with a 40-minute wait, which is down nine minutes but still, you know, a LOT. Thankfully, it’ll get better over the next few weeks.
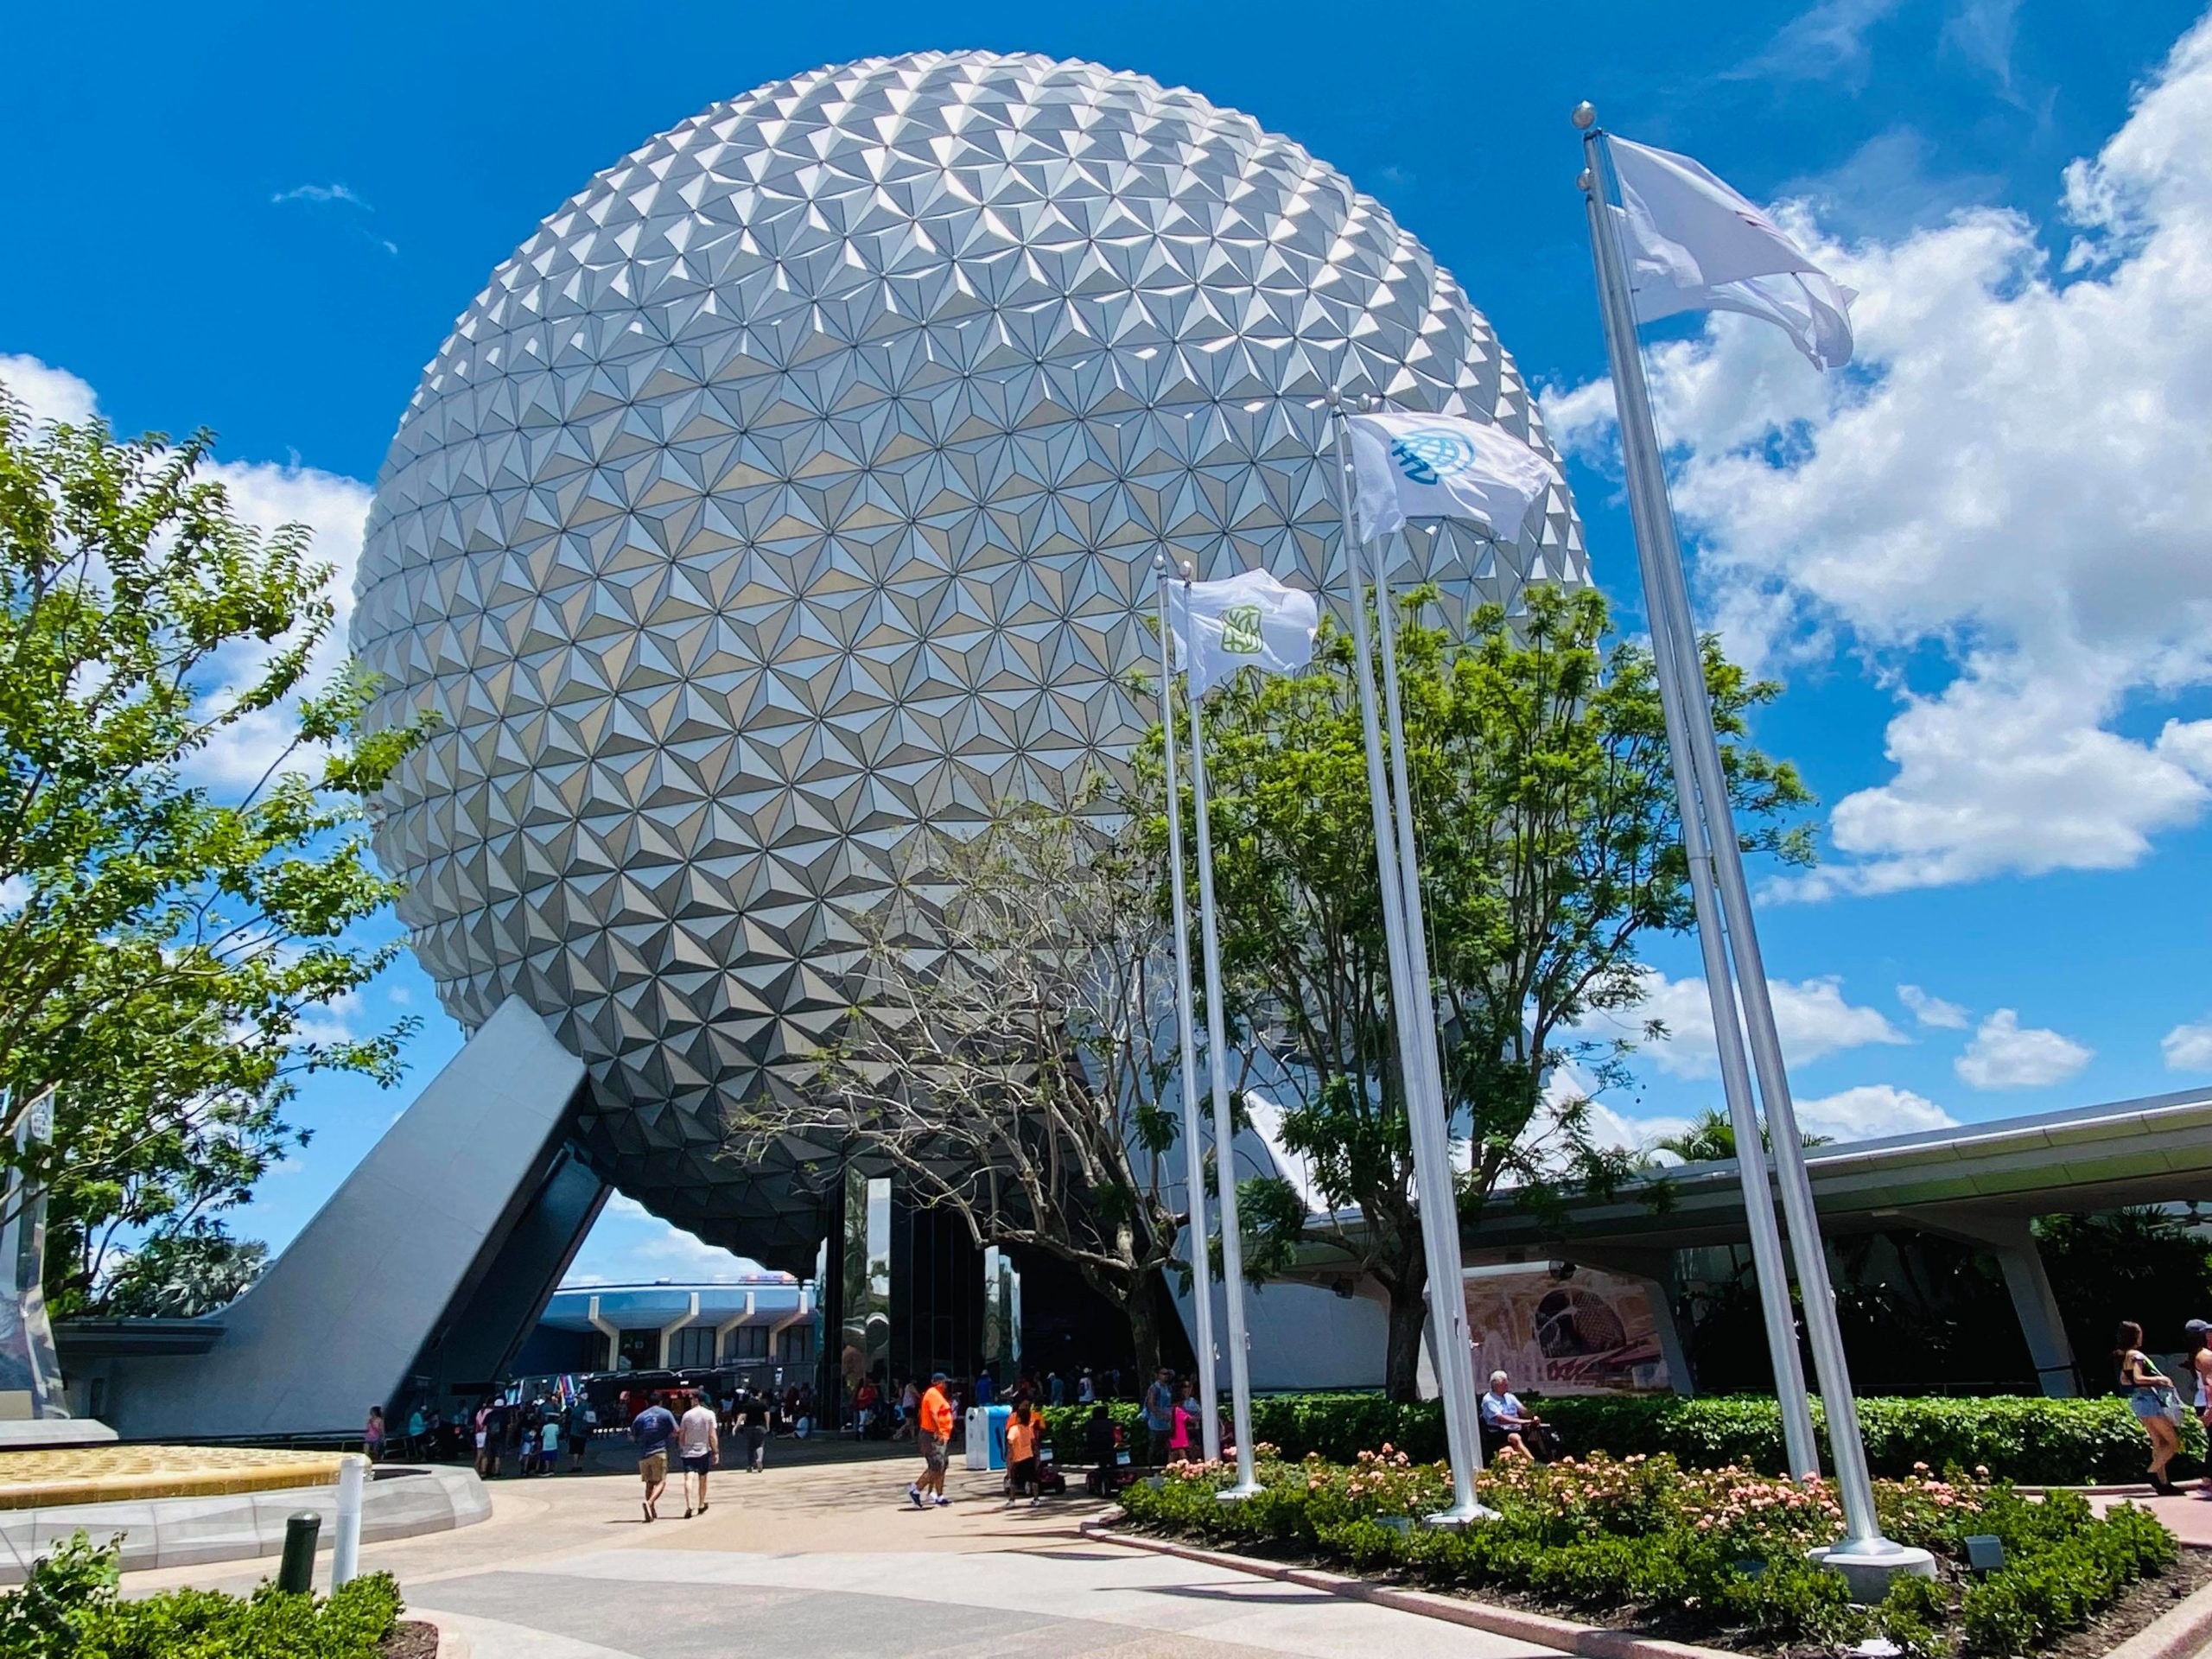
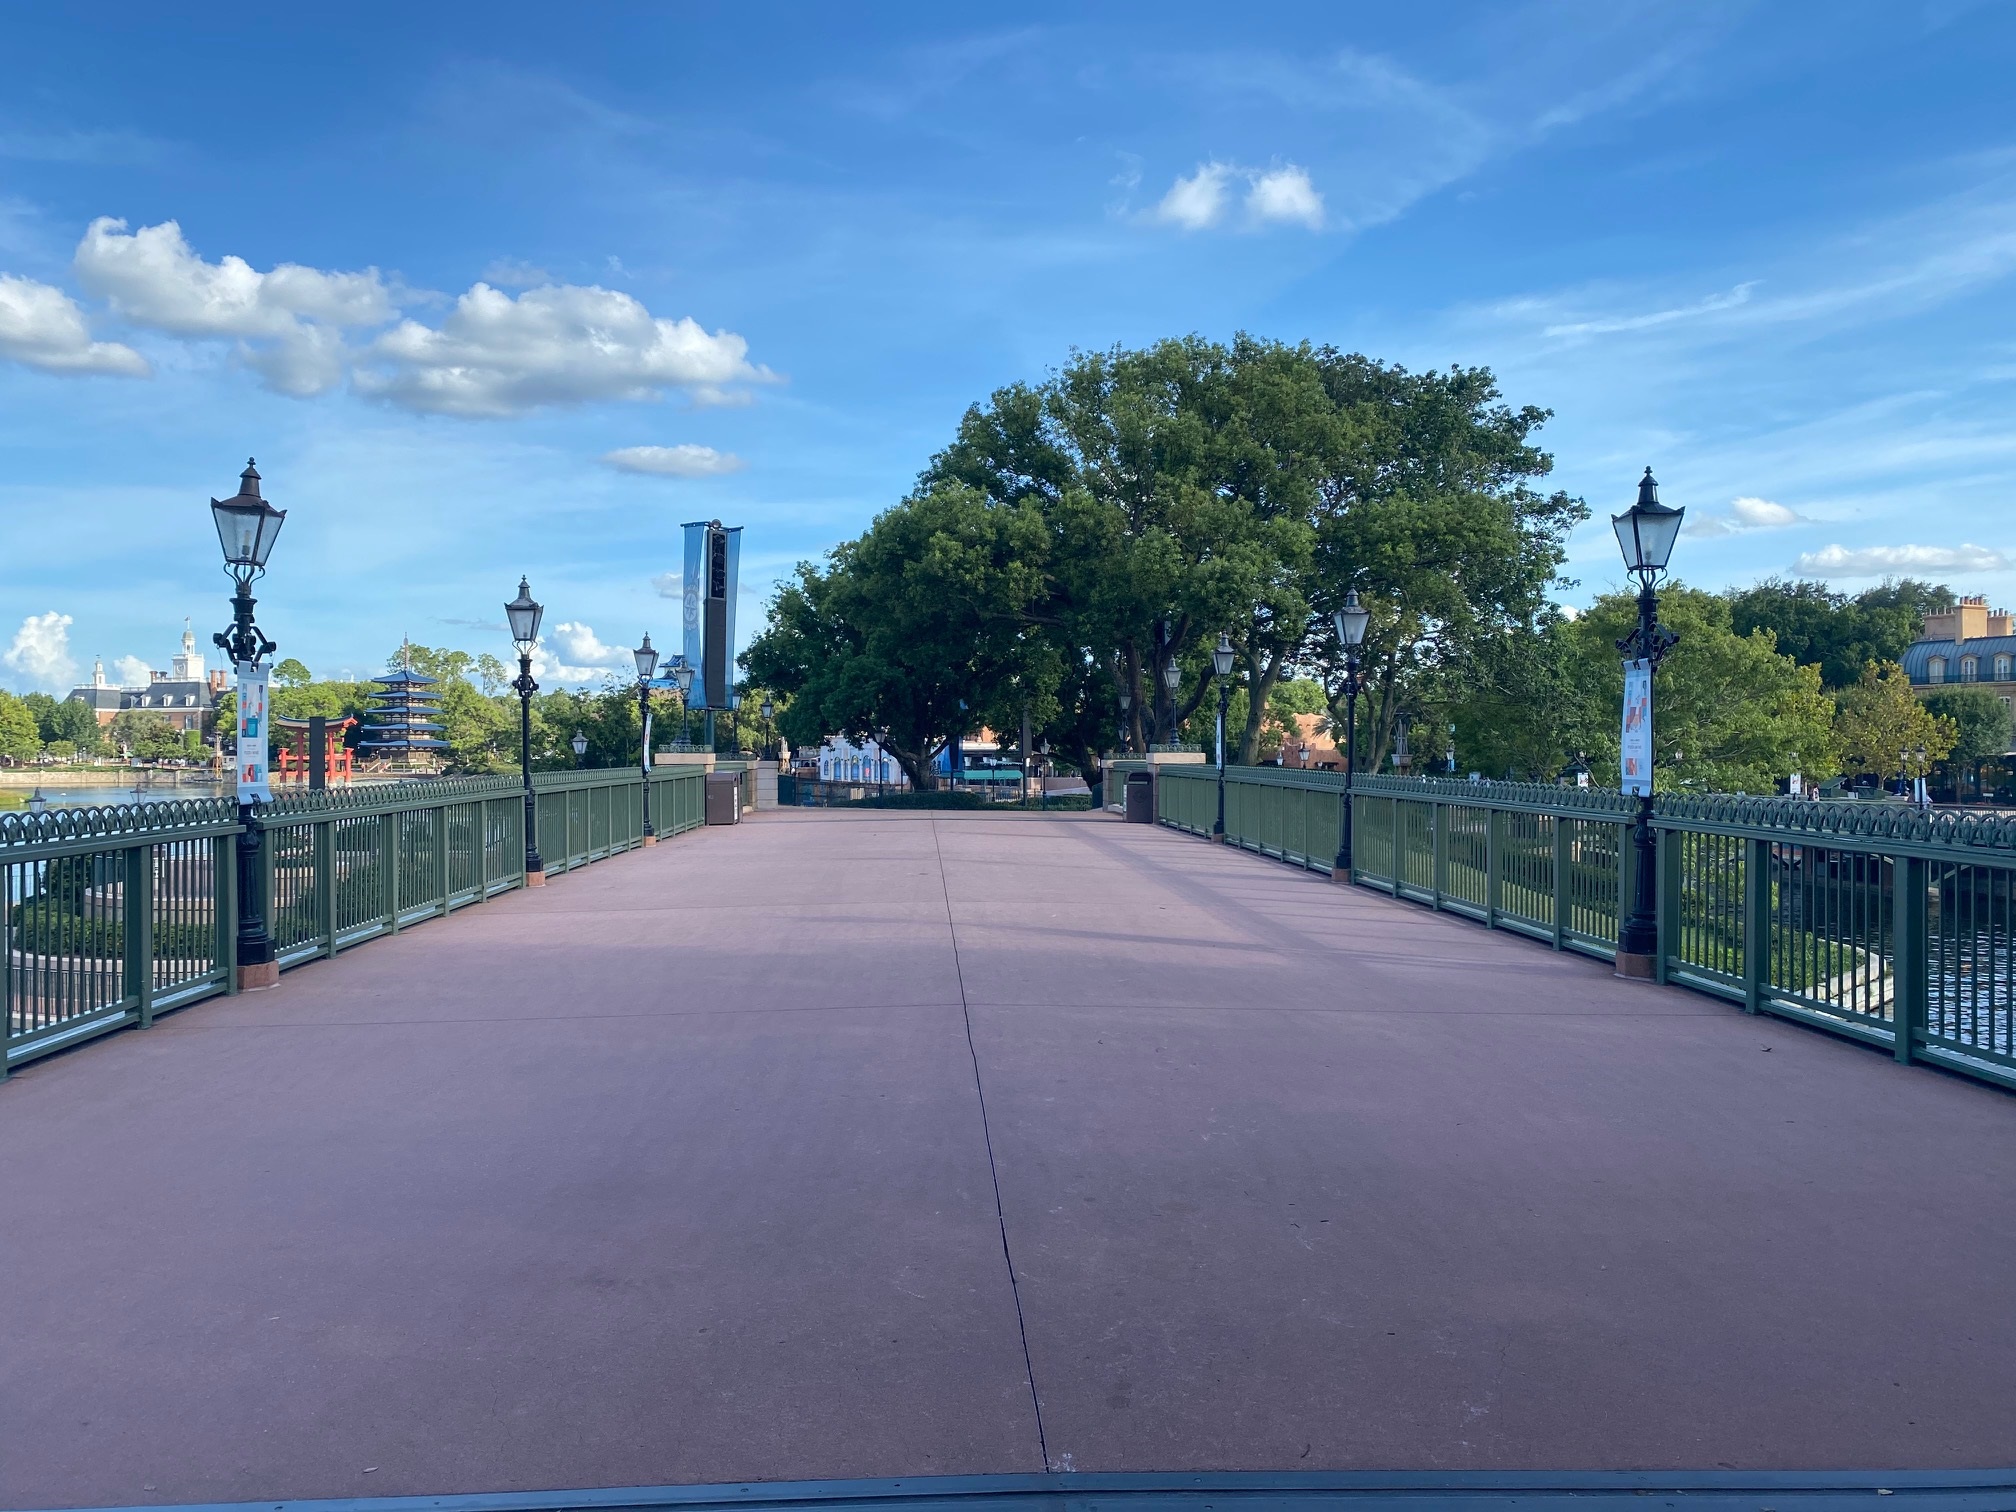
EPCOT
This park might prove anomalous, as EPCOT only averaged a 27-minute wait for its attractions during the first week of August.
Since EPCOT already required less line time, it can only go down by a few more minutes. So there’s a diminishing returns factor in play.
Let’s see how much that mattered, using our bellwether here, Test Track.
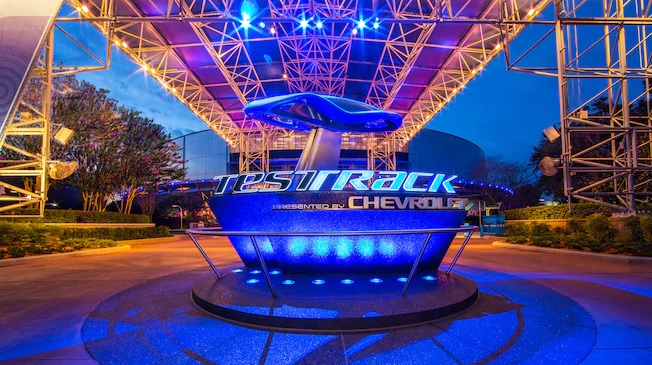
Photo: Disney
The combo dark ride and roller coaster came with an average wait of 53 minutes, down 20 minutes from last time. Hmm, that’s interesting and unexpected.
The other members of the big three, Frozen Ever After and Soarin’, both dropped, too.
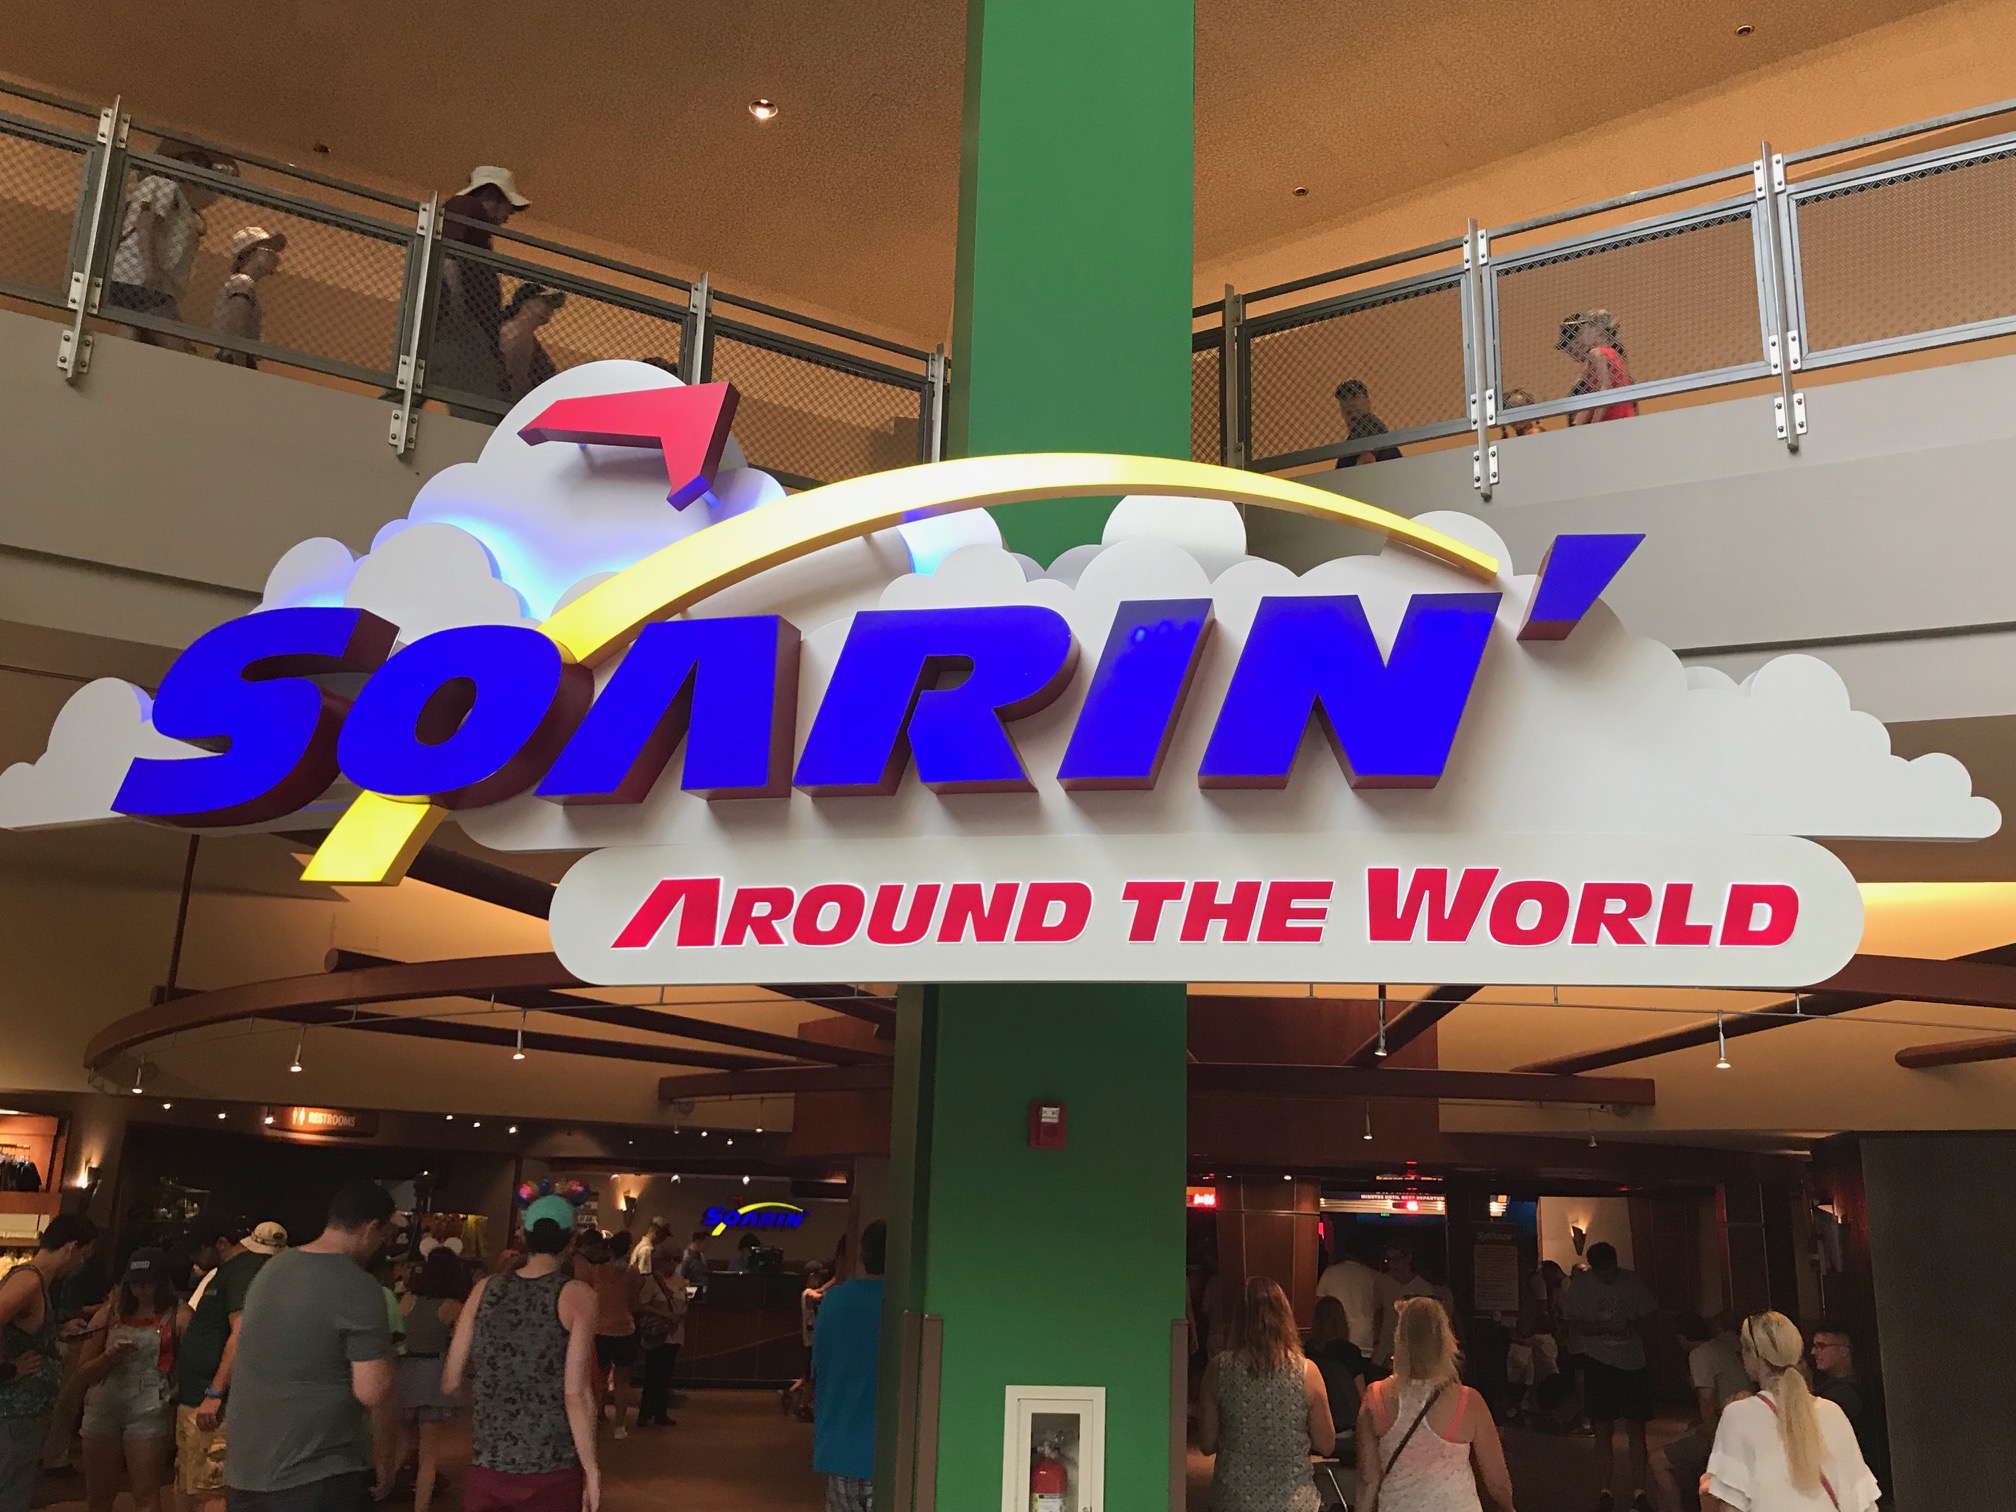
The journey through Arendelle only required a 36-minute wait, down from 50 minutes last time. For Soarin’, the wait averaged 19 minutes.
Friends, Soarin’ dropped from 29 to 19 minutes. When Soarin’ is under 20 minutes, you’re going to have a spectacular time at EPCOT.
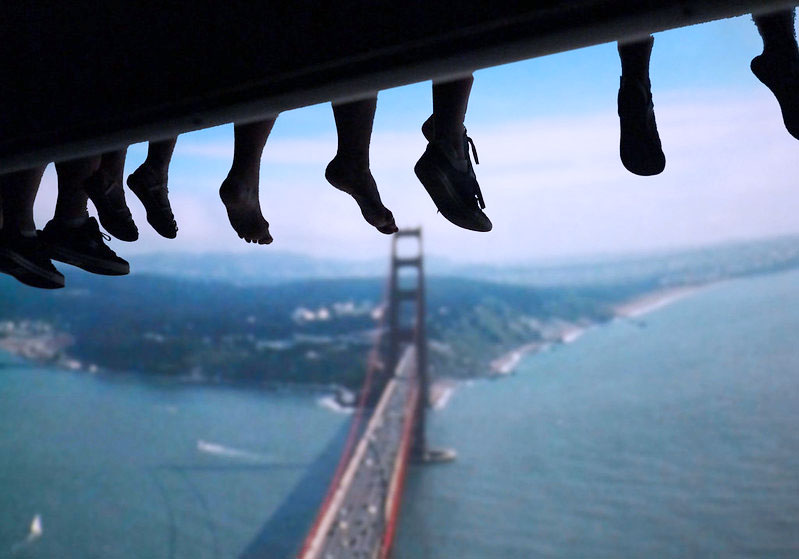
Photo: DVC Shop
In fact, this number surprised me so much that I investigated it a bit more. Projected wait time vs. actual wait time charts here are pretty funny.
Since we can say with confidence now that EPCOT attractions all dropped, let’s just run through the rest of the data:
- Mission: SPACE – 19 minutes, down 12
- Spaceship Earth – 14 minutes, down 10
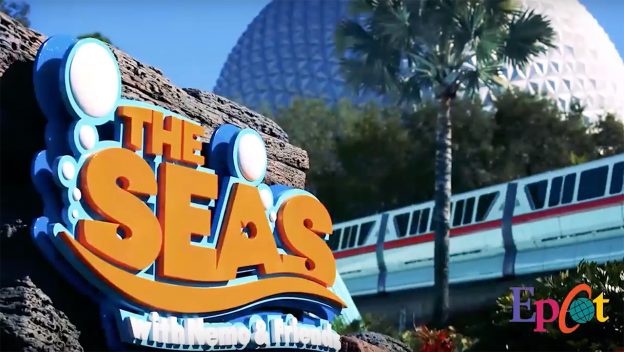
- The Seas with Nemo & Friends – 13 minutes, down 3
- Gran Fiesta Tour Starring the Three Caballeros – 10 minutes, down 4
- Living with the Land – 7 minutes, down 3
- Journey into the Imagination with Figment – 6 minutes, down 5
The average EPCOT attraction included a wait of 18 minutes, down 50 percent (!) from the first week of August.
This is what I get for making my prep notes before I have the data!
Once again, EPCOT provides the best bang for the buck at Walt Disney World.
Magic Kingdom
We’ve only got one park left. At this point, it would be a shock if Magic Kingdom’s behavior deviated that much from the other three parks.
Let’s see whether it followed the pattern or somehow stayed crowded:
- Seven Dwarfs Mine Train – 73 minutes, down 21
- Splash Mountain – 60 minutes, down 21
- Jungle Cruise – 58 minutes, down 24
- Peter Pan’s Flight – 54 minutes, down 4
- Space Mountain – 52 minutes, down 20
- Haunted Mansion – 45 minutes, down 10
- Astro Orbiter – 41 minutes, down 8
- Pirates of the Caribbean – 40 minutes, down 6
- Buzz Lightyear’s Space Ranger Spin – 36 minutes, down 11
- It’s a Small World – 30 minutes, down 14
- The Many Adventures of Winnie the Pooh – 30 minutes, down 9
- Big Thunder Mountain Railroad – 28 minutes, down 9
- Under the Sea ~ Journey of the Little Mermaid – 26 minutes, down 10
- Tomorrowland Speedway – 22 minutes, down 11
- Monsters, Inc. Laugh Floor – 20 minutes (previously closed)
- Tomorrowland Transit Authority PeopleMover – 19 minutes, down 3
- Magic Carpets of Aladdin – 18 minutes, down 12
- Mickey’s PhilharMagic – 18 minutes, down 8
- The Barnstormer – 17 minutes, down 15
- Dumbo the Flying Elephant – 16 minutes, down 16
- Mad Tea Party – 14 minutes, down 6
- Prince Charming’s Regal Carrousel – 14 minutes, down 12
- Walt Disney’s Carousel of Progress – 5 minutes, down 2
- Country Bear Jamboree – 2 minutes, down 2
Photo: Disney
Overall, this is excellent news. The average Magic Kingdom attraction required a wait of 32 minutes.
While that’s still a longer average wait than we’d like to see, it’s down a whopping 11 minutes or 34 percent. So, the park is normalizing.
In another three or four weeks, we’ll reset to modest wait times again, at least until October 1st.