Walt Disney Wait Times for First Week of August 2021
Okay, we’ve entered August, which means Disney crowds should gradually go down over the next few months.
We shouldn’t see crowds like July again until the holidays. Also, with Central Florida experiencing a COVID-19 outbreak, more people probably stayed inside.
As such, we’re expecting some changes in the wait times for the first week of August. Are we right? Well…
Disney’s Animal Kingdom
Okay, we’ll know right off the bat or at least have a good idea.
Image Credit: Disney
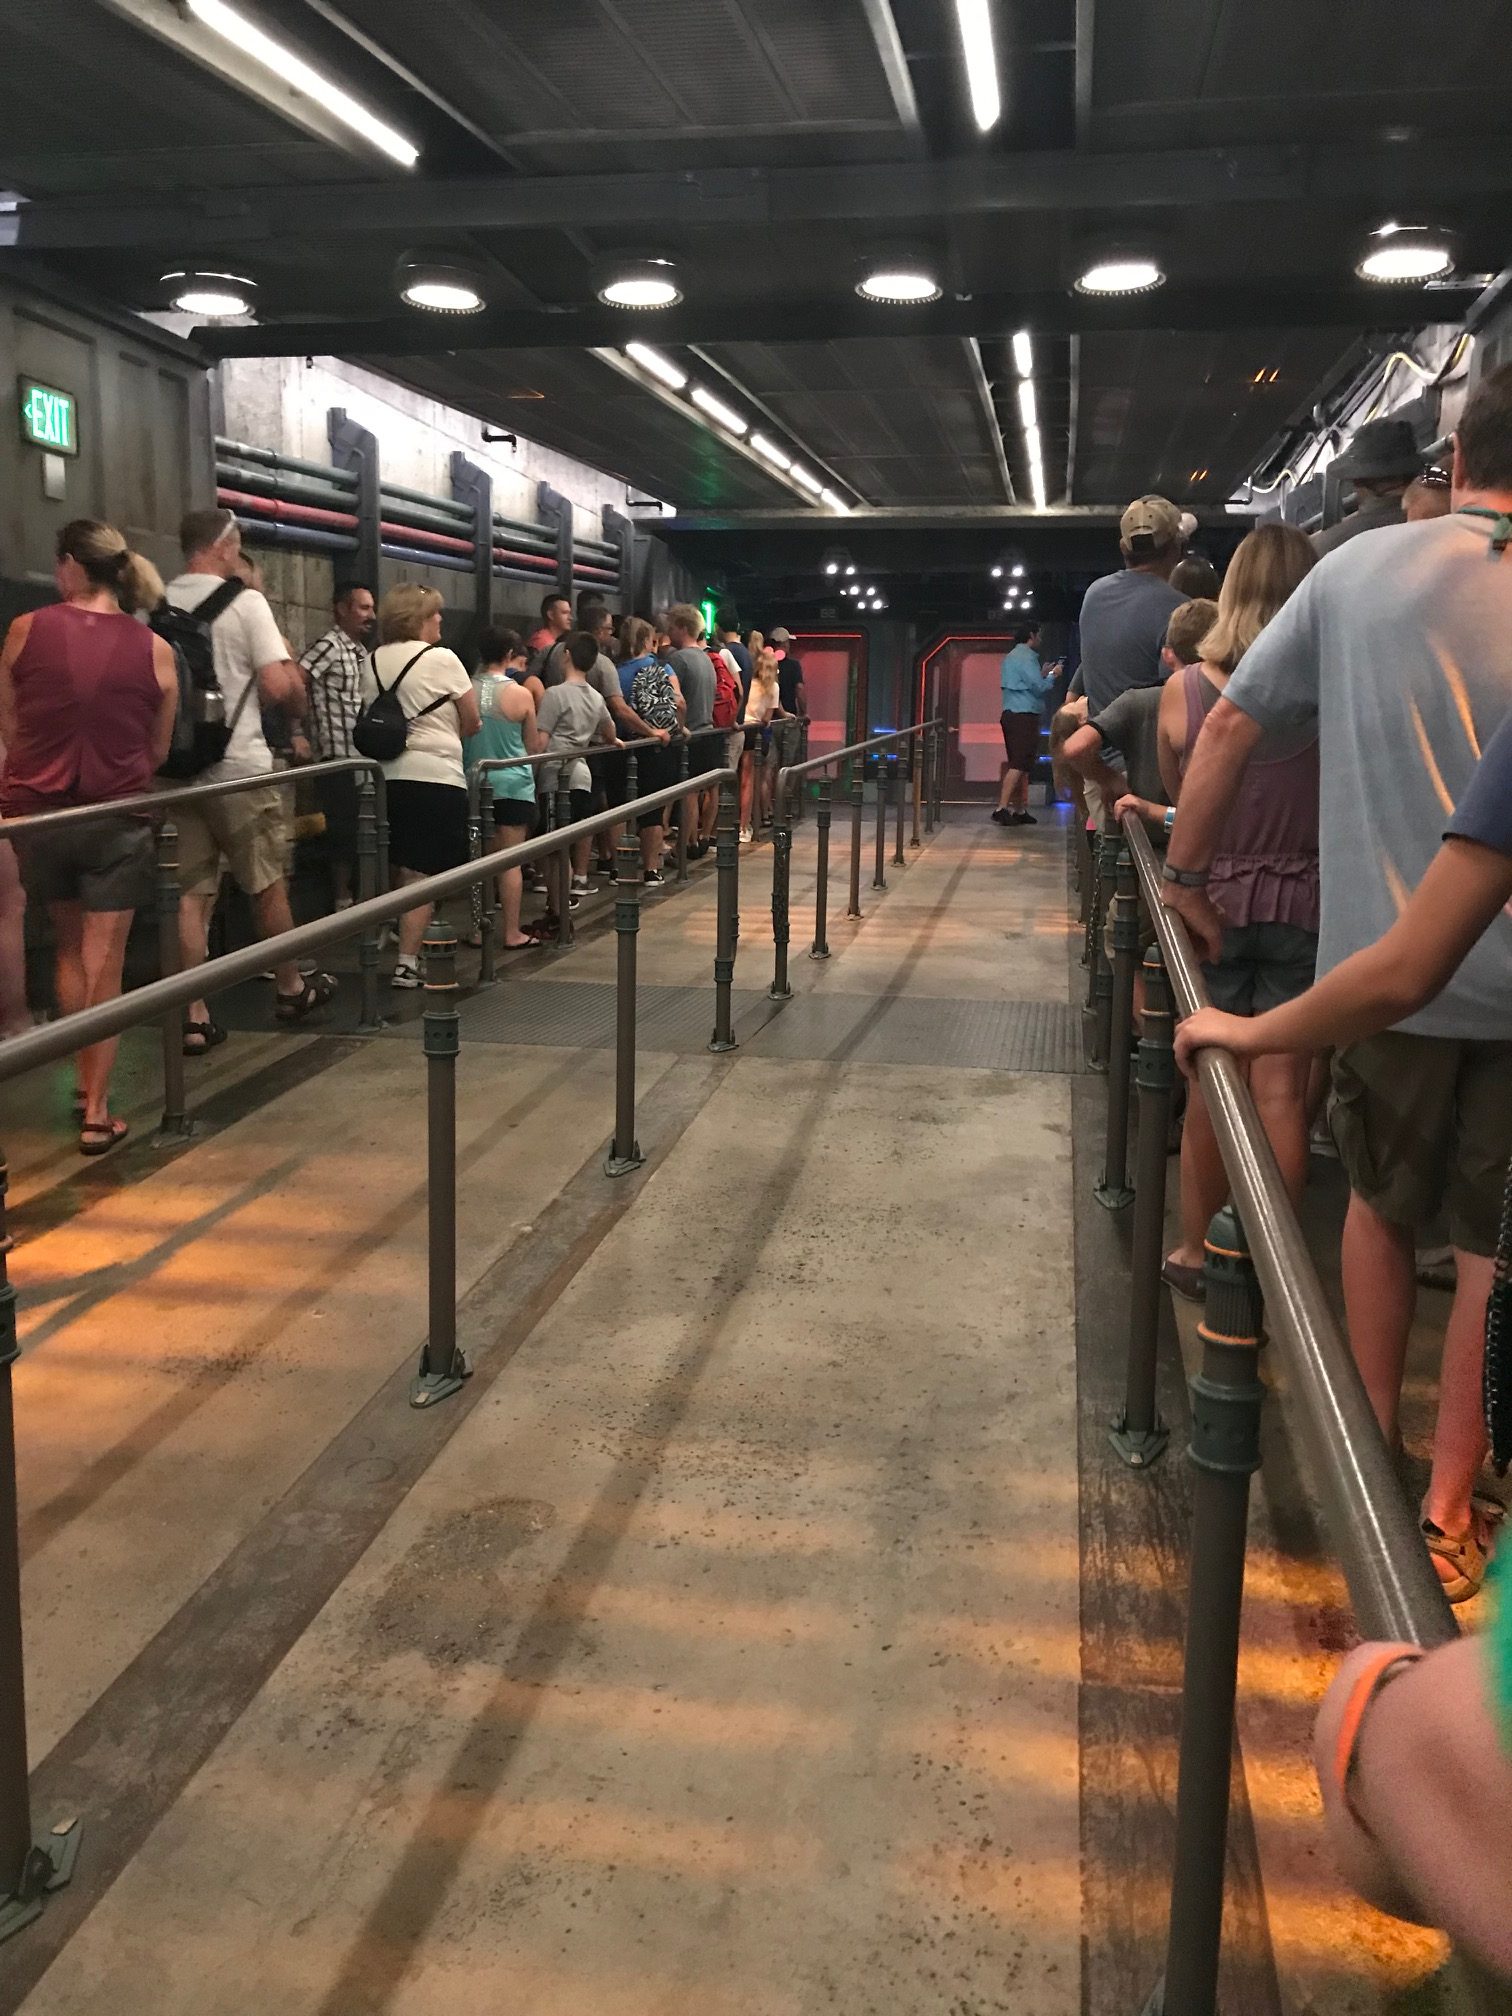
How long did guests average while standing in line for Avatar Flight of Passage?
The answer is 110 minutes, which IS down 21 minutes from last time! So we’re off to a great start!
Of course, two other Animal Kingdom attractions have claimed outrageous waits lately, too.
I’m speaking of Na’Vi River Journey, which dropped from 58 to 52 minutes. Also, I’m referencing Kilimanjaro Safaris, which did even better.
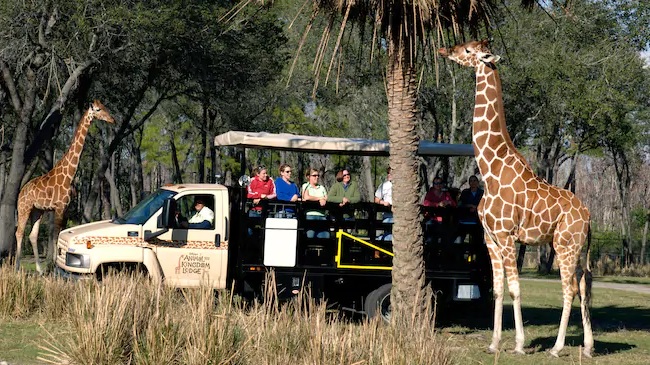
Photo: Disney
The Jeep ride into the wide world of animals fell from 62 minutes to 50 minutes.
Folks, those three rides on their own required 39 minutes less time spent standing in the queue!
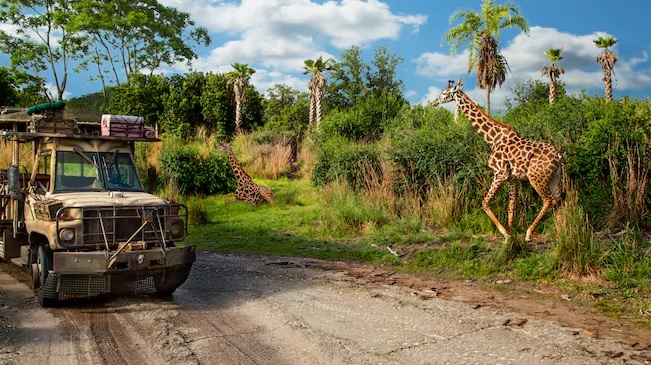
Photo: Disney
How did the rest of the park do? Let’s see!
- Kali River Rapids – 43 minutes, down 14
- Expedition Everest – 37 minutes, down 7
- DINOSAUR – 30 minutes, down 9
- It’s Tough to Be a Bug! – 13 minutes, down 5
- TriceraTop Spin – 10 minutes, down 5
The average Animal Kingdom attraction came with a (much more reasonable) time of 44 minutes, a 20% drop from 55 minutes last time.
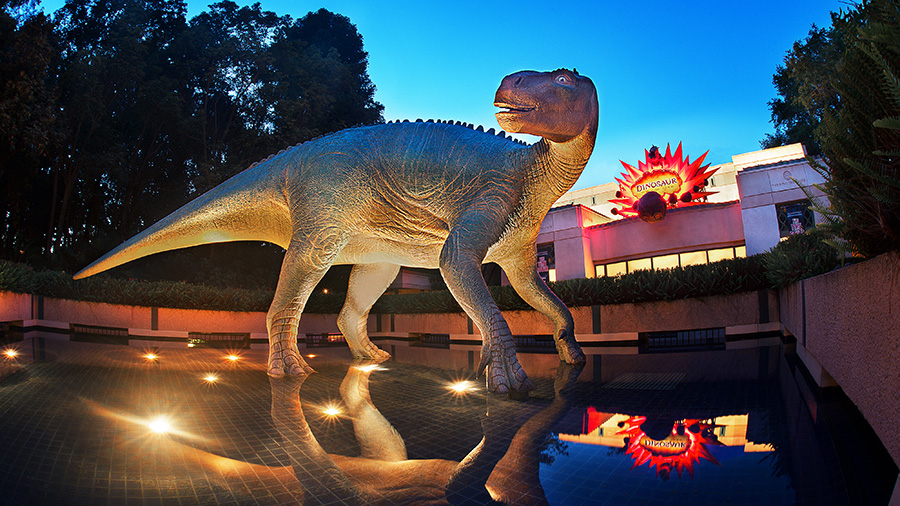
Image Credit: Disney
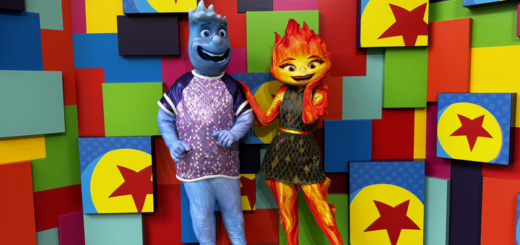
Disney’s Hollywood Studios
Okay. I won’t lie. I’m strutting around after that. Did I get overly cocky?
Let’s take a look at Hollywood Studios to decide whether the other park was a fluke.
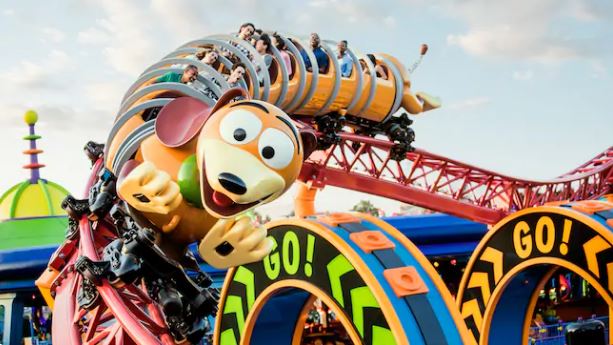
As you know by now, the longest line at Hollywood Studios resides at Slinky Dog Dash. And the news is less positive here.
The roller coaster increased its average wait from 104 to 109 minutes.
On the plus side, Millennium Falcon: Smugglers Run did better. The wait here decreased from 100 to 89 minutes. That’s still too long, but it’s…improving.
Rock ‘n’ Roller Coaster Starring Aerosmith similarly fell slightly but not as much as we’d like. It averaged a 74-minute wait after 81 minutes last time.
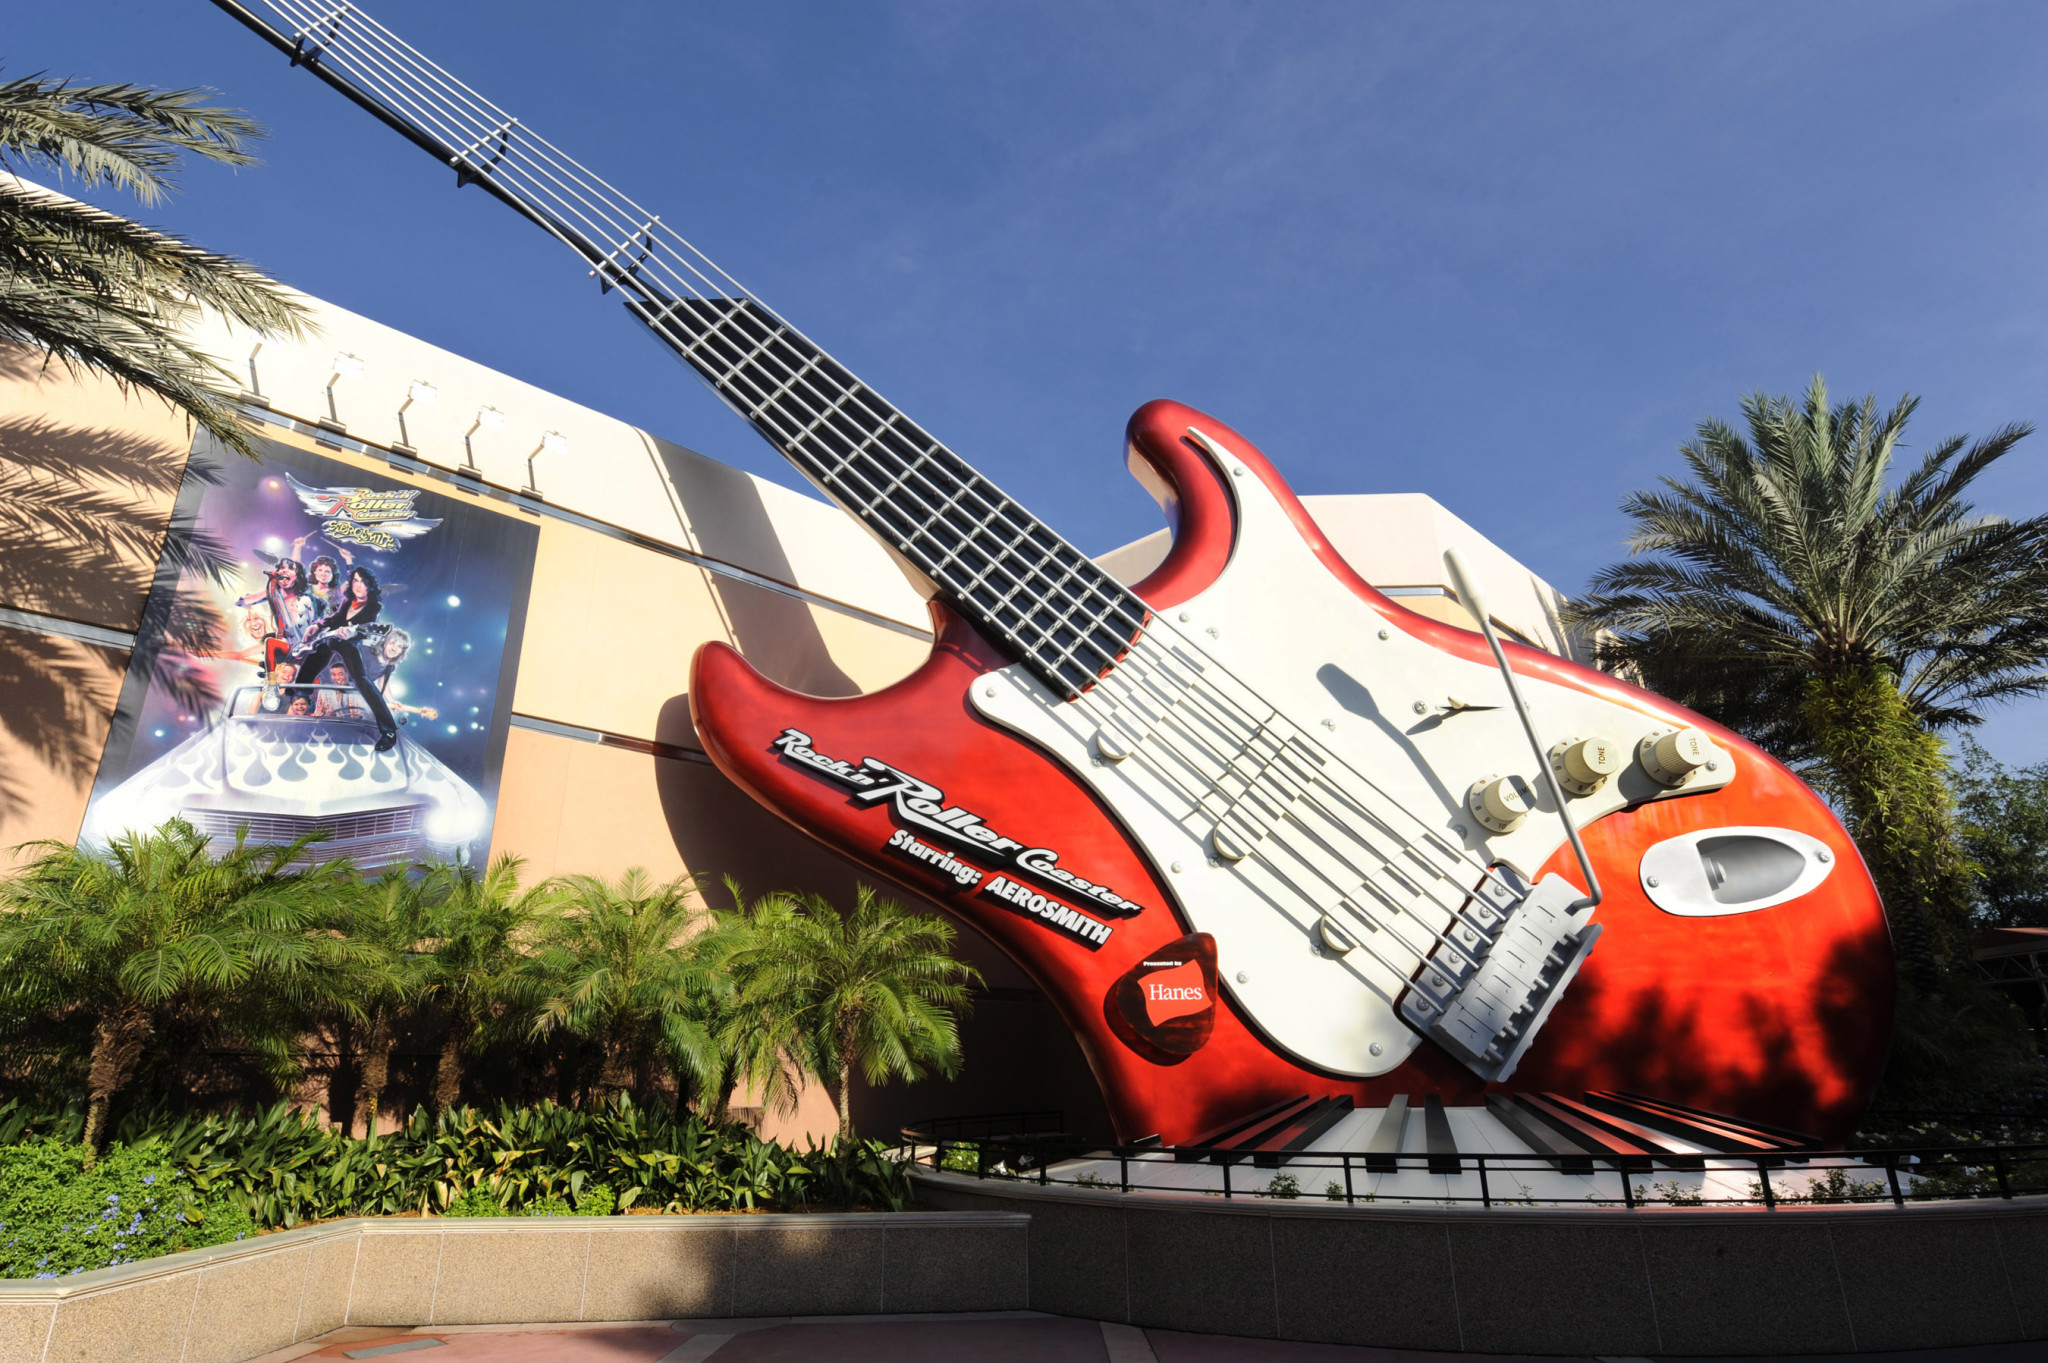
Photo: Disney
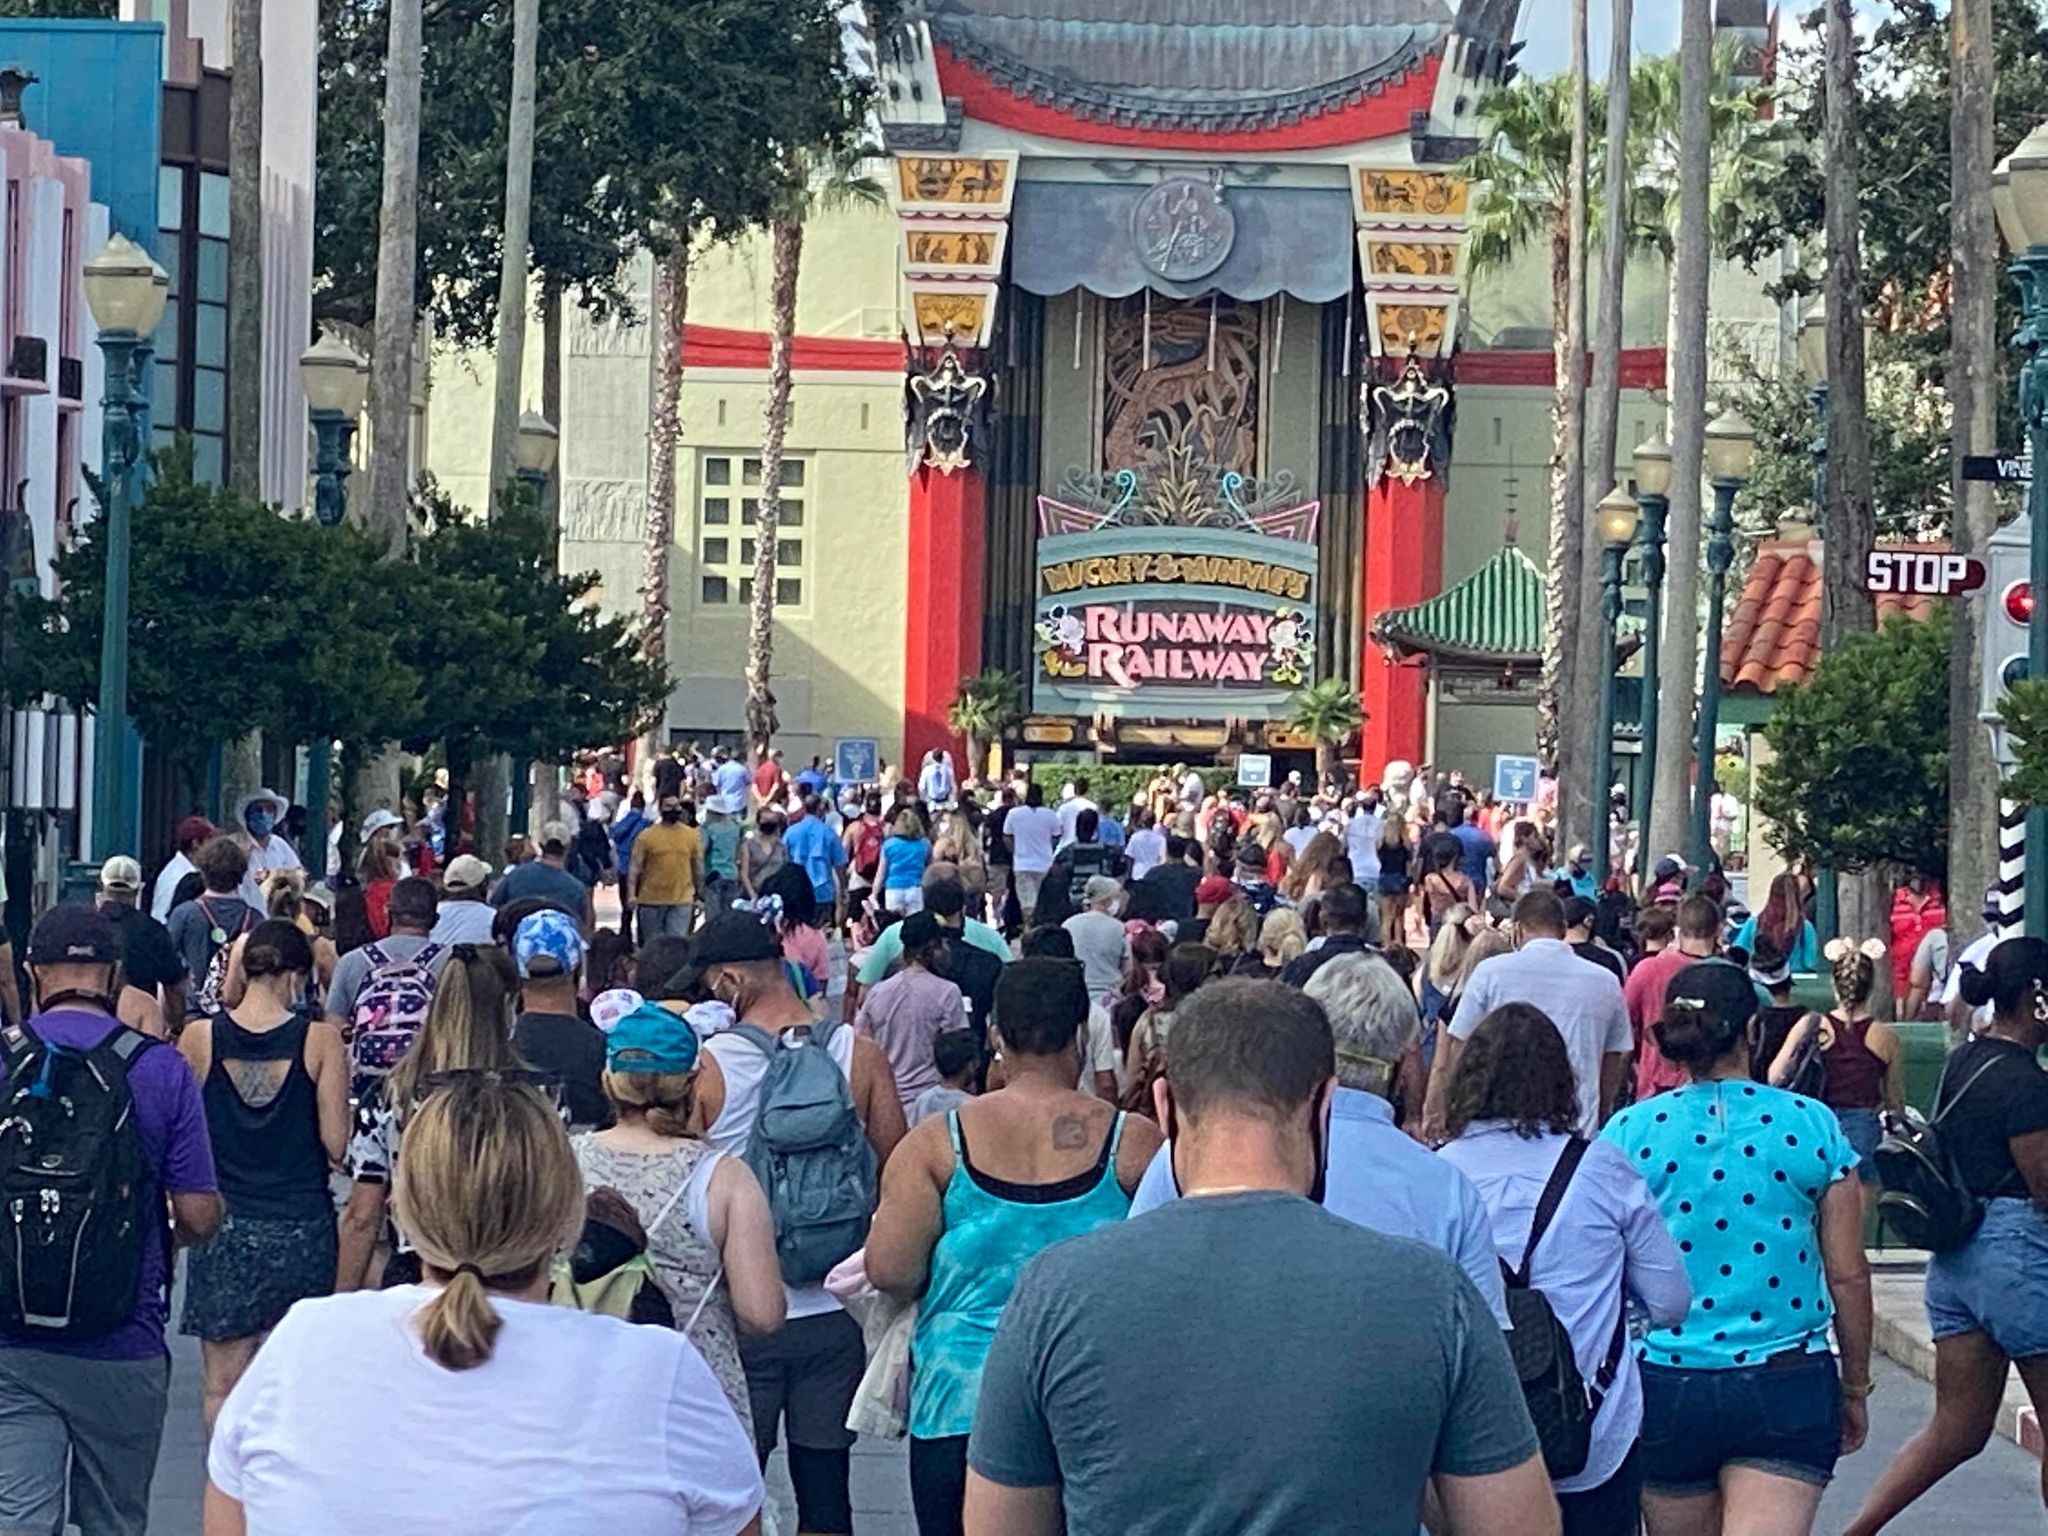
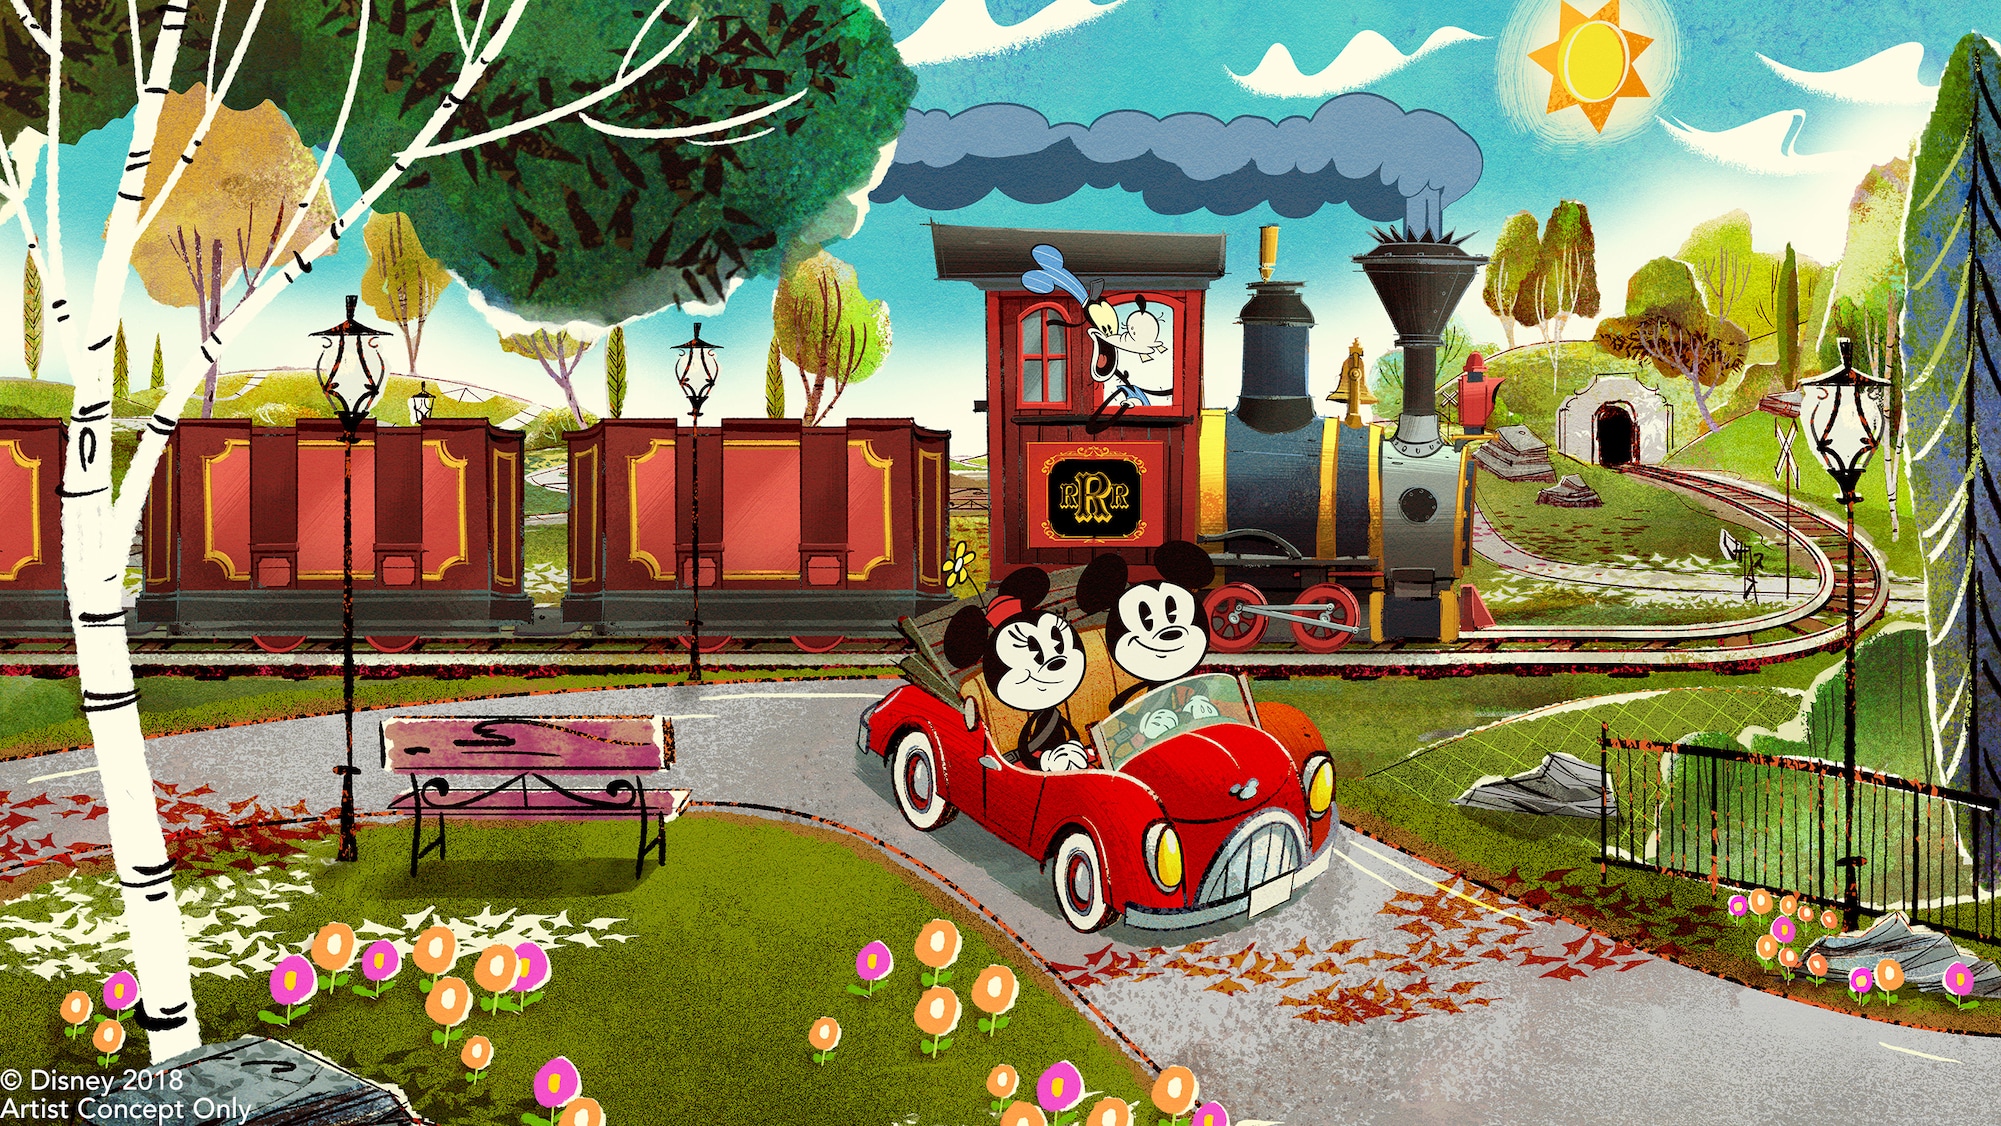
The trend continues at Mickey & Minnie’s Runaway Railway, which came with a 70-minute wait. That’s slightly better than the 74 minutes the prior week.
Still, those four attractions only changed 17 minutes overall, thankfully trending downward.
As for the rest of Hollywood Studios, here’s what we’ve got.
- Twilight Zone Tower of Terror – 60 minutes, down 8
- Toy Story Mania! – 52 minutes, down 3
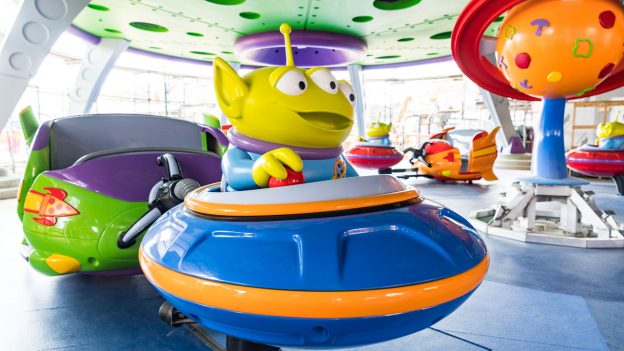
- Alien Swirling Saucers – 42 minutes, down 2
- Star Tours – The Adventures Continue! – 30 minutes, down 5
- Lightning McQueen’s Racing Academy – 11 minutes, down 2
- Muppet*Vision 3D – 10 minutes, down 5
Overall, at Hollywood Studios, you would have averaged a 49-minute wait in line for the various attractions. That’s only down two minutes from the last week of July.
So, this park only marginally improved, compared to Animal Kingdom, which got a LOT better.
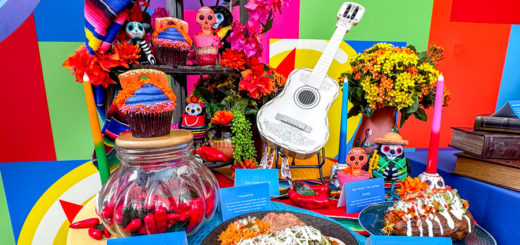
EPCOT
How about the author’s favorite park, EPCOT? Well, we know which ride to check first.
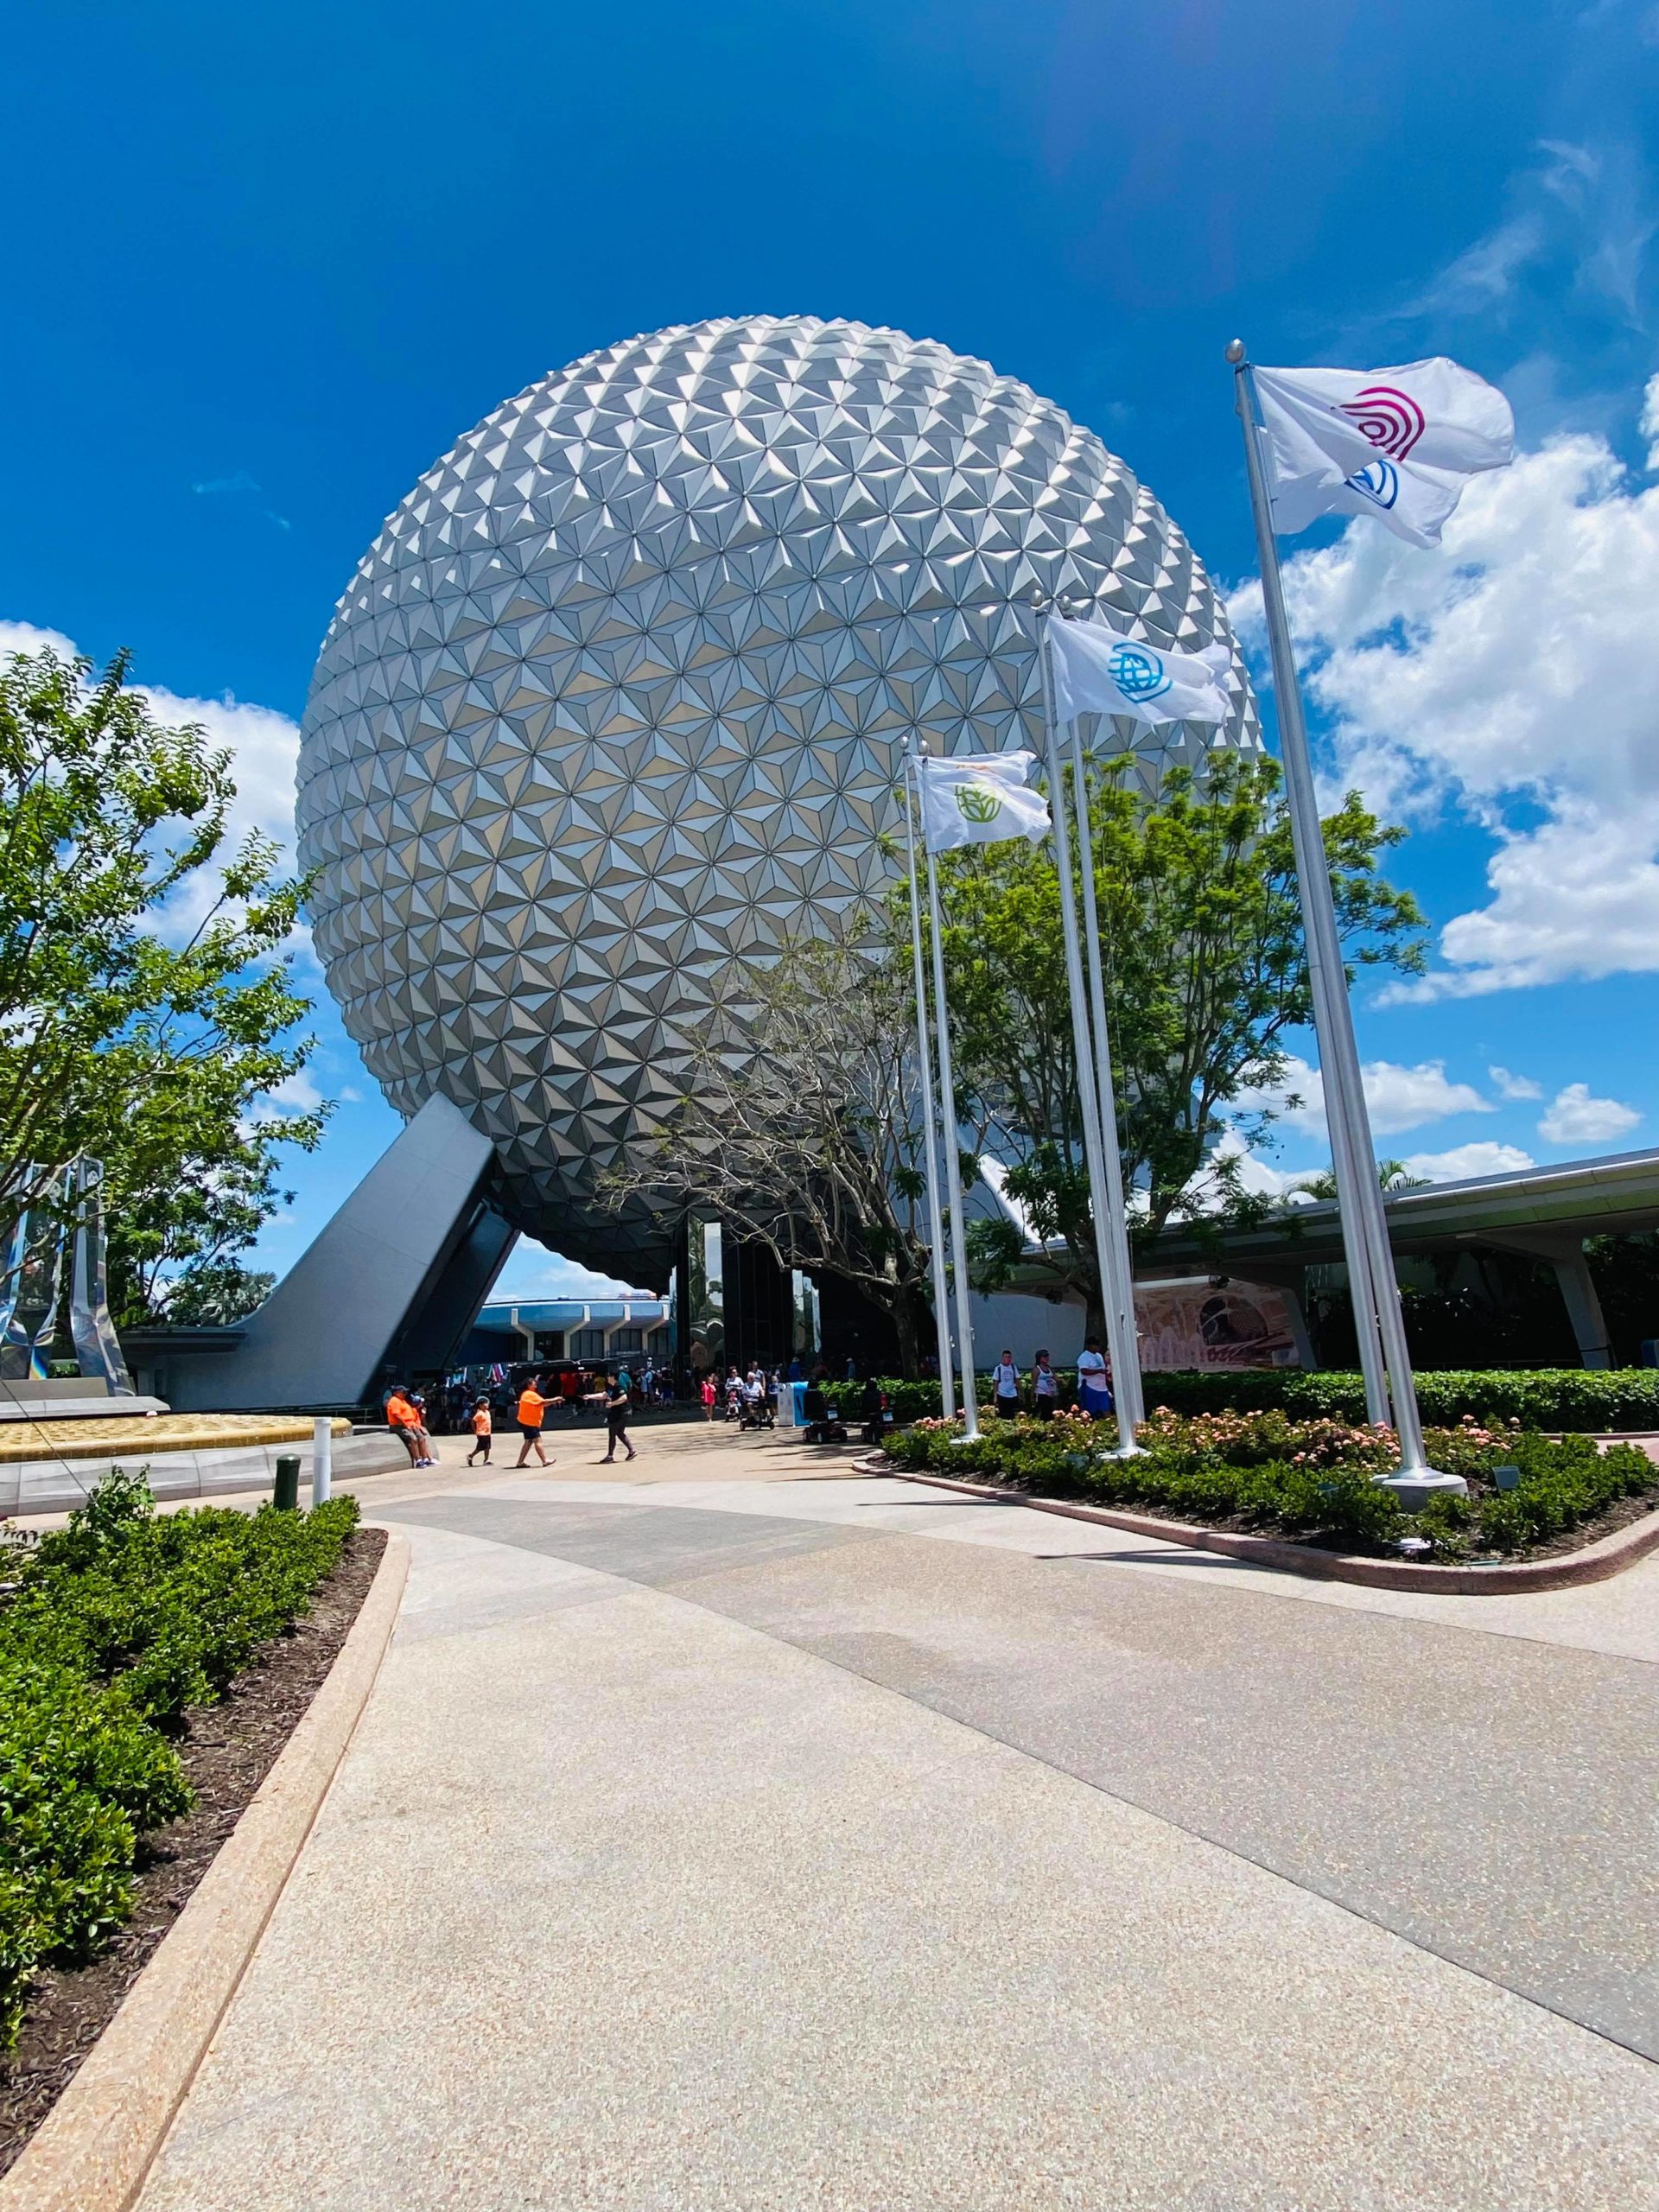
Test Track came with a 73-minute wait, which is down a modest five minutes.
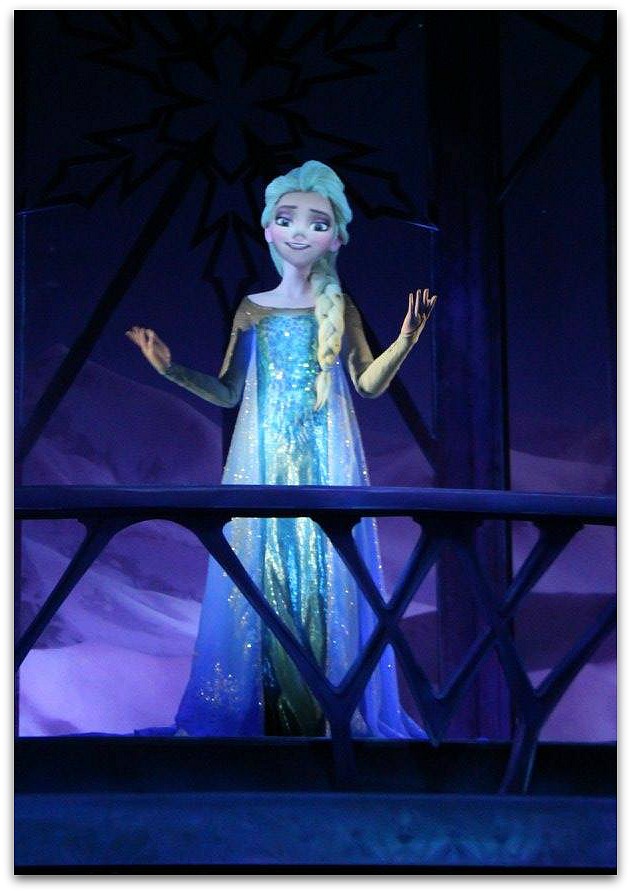
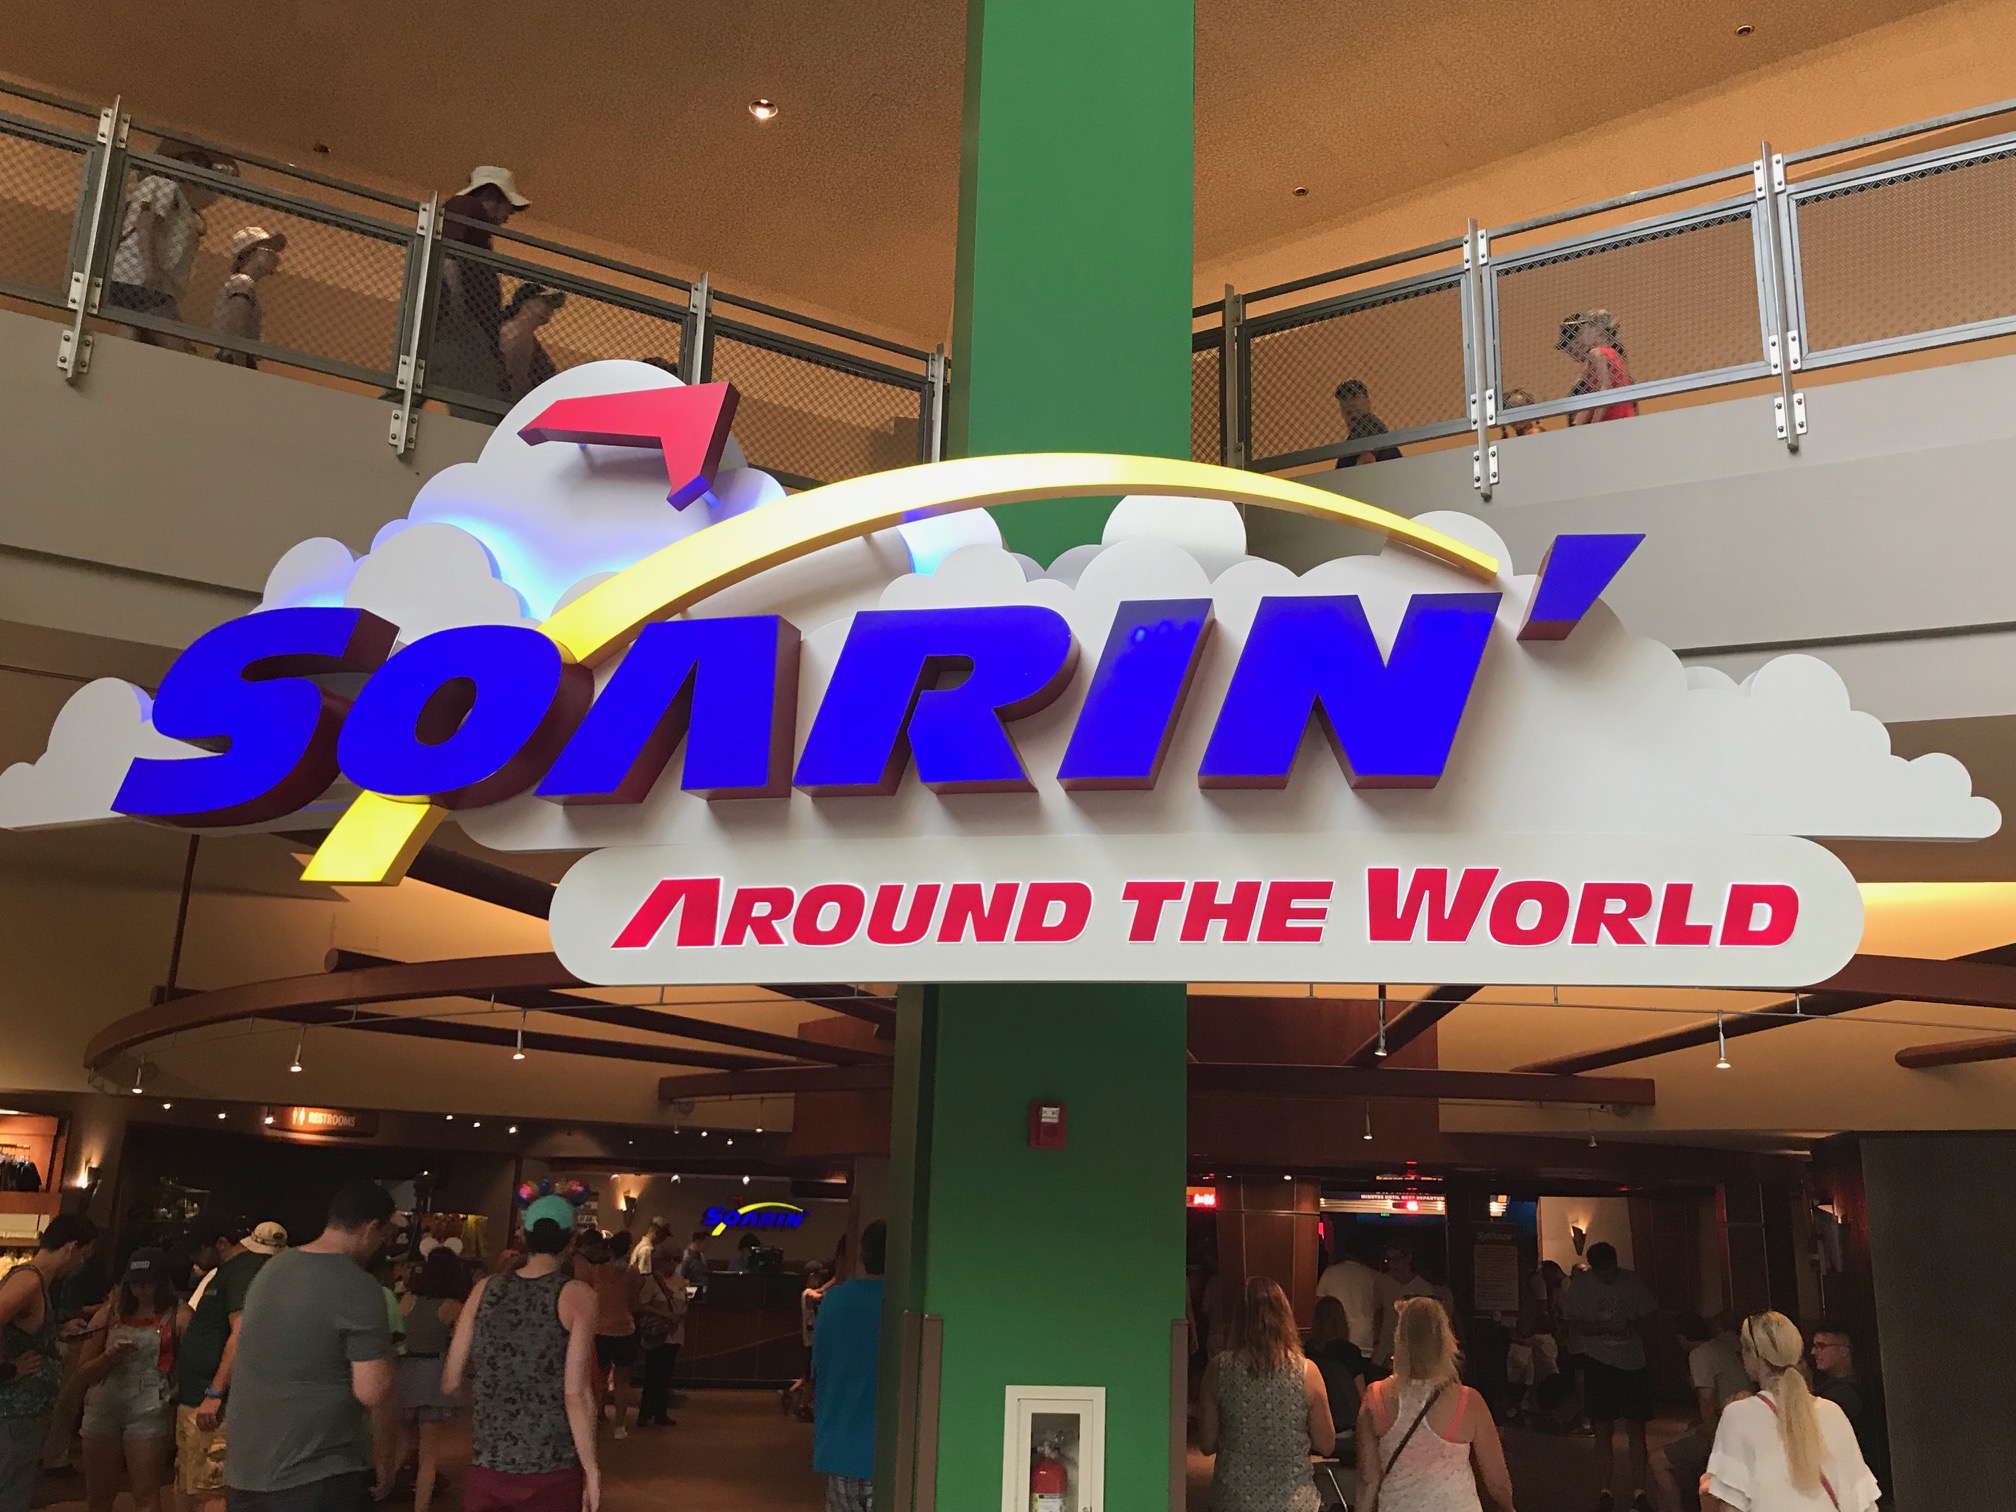
The rest of the Big Three includes Frozen Ever After and Soarin’. The pride of the Norway pavilion averaged 50 minutes, down eight from previously.
Guests who went Soarin’ had a grand ole time, as it only required 29 minutes in line, down nine.
In fact, Mission: SPACE took longer than Soarin’ last week. Its wait time was 31 minutes, down six.
Still, you can tell that EPCOT also improved in early August. In fact, here’s the rest of the attractions:
- Spaceship Earth – 24 minutes, down 6
- The Seas with Nemo & Friends – 16 minutes, down 7
- Gran Fiesta Tour Starring the Three Caballeros – 14 minutes, down 18
- Journey into Imagination with Figment – 11 minutes, down 7
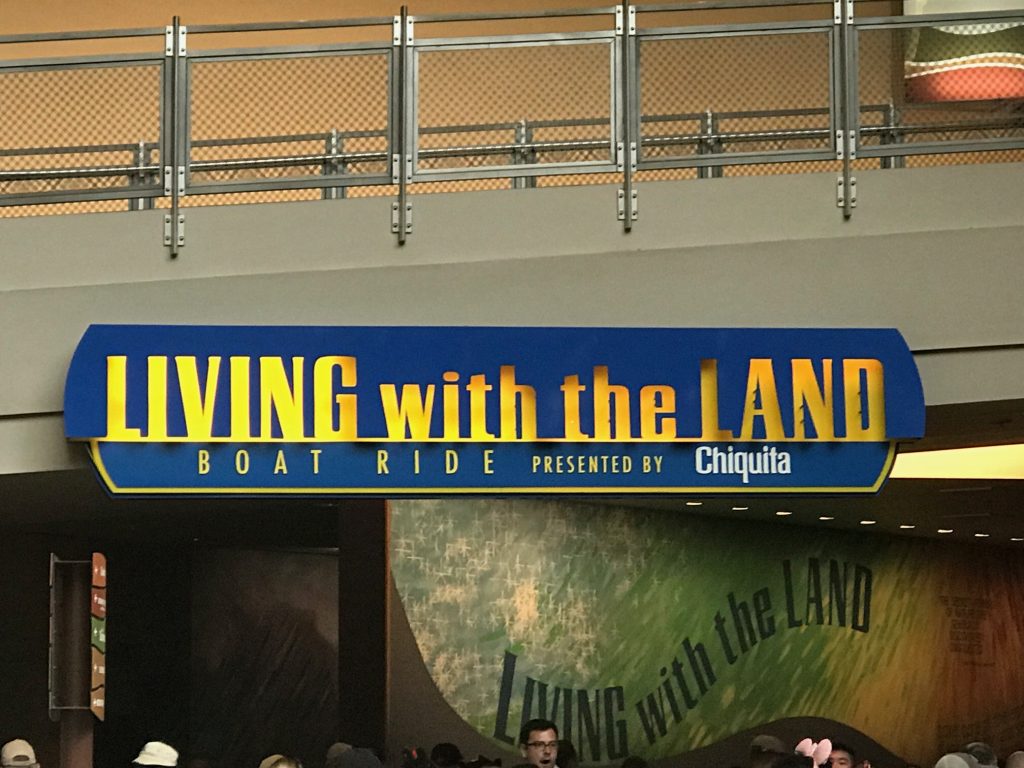
- Living with the Land – 10 minutes, down 5
There’s a huge WOW! factor with some of this data. I mean, did people forget that Gran Fiesta Tour existed?
Anyway, EPCOT obviously improved a LOT from the last week of July. In the first week of August, attractions averaged a 27-minute wait, down six minutes.
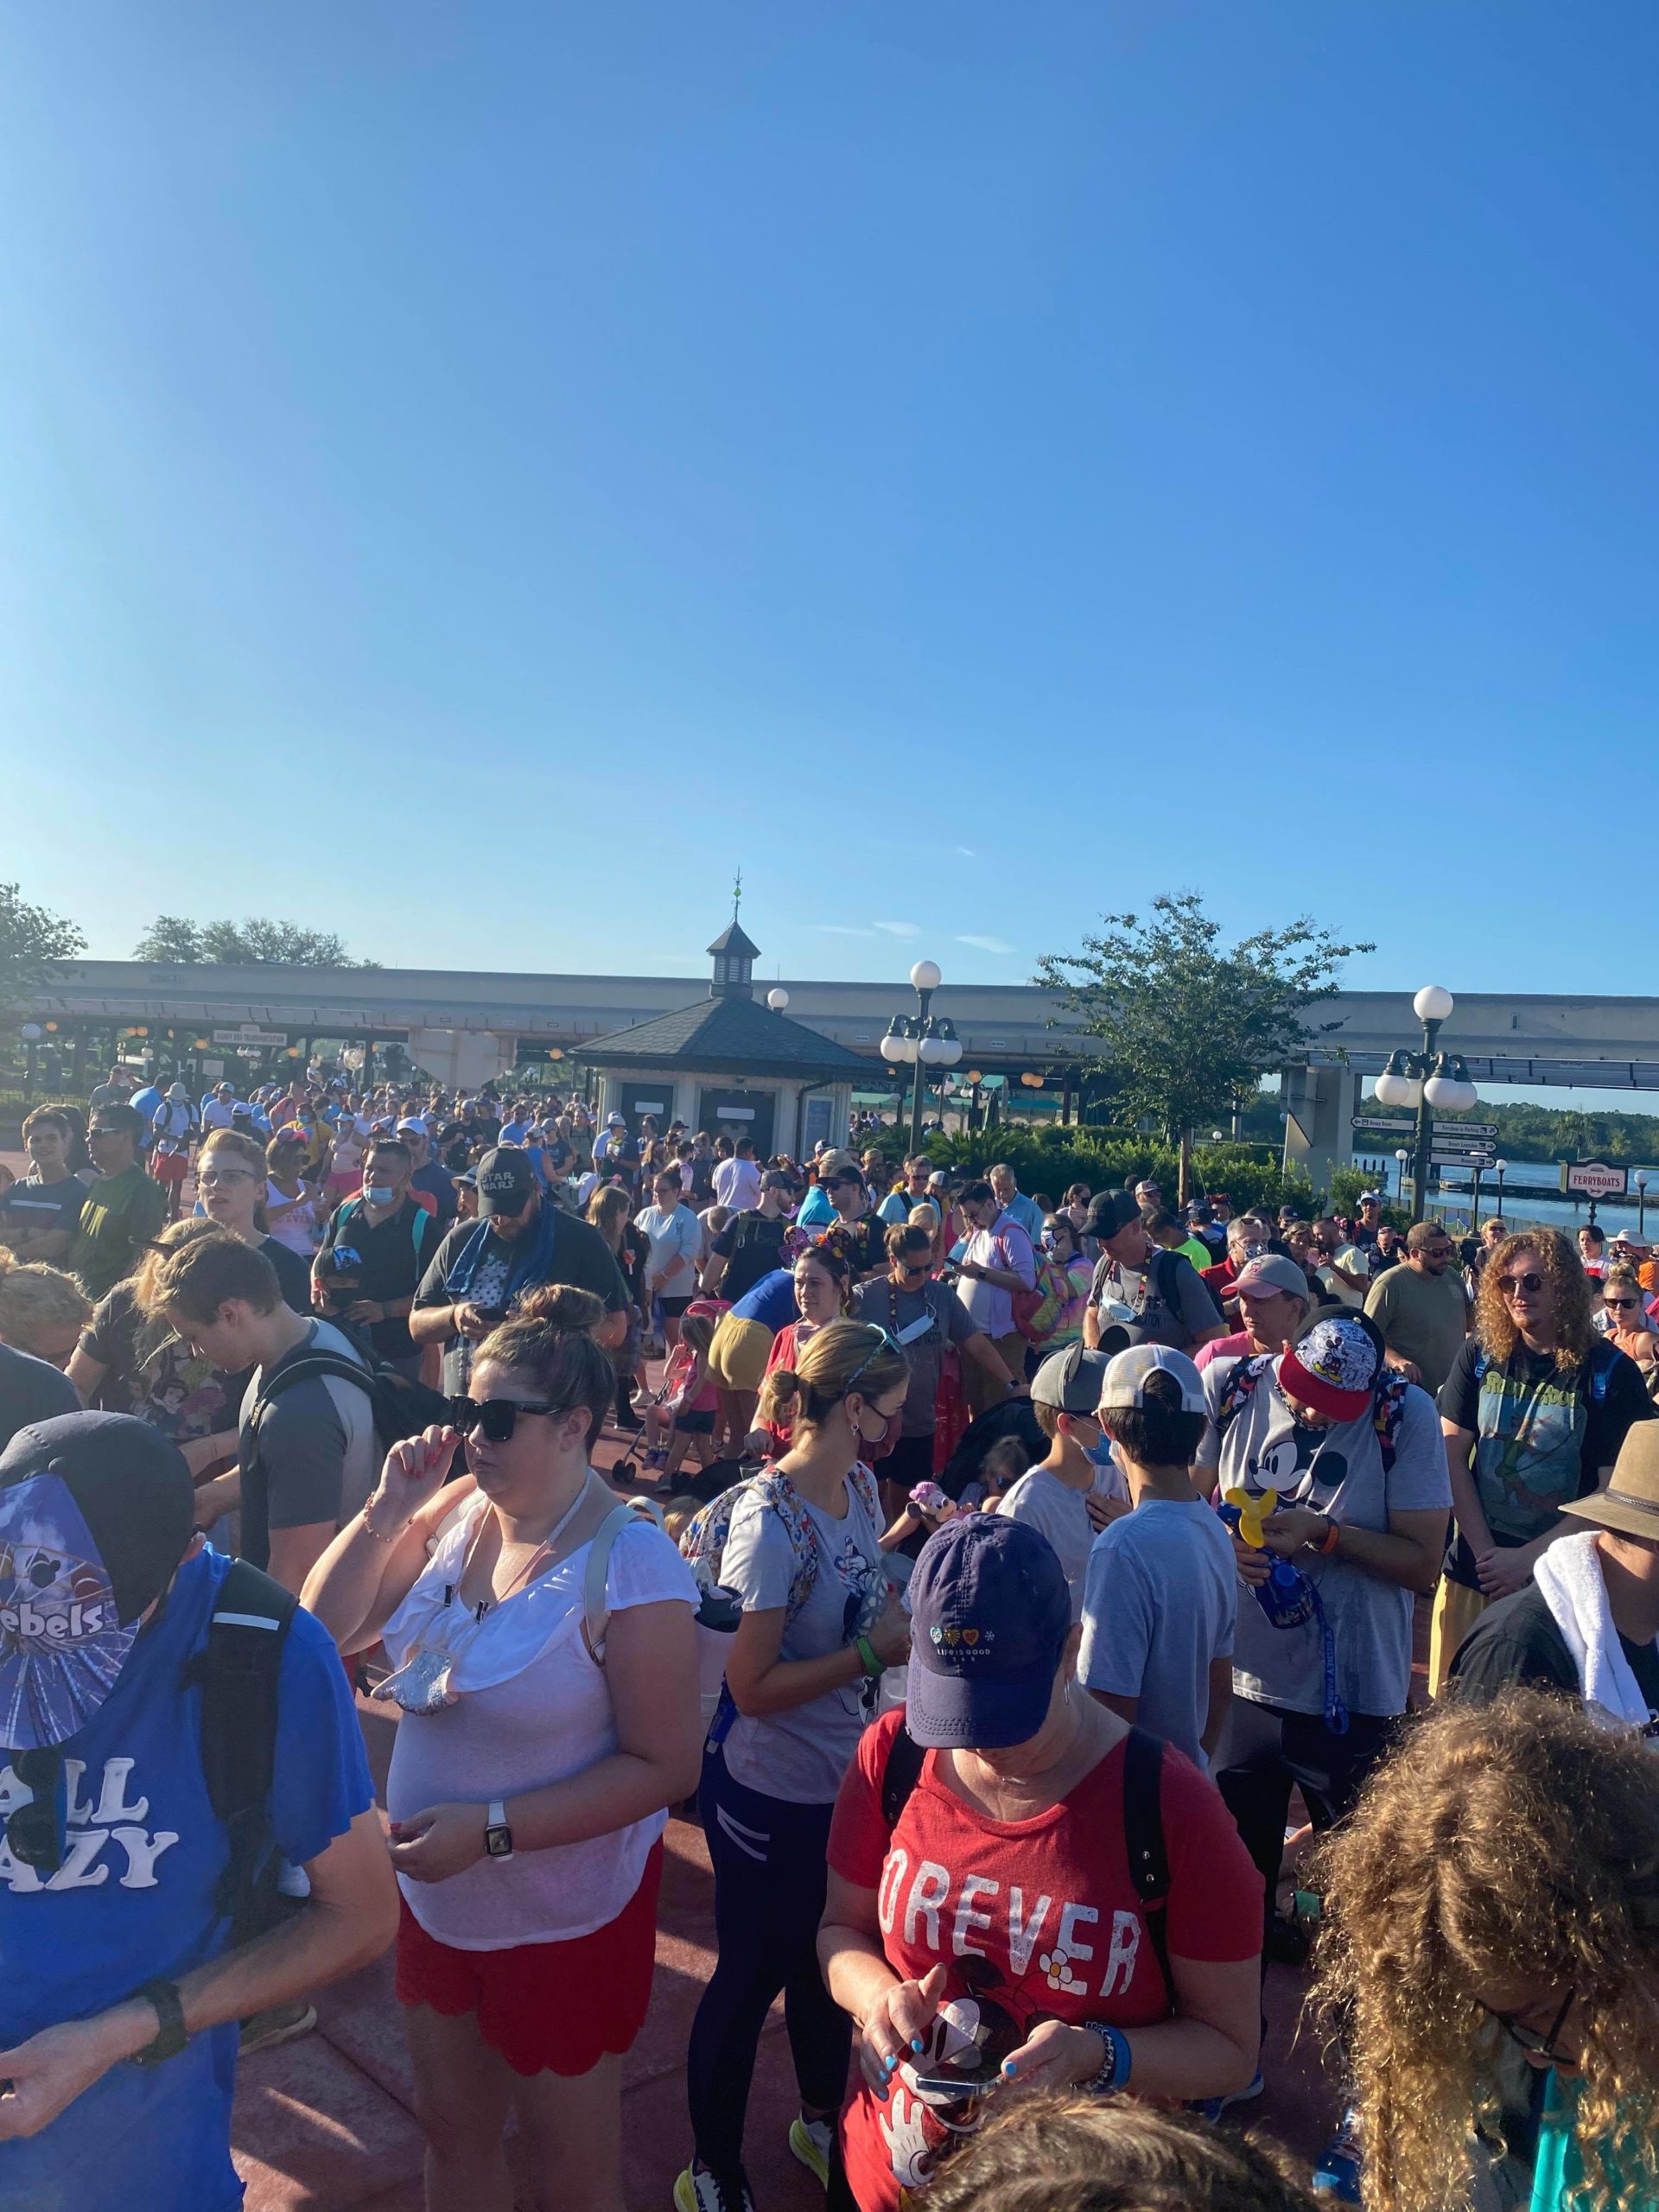
Magic Kingdom
Overall, we’re three for three on theme parks requiring less line time. Will we go a perfect four for four?
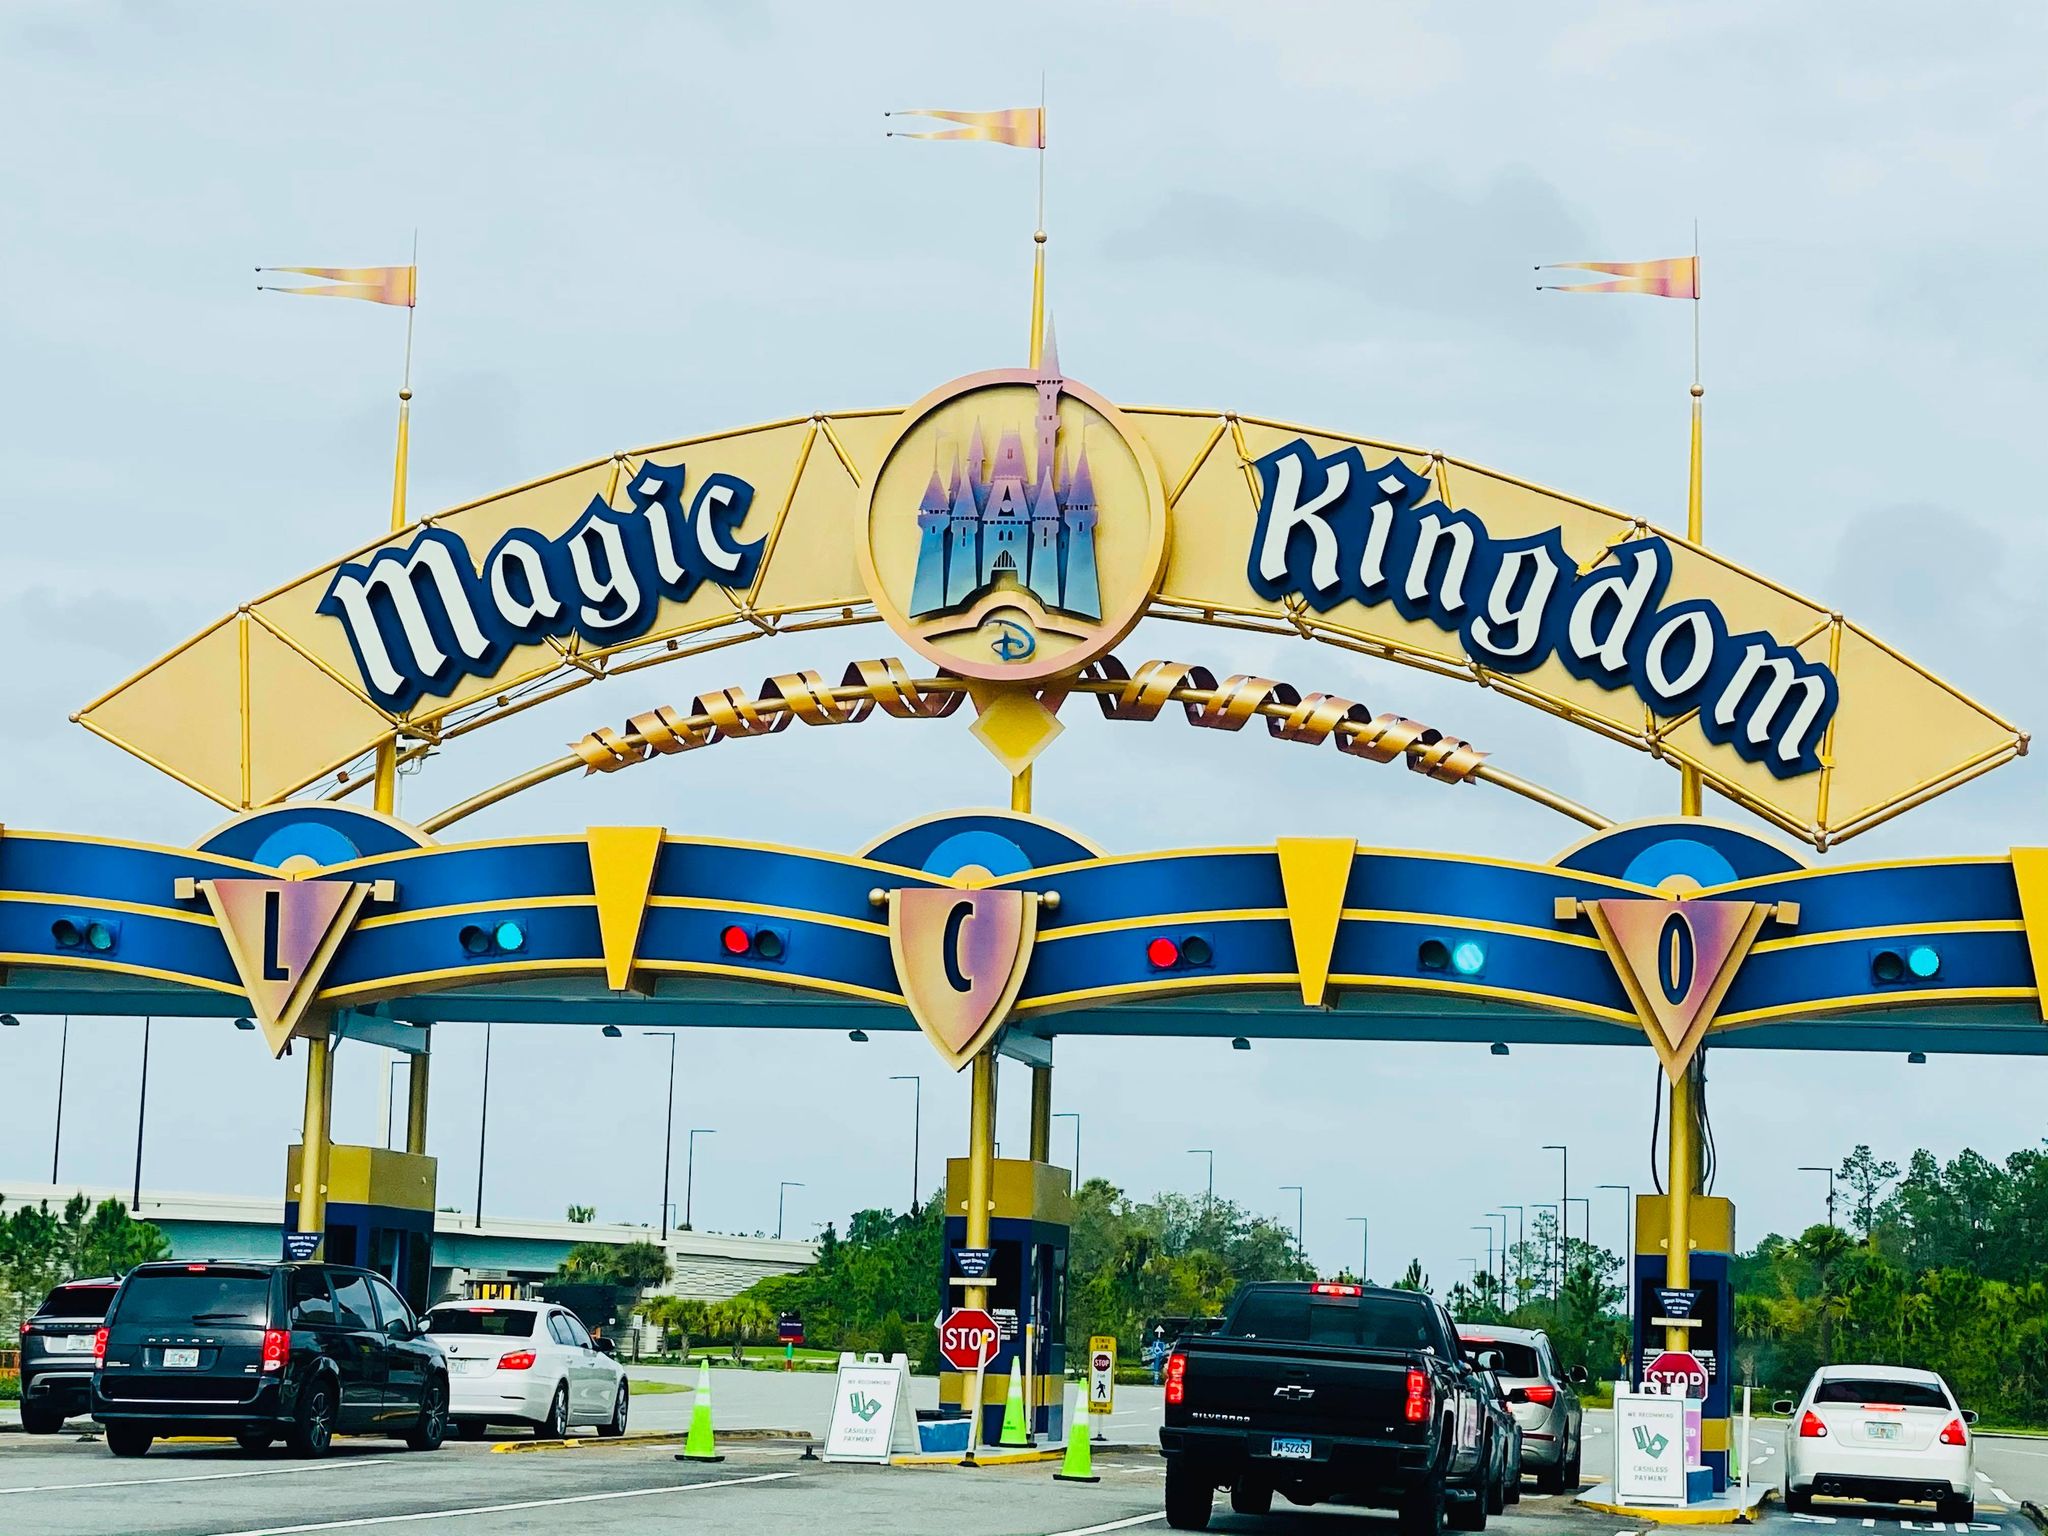
Snow White, don’t fail me now…
- Seven Dwarfs Mine Train – 94 minutes, down 3
- Jungle Cruise – 82 minutes, no change
- Splash Mountain – 81 minutes, down 4
- Space Mountain – 72 minutes, down 7
- Peter Pan’s Flight – 58 minutes, down 8
- Haunted Mansion – 55 minutes, down 10
- Astro Orbiter – 53 minutes, up 8
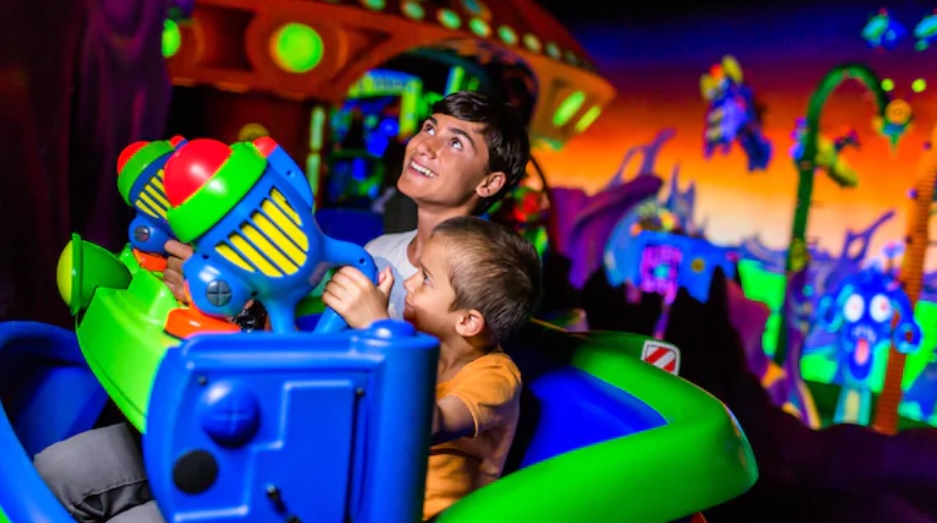
- Buzz Lightyear’s Space Ranger Spin – 47 minutes, down 8
- Pirates of the Caribbean – 46 minutes, down 14
- It’s a Small World – 44 minutes, down 3
- The Many Adventures of Winnie the Pooh – 39 minutes, down 7
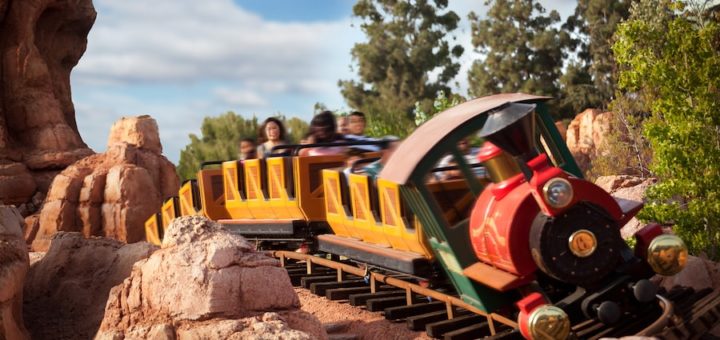
- Big Thunder Mountain Railroad – 36 minutes, down 5
- Under the Sea ~ Journey of the Little Mermaid – 36 minutes, down 8
- Tomorrowland Speedway – 33 minutes, down 2
- Dumbo the Flying Elephant – 32 minutes, down 7
- The Barnstormer – 32 minutes, no change
- The Magic Carpets of Aladdin – 30 minutes, no change
- Prince Charming Regal Carrousel – 26 minutes, down 2
- Mickey’s PhilharMagic – 26 minutes, no change
- Tomorrowland Transit Authority PeopleMover – 22 minutes, no change
- Mad Tea Party – 20 minutes, no change
- Walt Disney’s Carousel of Progress – 7 minutes, no change
- Country Bear Jamboree – 4 minutes, down 3
At Magic Kingdom, you had to wait an average of 43 minutes, down five minutes. That’s still a lot for that park, though.
Overall, only TWO Walt Disney World attractions experienced average wait time increases during the first week of August.
The overwhelming majority of rides trended down either a little or a lot.
So, we’re heading in the right direction as we move closer to the start of the school year.