Wait Times for the Last Week of June 2021
The week before July 4th is often one of the busiest at Disney theme parks. As a result, some guests take prolonged vacations to relax.
Did that trend continue this past week? Let’s take a look! Here are the wait times for the last week of June for 2021.
Disney’s Animal Kingdom
Okay, I won’t sugarcoat it. You’re about to notice a spike. In fact, you might get a nosebleed from the mountainous climb.
I’m referencing Avatar Flight of Passage, which soared from 71 to 92 minutes. Even by pre-pandemic standards, that total remains on the high end.

Photo Credit: UndercoverTourist.com
During the first year, the E-ticket attraction at Pandora – The World of Avatar required even longer waits. Still, 90-minute waits are blessedly rare at Walt Disney World.
Thankfully, the other rides weren’t as far out of whack. People simply love Avatar Flight of Passage.

The other Pandora attraction, Na’Vi River Journey, came with a 46-minute wait, up five minutes from last time.
Meanwhile, Expedition Everest also increased its wait time significantly, upping the time from 28 to 38 minutes.
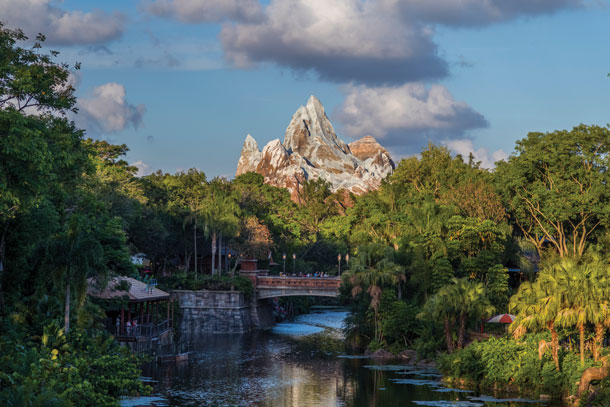
Photo: Disney
This one surprised me, as Disney recently brought back Single Rider. Maximum occupancy on the ride should have reduced the time spent in line. But it didn’t.
Here are the other average waits at Animal Kingdom last week:
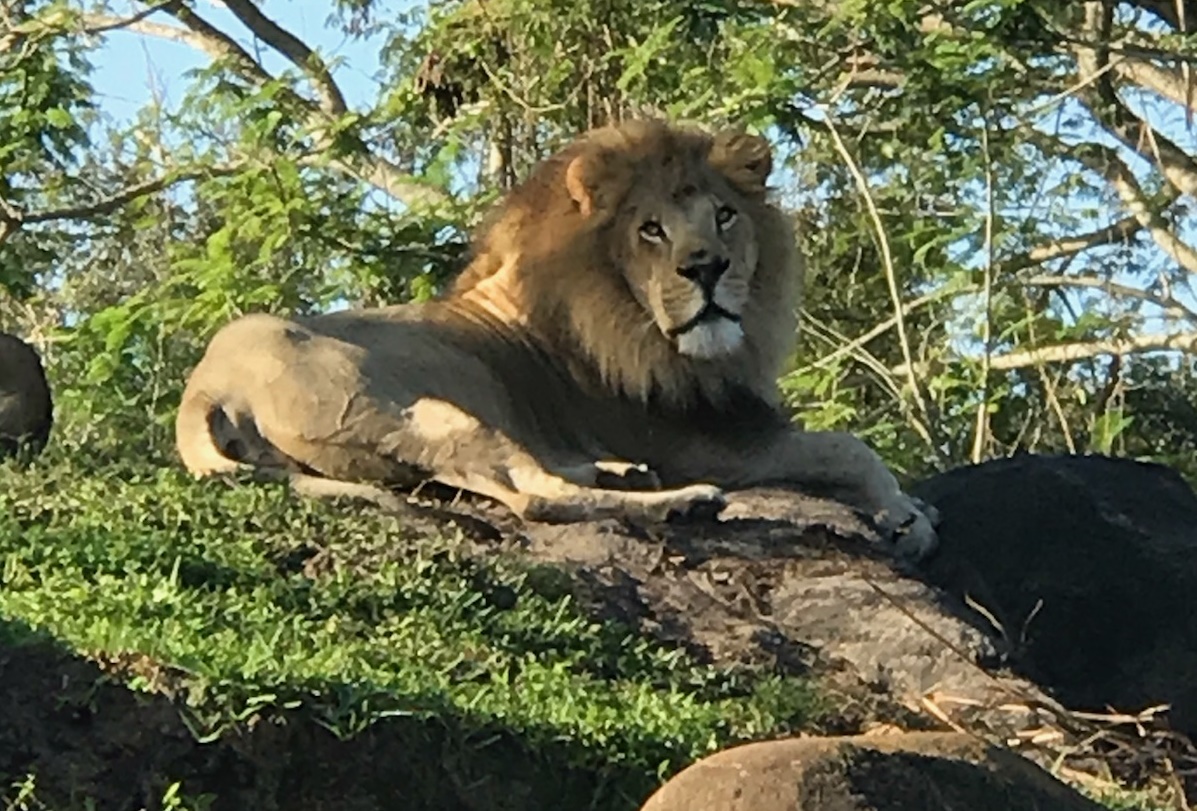
- Kali River Rapids — 36 minutes, no change
- Kilimanjaro Safaris – 36 minutes, up 8
- DINOSAUR – 25 minutes, up 7
- It’s Tough to Be a Bug! – 13 minutes, up 3
- TriceraTop Spin – 8 minutes, up 2
So, nothing at Animal Kingdom went down last week, while most wait times increased, some by a lot.
The average ride required a 38-minute wait, waaaaaaay up from 28 minutes last week. You can tell it’s the heart of summer now, can’t you?
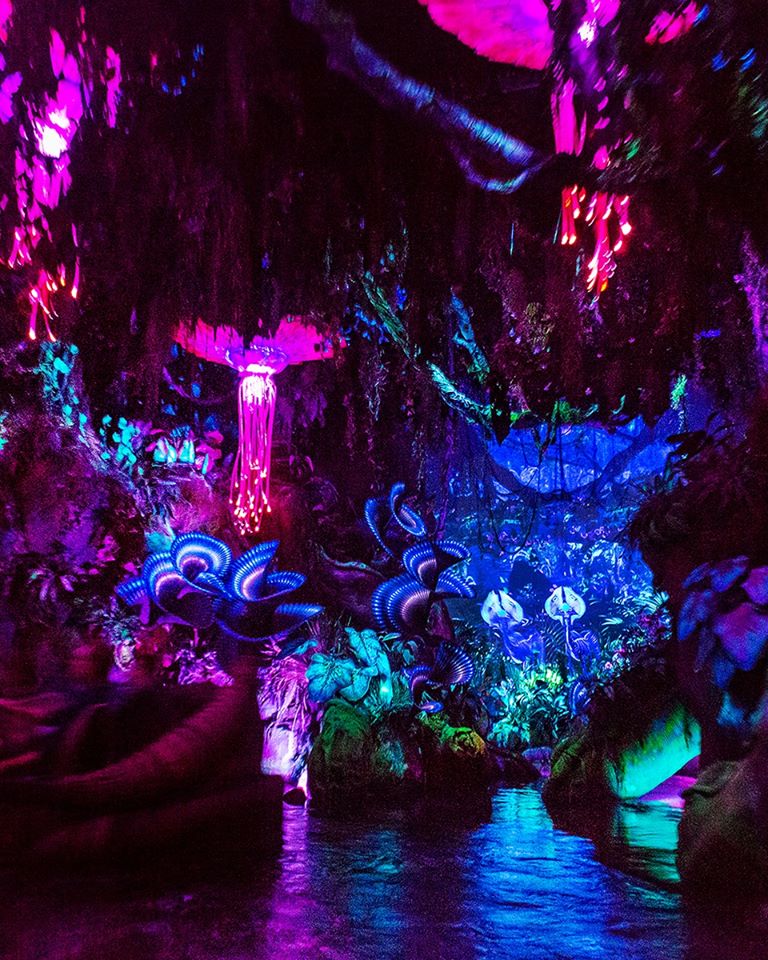
Photo Credit: The Verge via Facebook
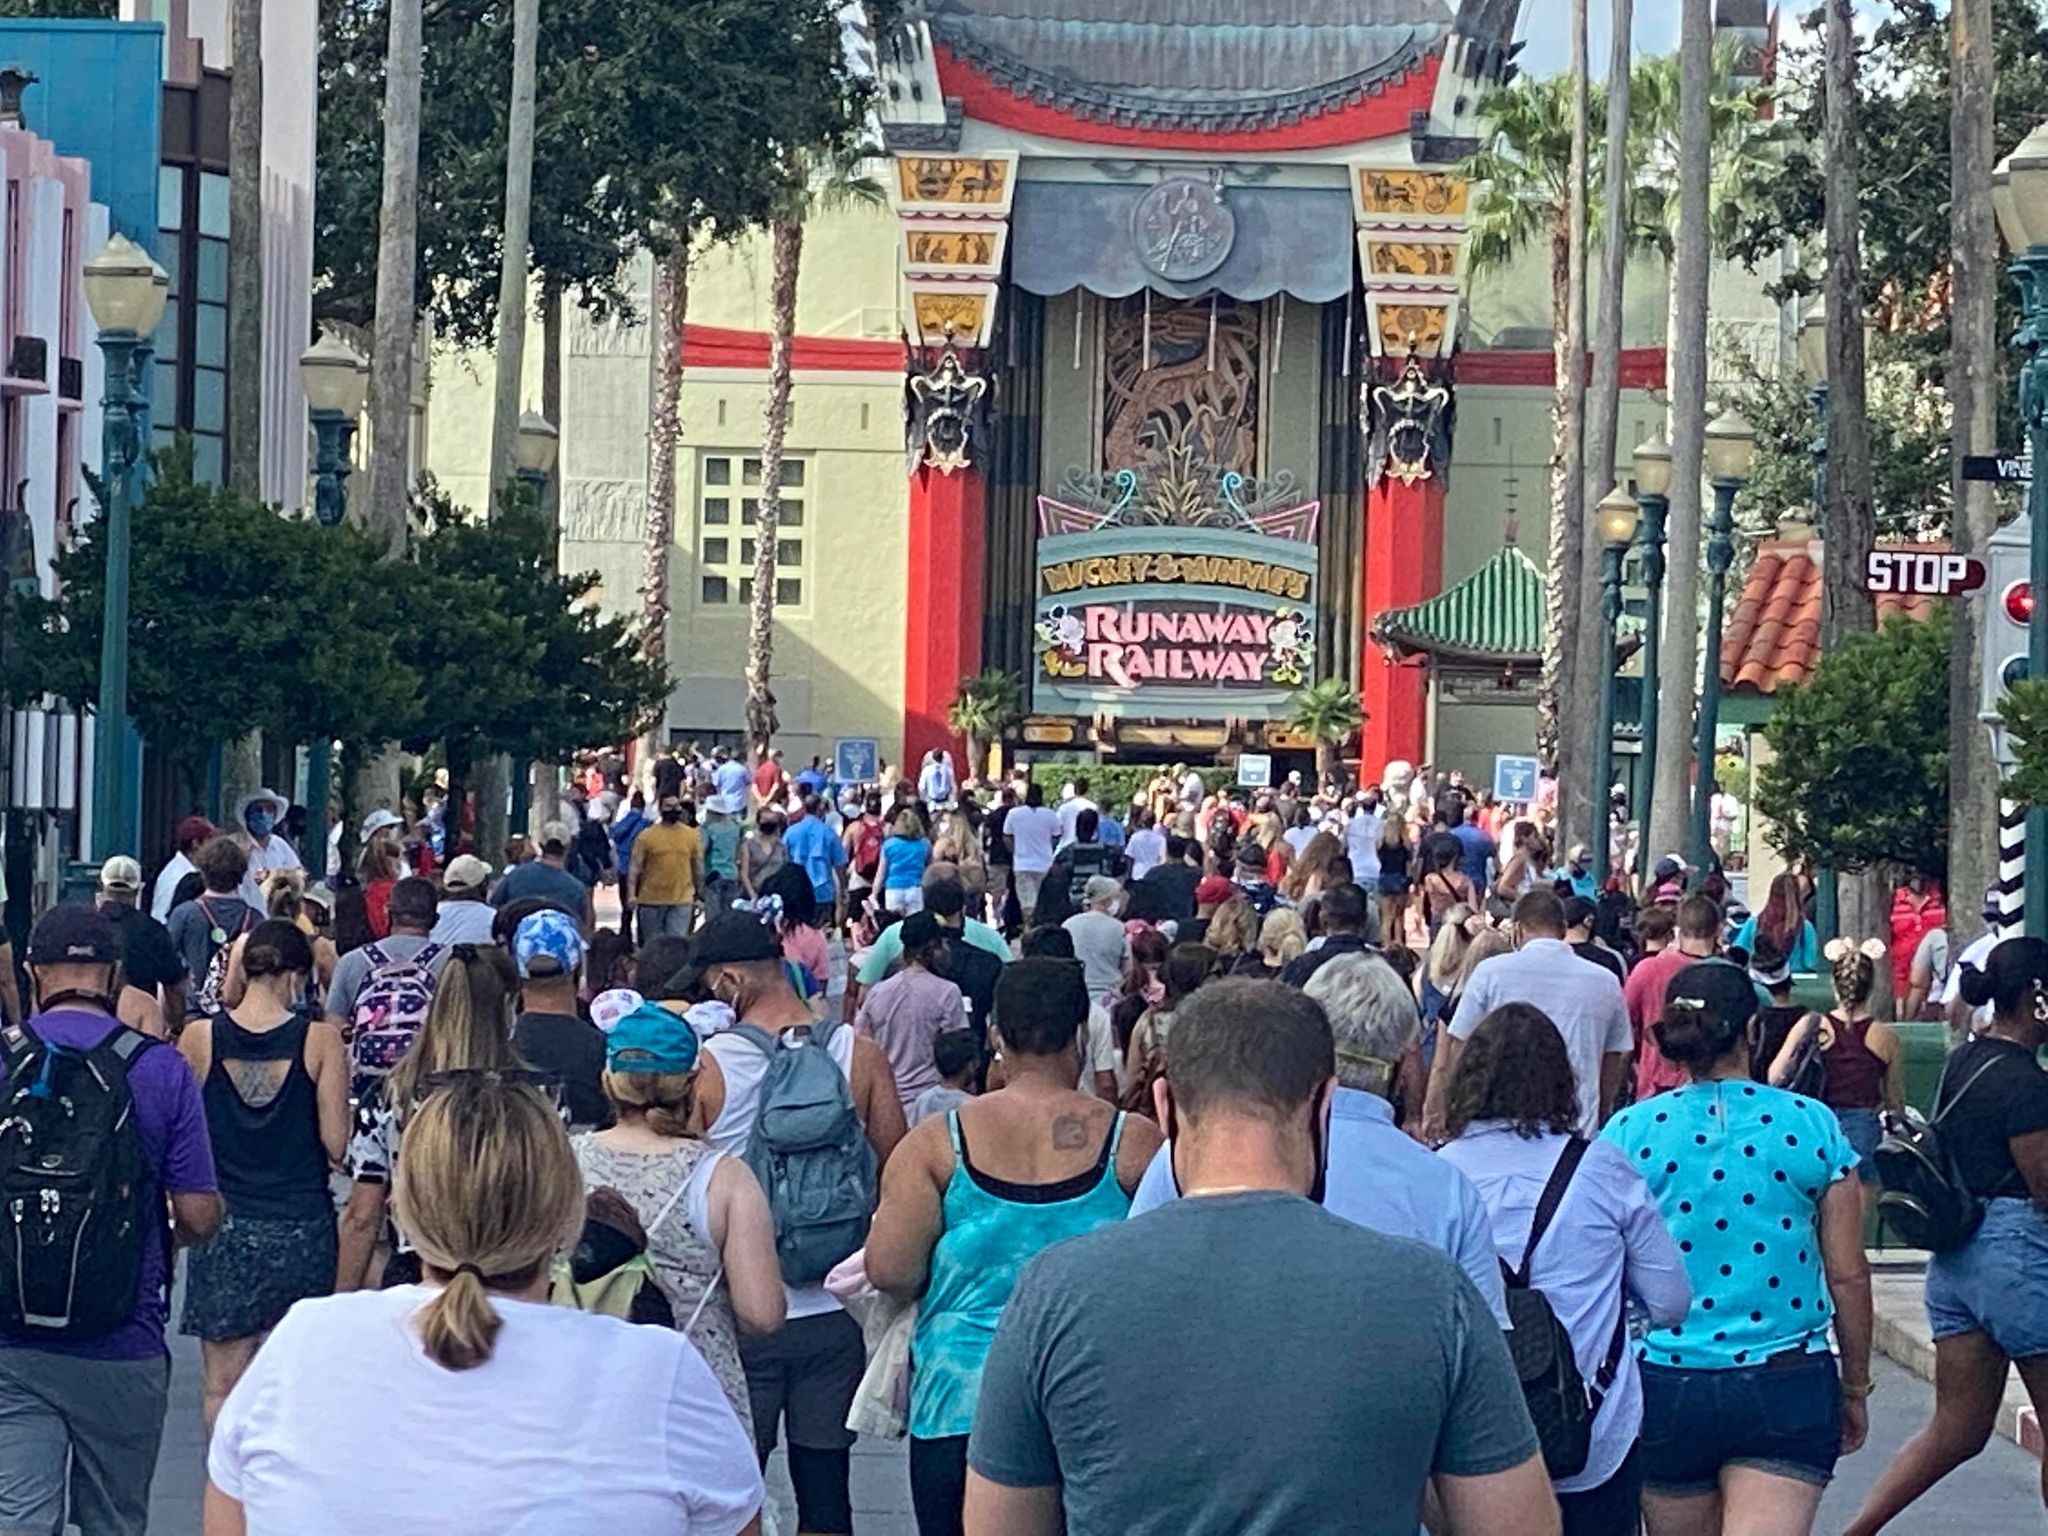
Disney’s Hollywood Studios
The trend continues at Hollywood Studios, where most lines got longer.
Please remember that we’re witnessing two different factors here. One stems from summer vacation for students.
The other involves evolving park capacities as the pandemic wanes. For example, Disney allows more guests into the parks but hasn’t brought back FastPasses yet.
So, the crowds will go up until Disney introduces some form of digital queuing. Until then, what we’re seeing is the expected behavior.
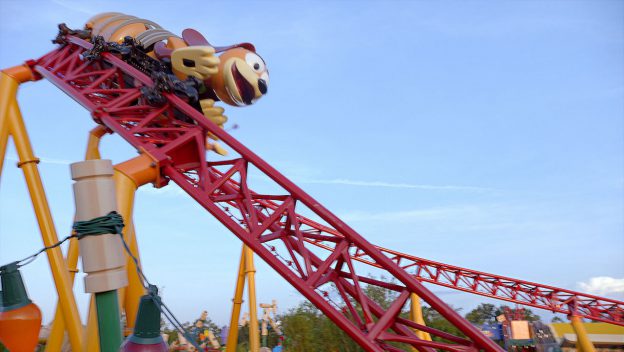
Image Credit: Disney
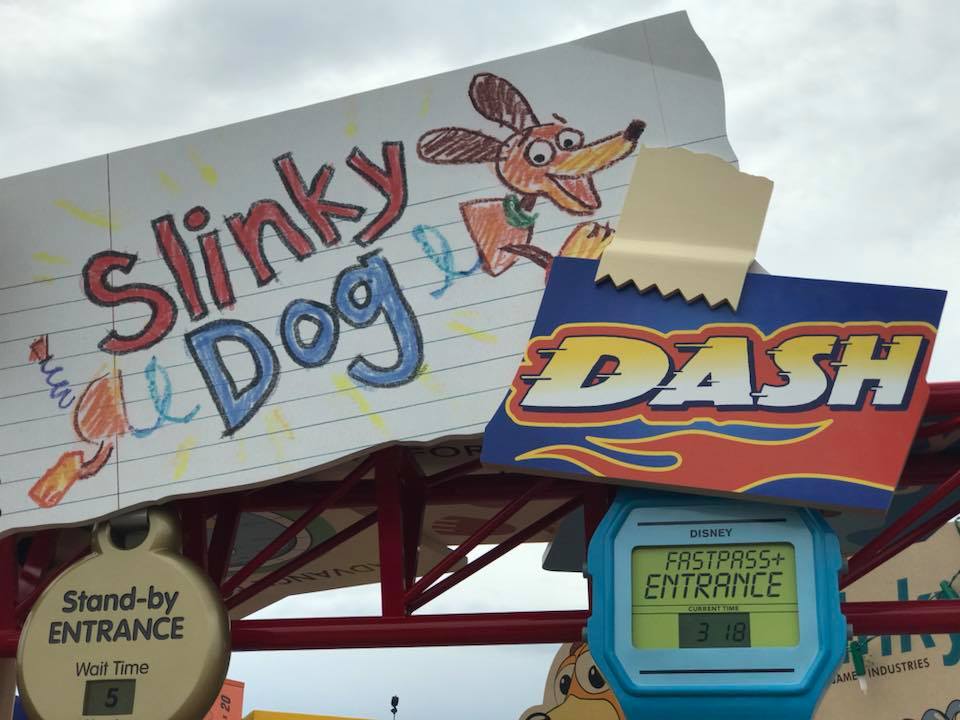
Still, the news wasn’t universally positive. Remember how I just said that 90-minute waits are rare? Well, that’s what happened with Slinky Dog Dash.
Thankfully, Walt Disney World rarely operates two rides with such lengthy wait times. But, unfortunately, we’ll notice this behavior for roughly four more weeks before crowds die down some.
Otherwise, everything was relatively reasonable at Hollywood Studios. Here are the average wait times:
- Millennium Falcon: Smugglers Run – 63 minutes, up 8
- Rock ‘n’ Roller Coaster Starring Aerosmith – 58 minutes, up 6
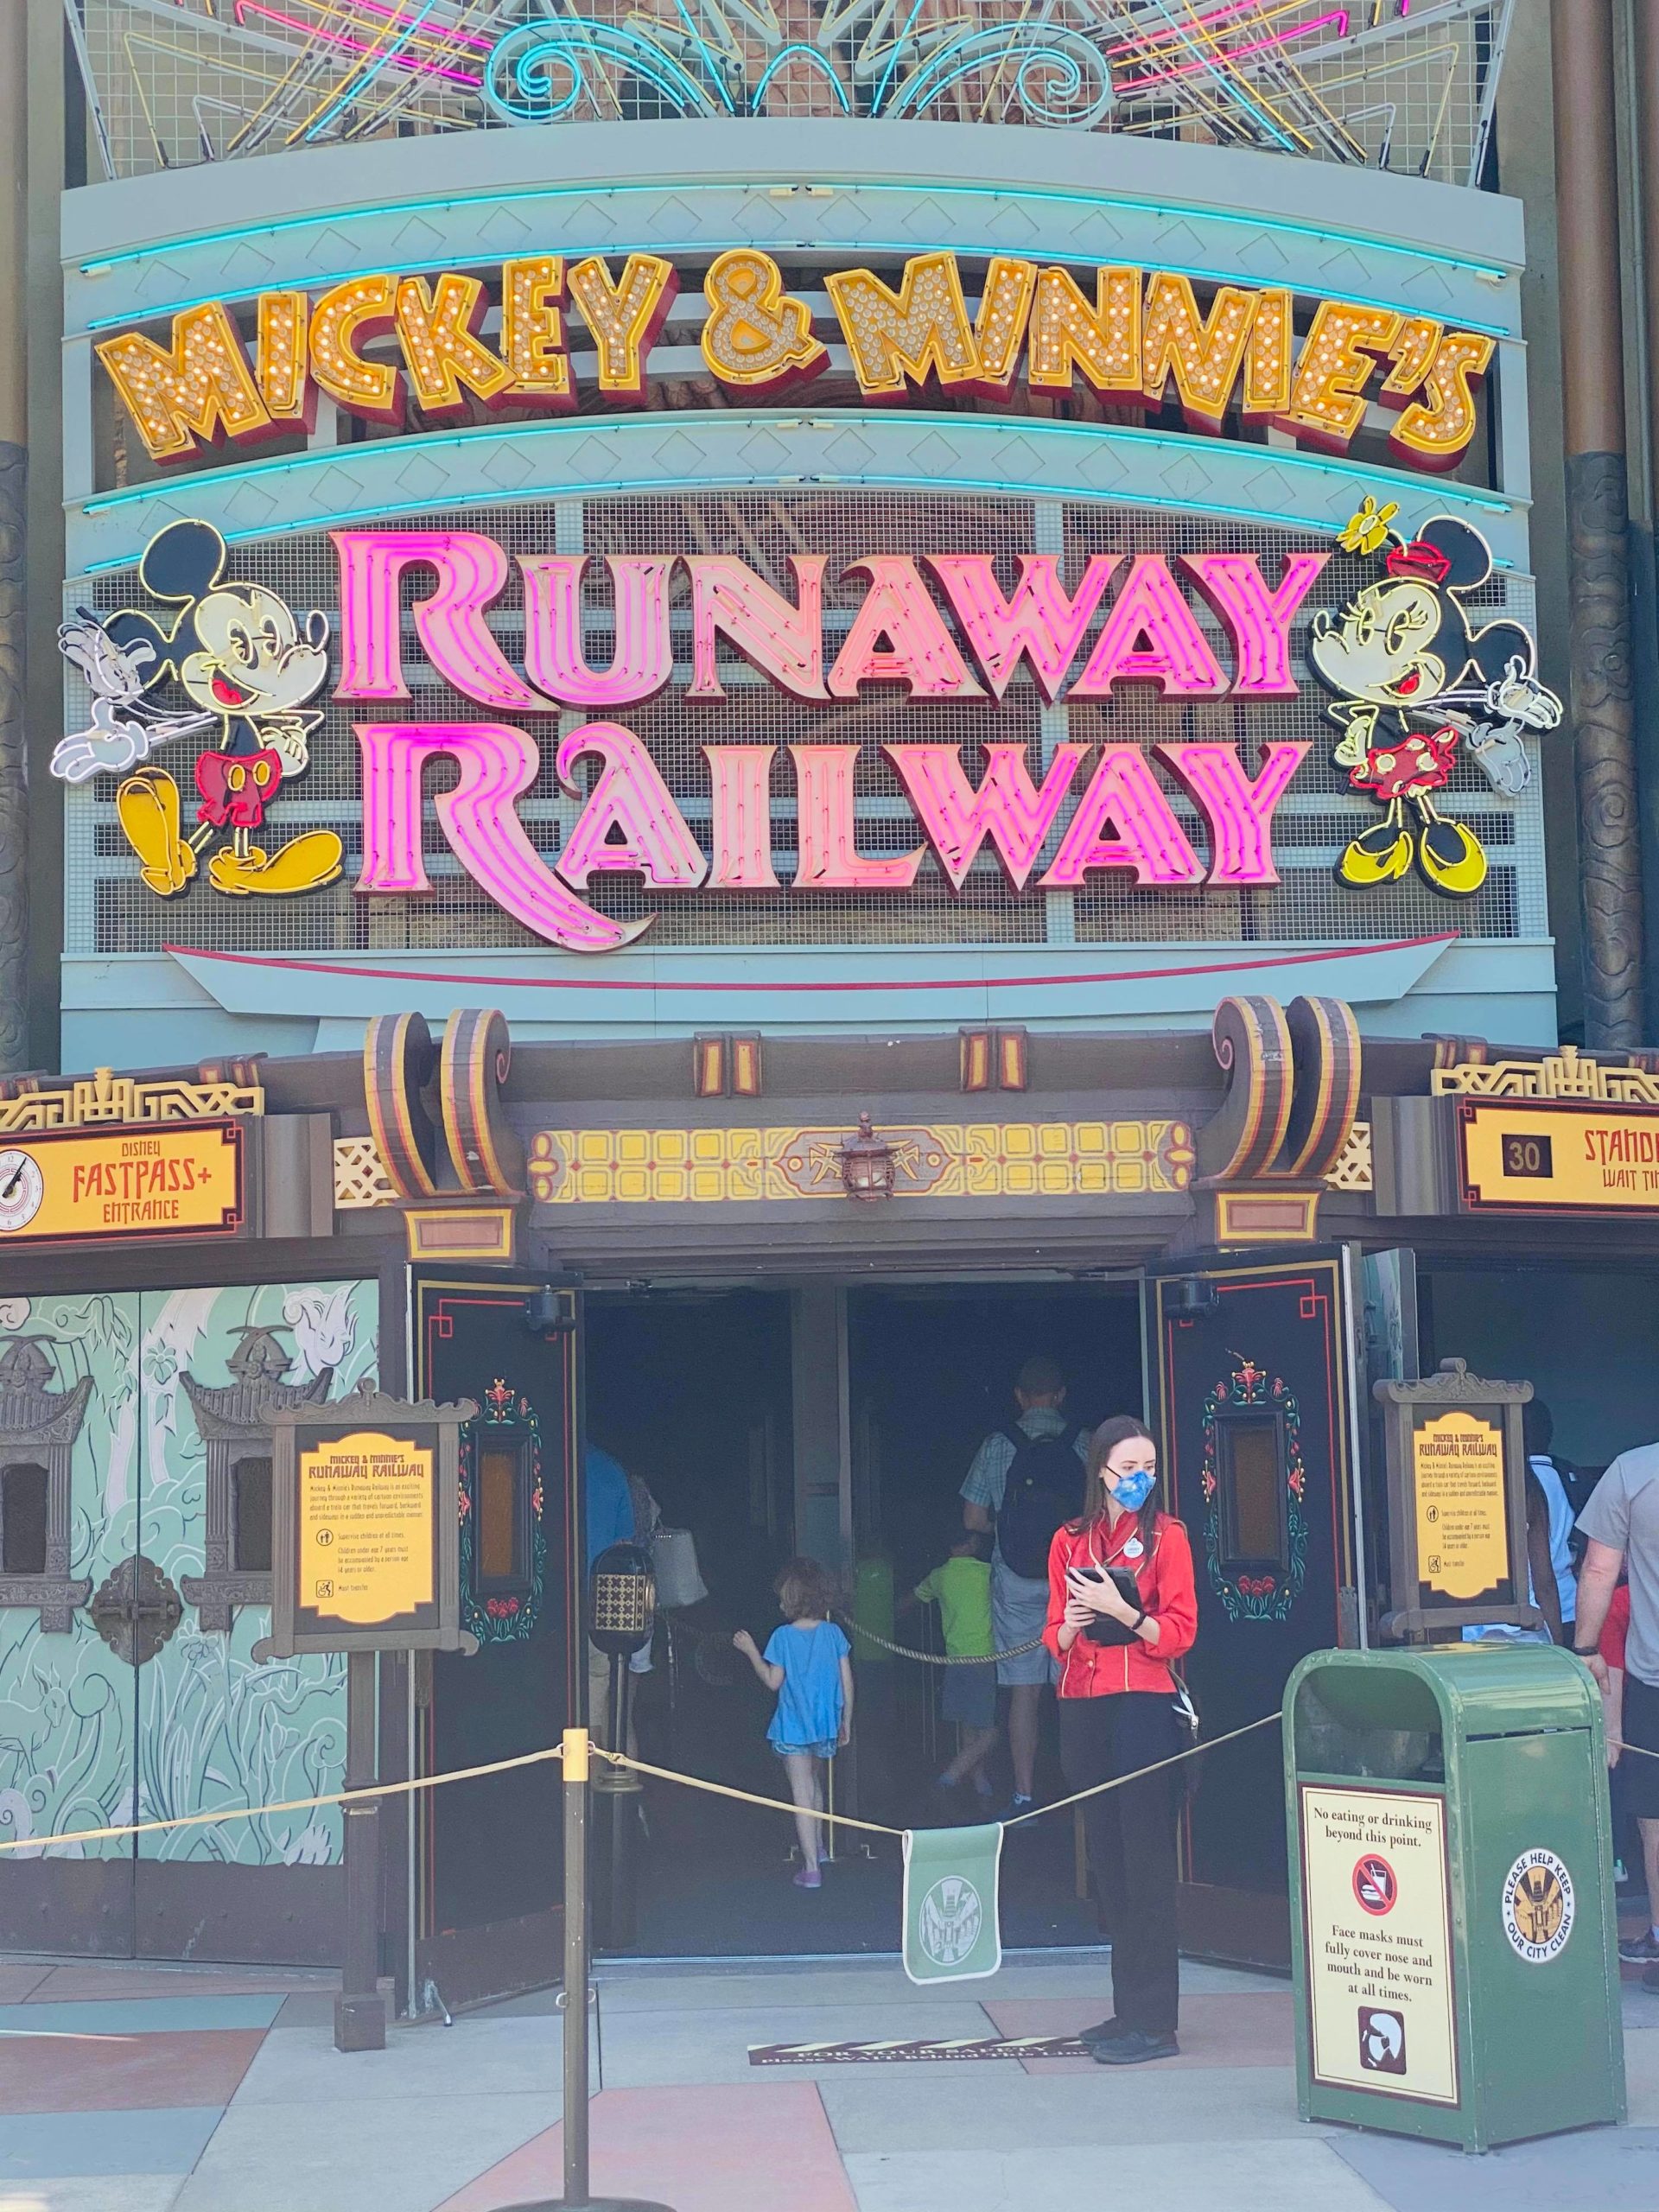
- Mickey & Minnie’s Runaway Railway – 55 minutes, up 5
- Twilight Zone Tower of Terror – 50 minutes, up 16
- Toy Story Mania! – 48 minutes, up 8
- Alien Swirling Saucers – 33 minutes, up 5
- Star Tours – The Adventures Continue – 21 minutes, up 5
- Muppet*Vision 3D – 12 minutes, no change
- Lightning McQueen’s Racing Academy – 10 minutes, down 5
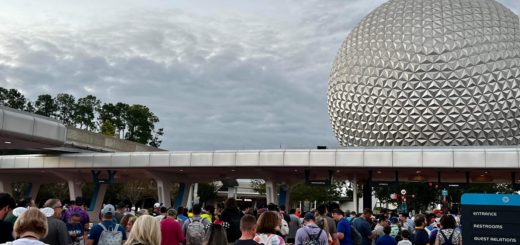
EPCOT
Okay, the Walt Disney World news improves from here. The average wait time at EPCOT actually went down from 32 to 29 minutes.
That’s the win we needed after the first two parks. As usual, Test Track led the charge with a 69-minute wait, down six minutes from last week.
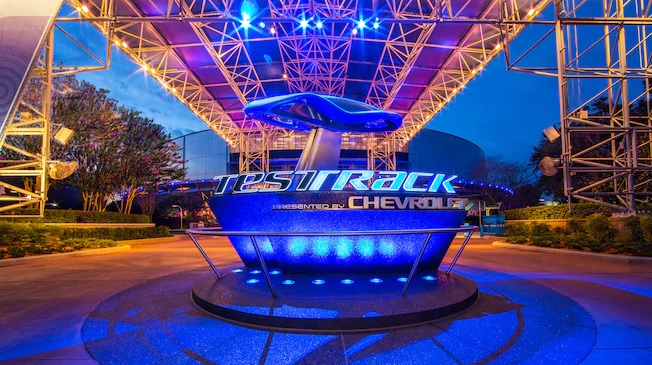
Photo: Disney
In an unexpected twist, Frozen Ever After and Soarin’ decreased their wait times last week.
Frozen dropped from 55 minutes to 45 minutes, while Soarin’ fell even more from 48 to 38 minutes.
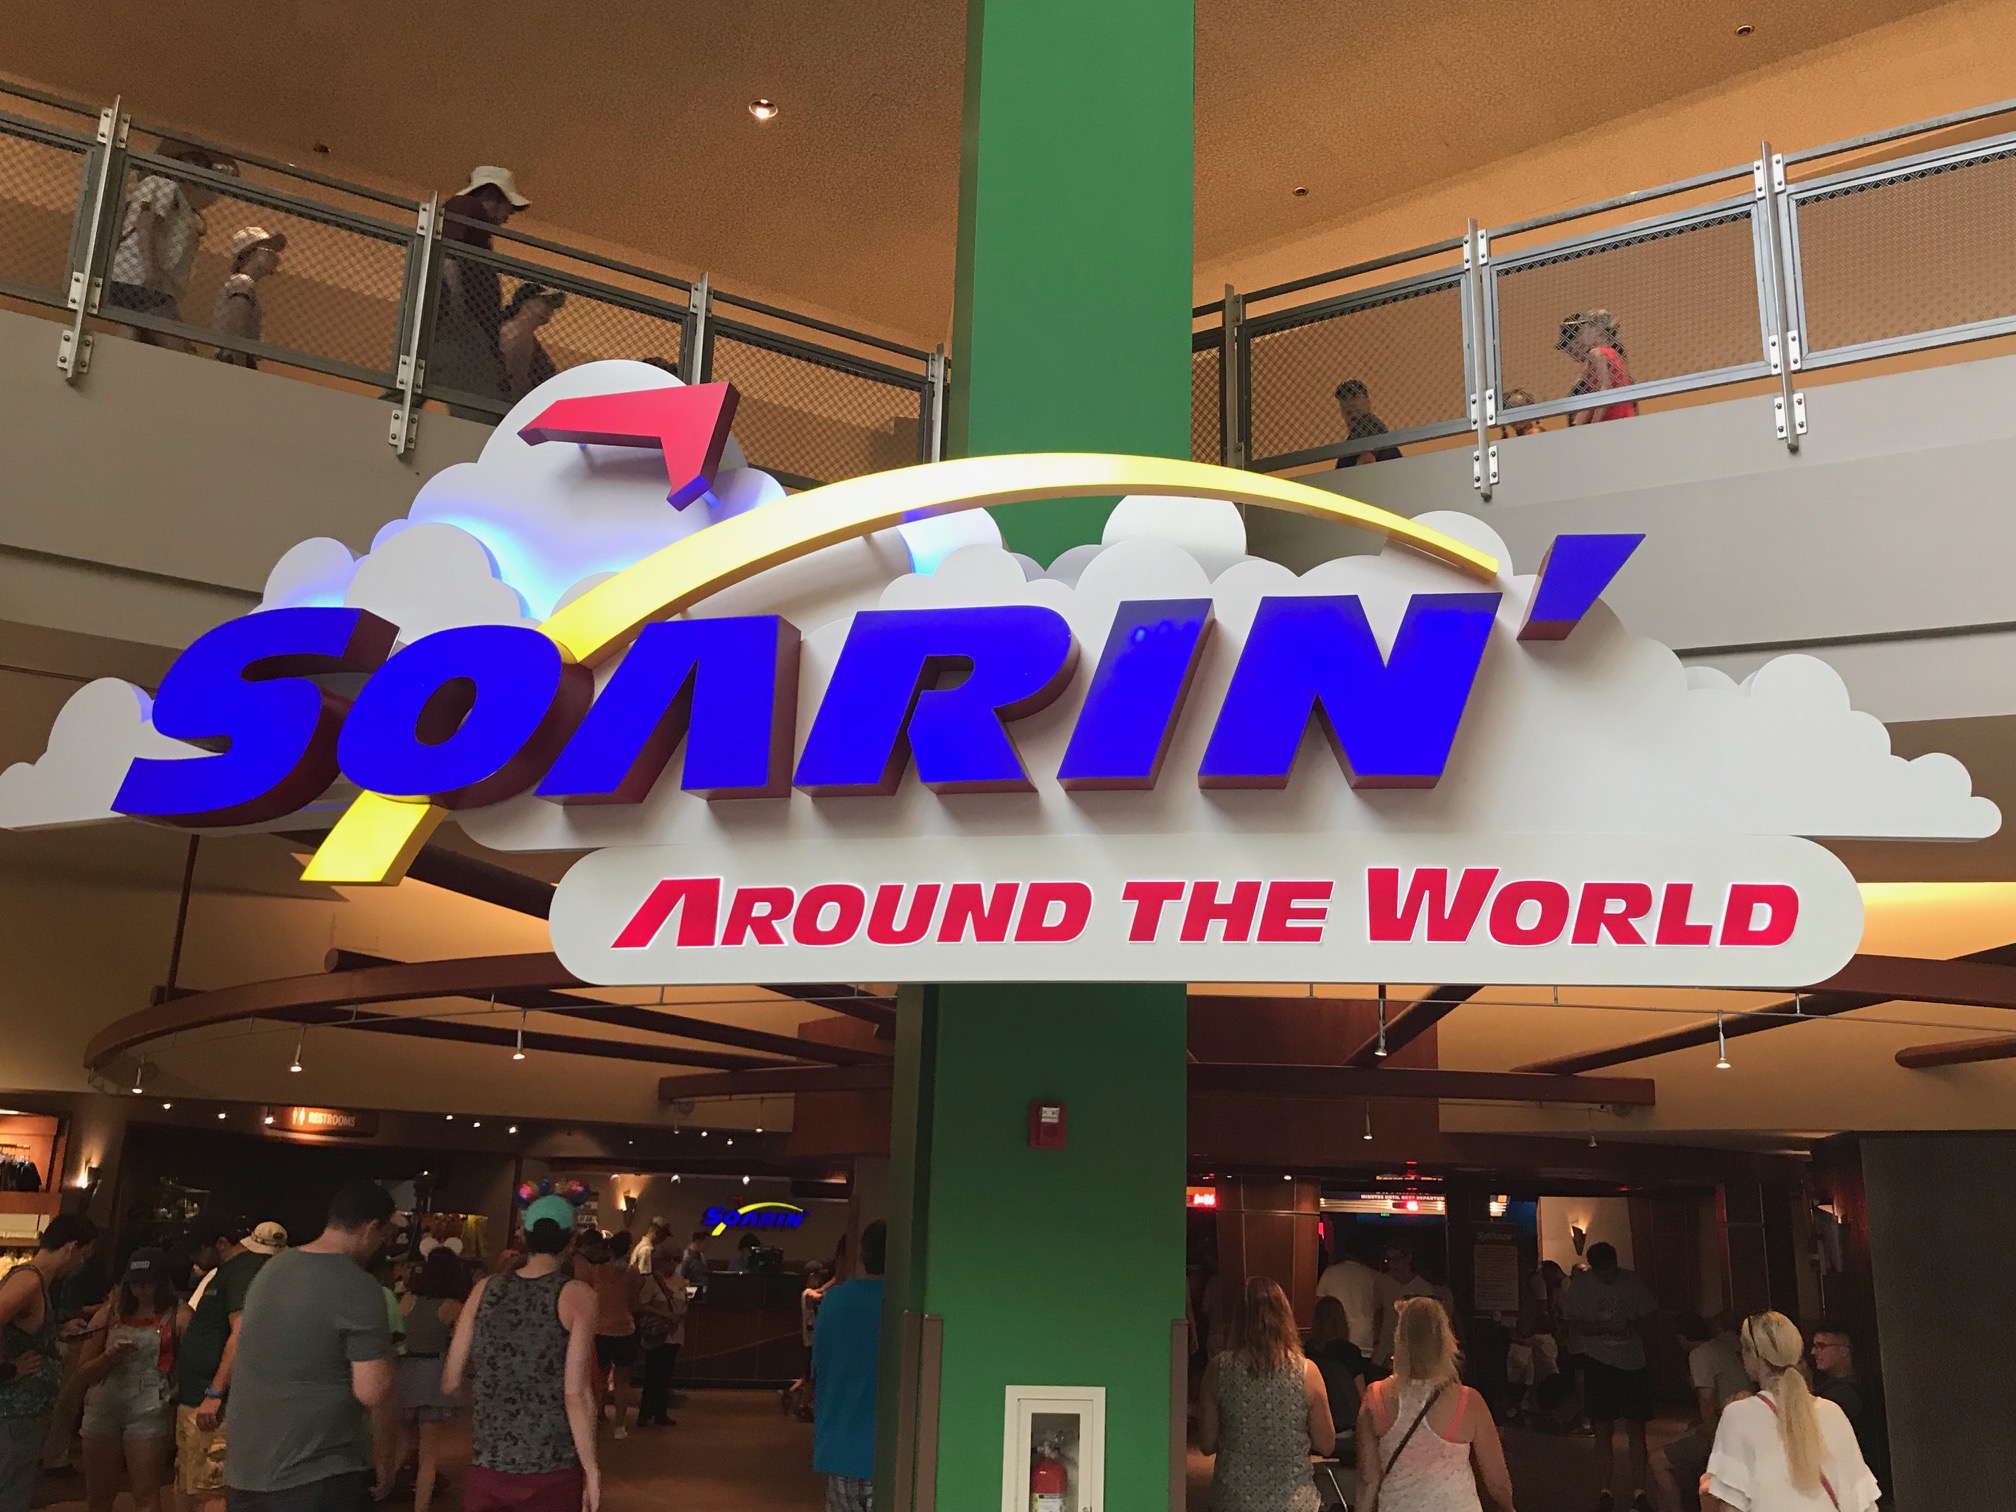
Any time you can ride either of these two E-ticket attractions in 45 minutes or less, you’ve done well!
Here are the other EPCOT wait times for last week:
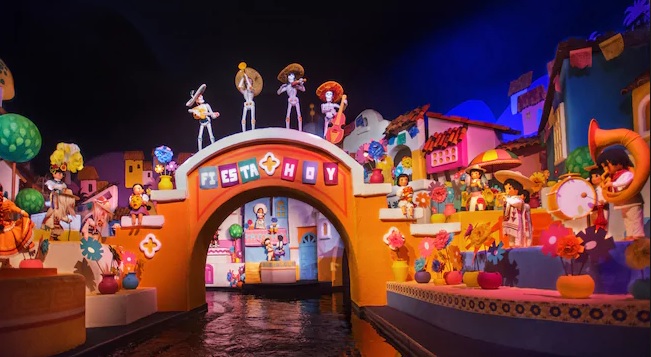
- Gran Fiesta Tour Starring the Three Caballeros – 28 minutes, no change
- Mission: SPACE – 27 minutes, down 5
- Spaceship Earth – 20 minutes, no change
- The Seas with Nemo & Friends – 16 minutes, down 4
- Journey into Imagination with Figment – 14 minutes, no change
- Living with the Land – 12 minutes, no change
Magic Kingdom
With so many guests at the parks, Magic Kingdom earns the most visits. After all, it’s the most trafficked theme park on the planet.
This past week, the average ride here required a 29-minute wait, an increase of four minutes from last time.
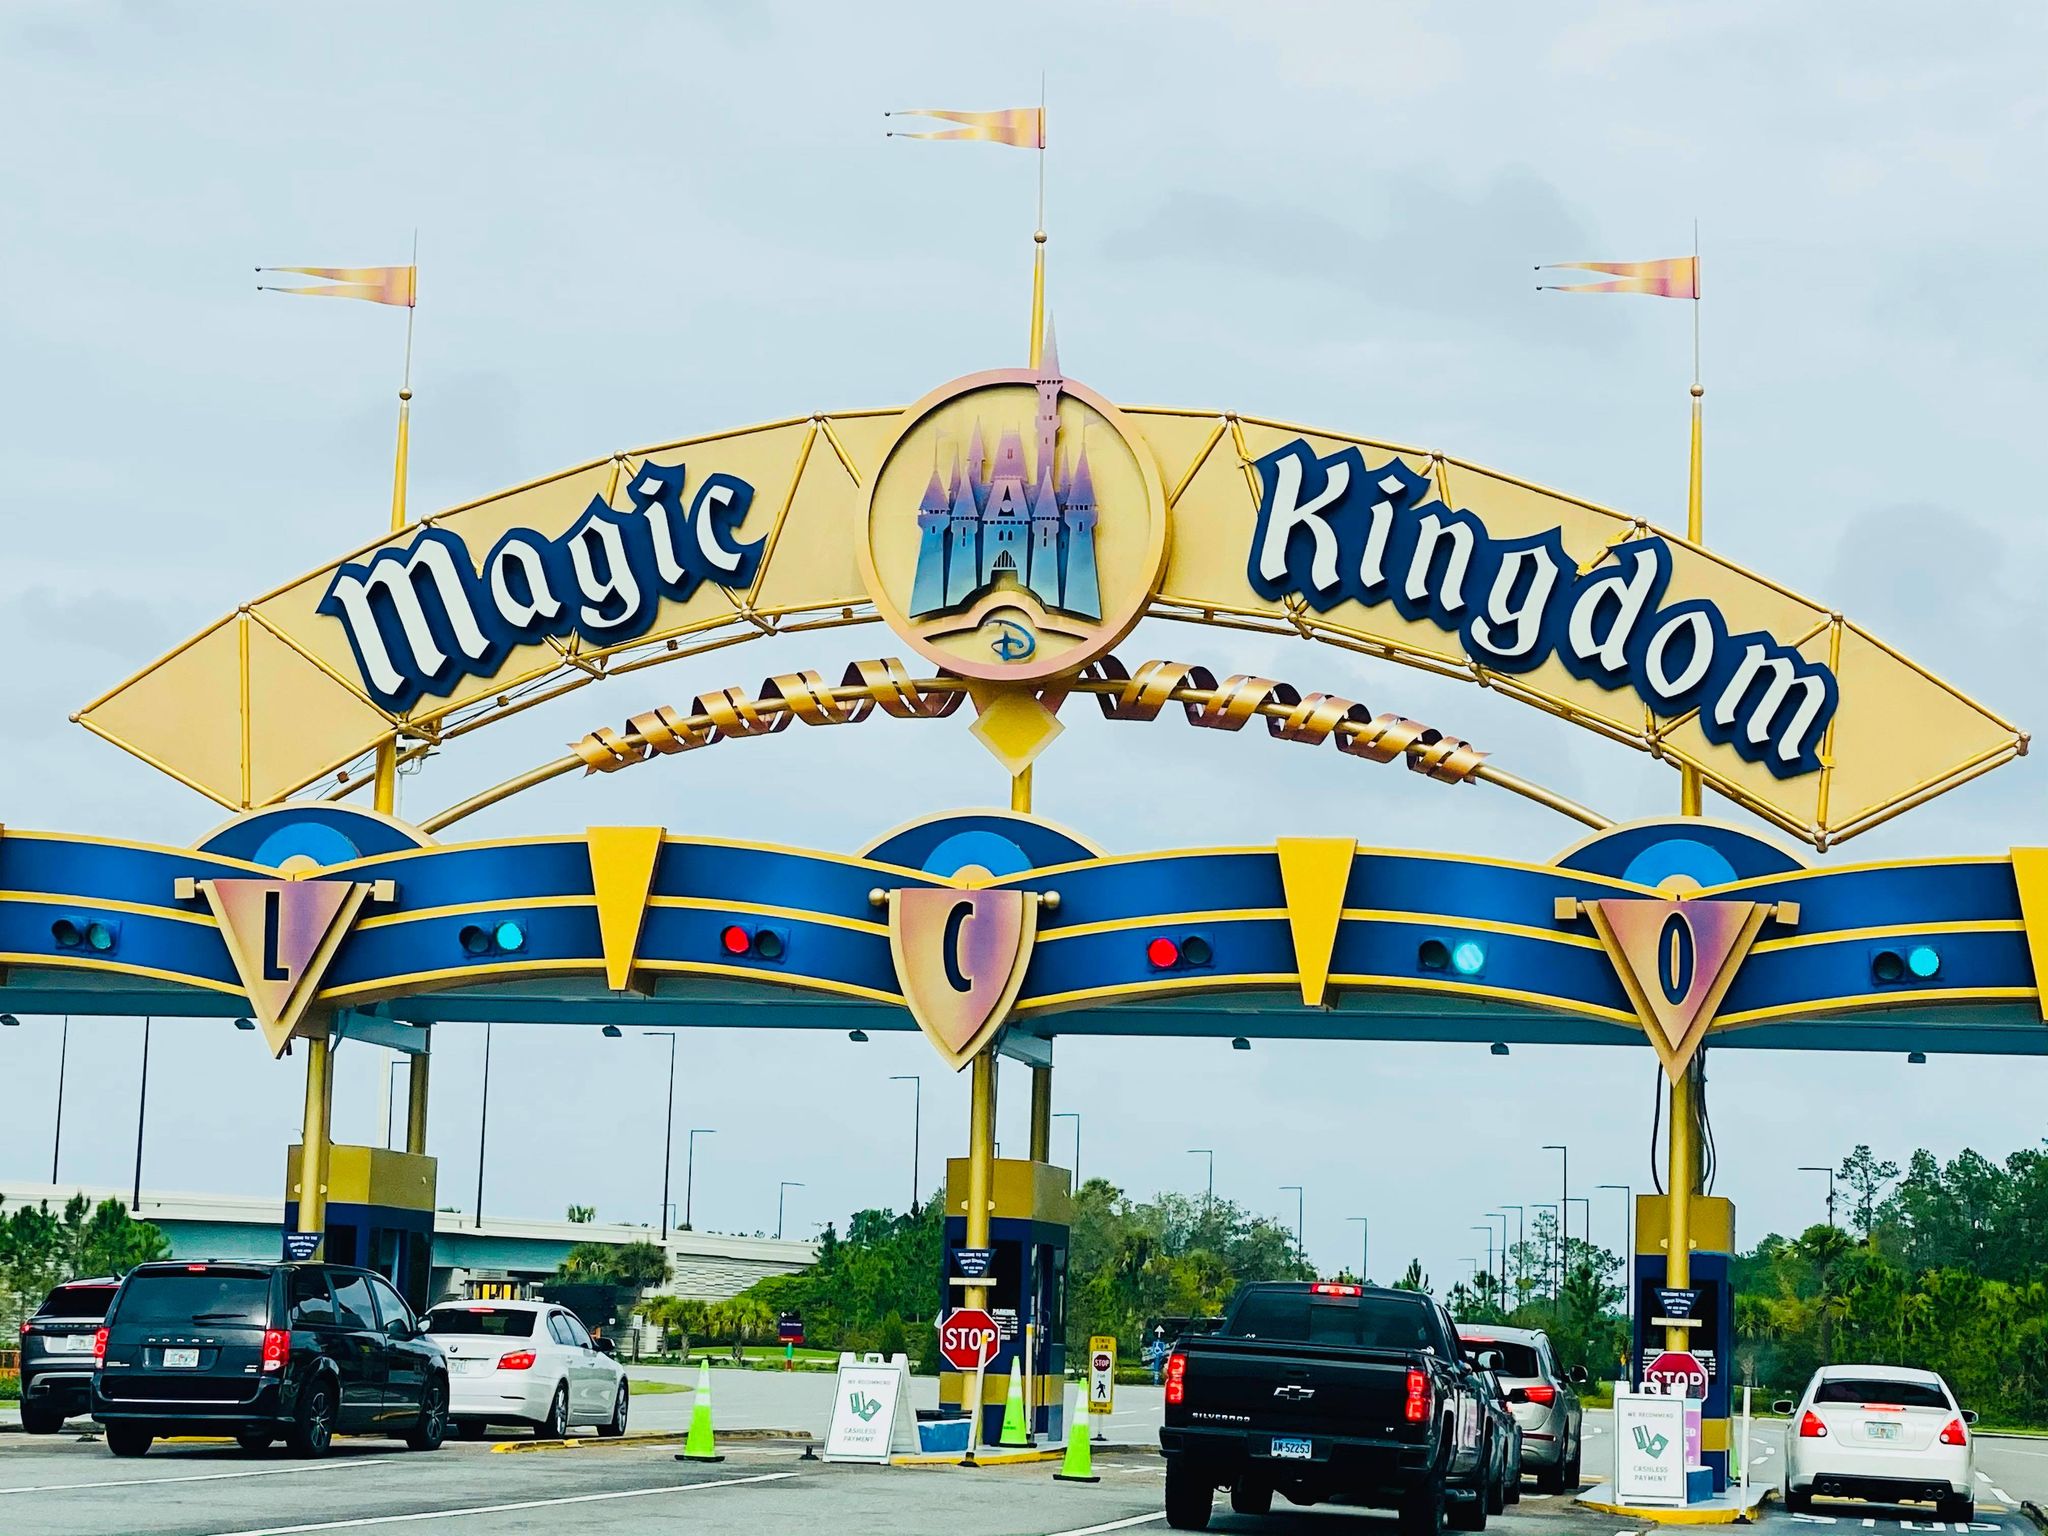
However, Magic Kingdom has only increased two minutes in total from two weeks ago.
So, the traffic fluctuations haven’t impacted it much. As I’ve said before, the sheer volume of attractions at Magic Kingdom naturally keeps all wait times in check.

Photo: Matt Stroshane
When you visit Magic Kingdom, anytime you notice a prolonged wait time, you simply pick a different attraction instead. One hand washes the other this way.
Keeping that in mind, here are the average wait times for Magic Kingdom attractions last week:
- Seven Dwarf Mine Train – 65 minutes, no change
- Splash Mountain – 60 minutes, up 9
- Jungle Cruise – 50 minutes, up 2
- Space Mountain – 49 minutes, up 9
- Peter Pan’s Flight – 47 minutes, up 8
- Haunted Mansion – 44 minutes, up 6
- Astro Orbiter – 39 minutes, up 5
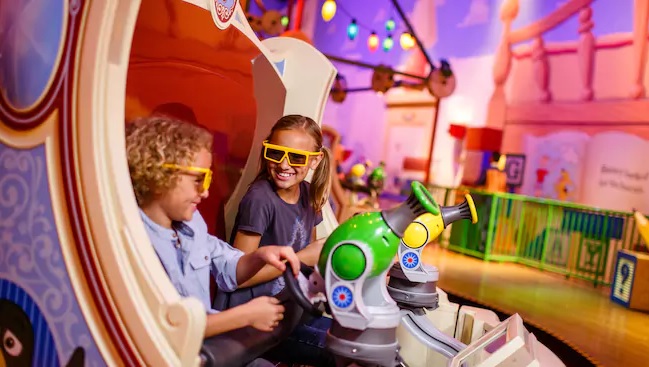
- Buzz Lightyear’s Space Ranger Spin – 34 minutes, up 7
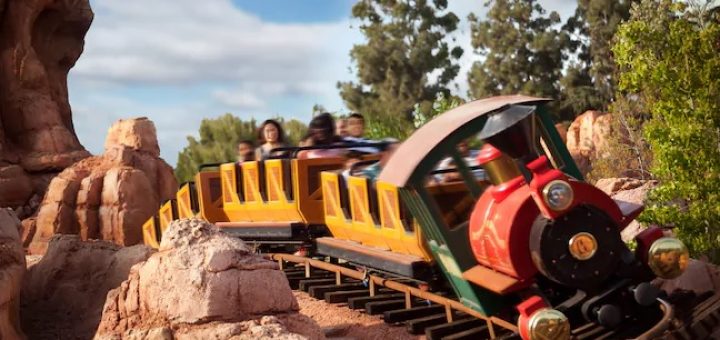
- Big Thunder Mountain Railroad – 33 minutes, up 5
- The Many Adventures of Winnie the Pooh – 33 minutes, up 5
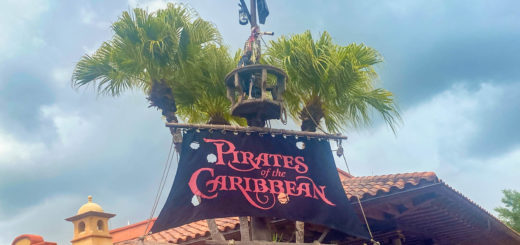
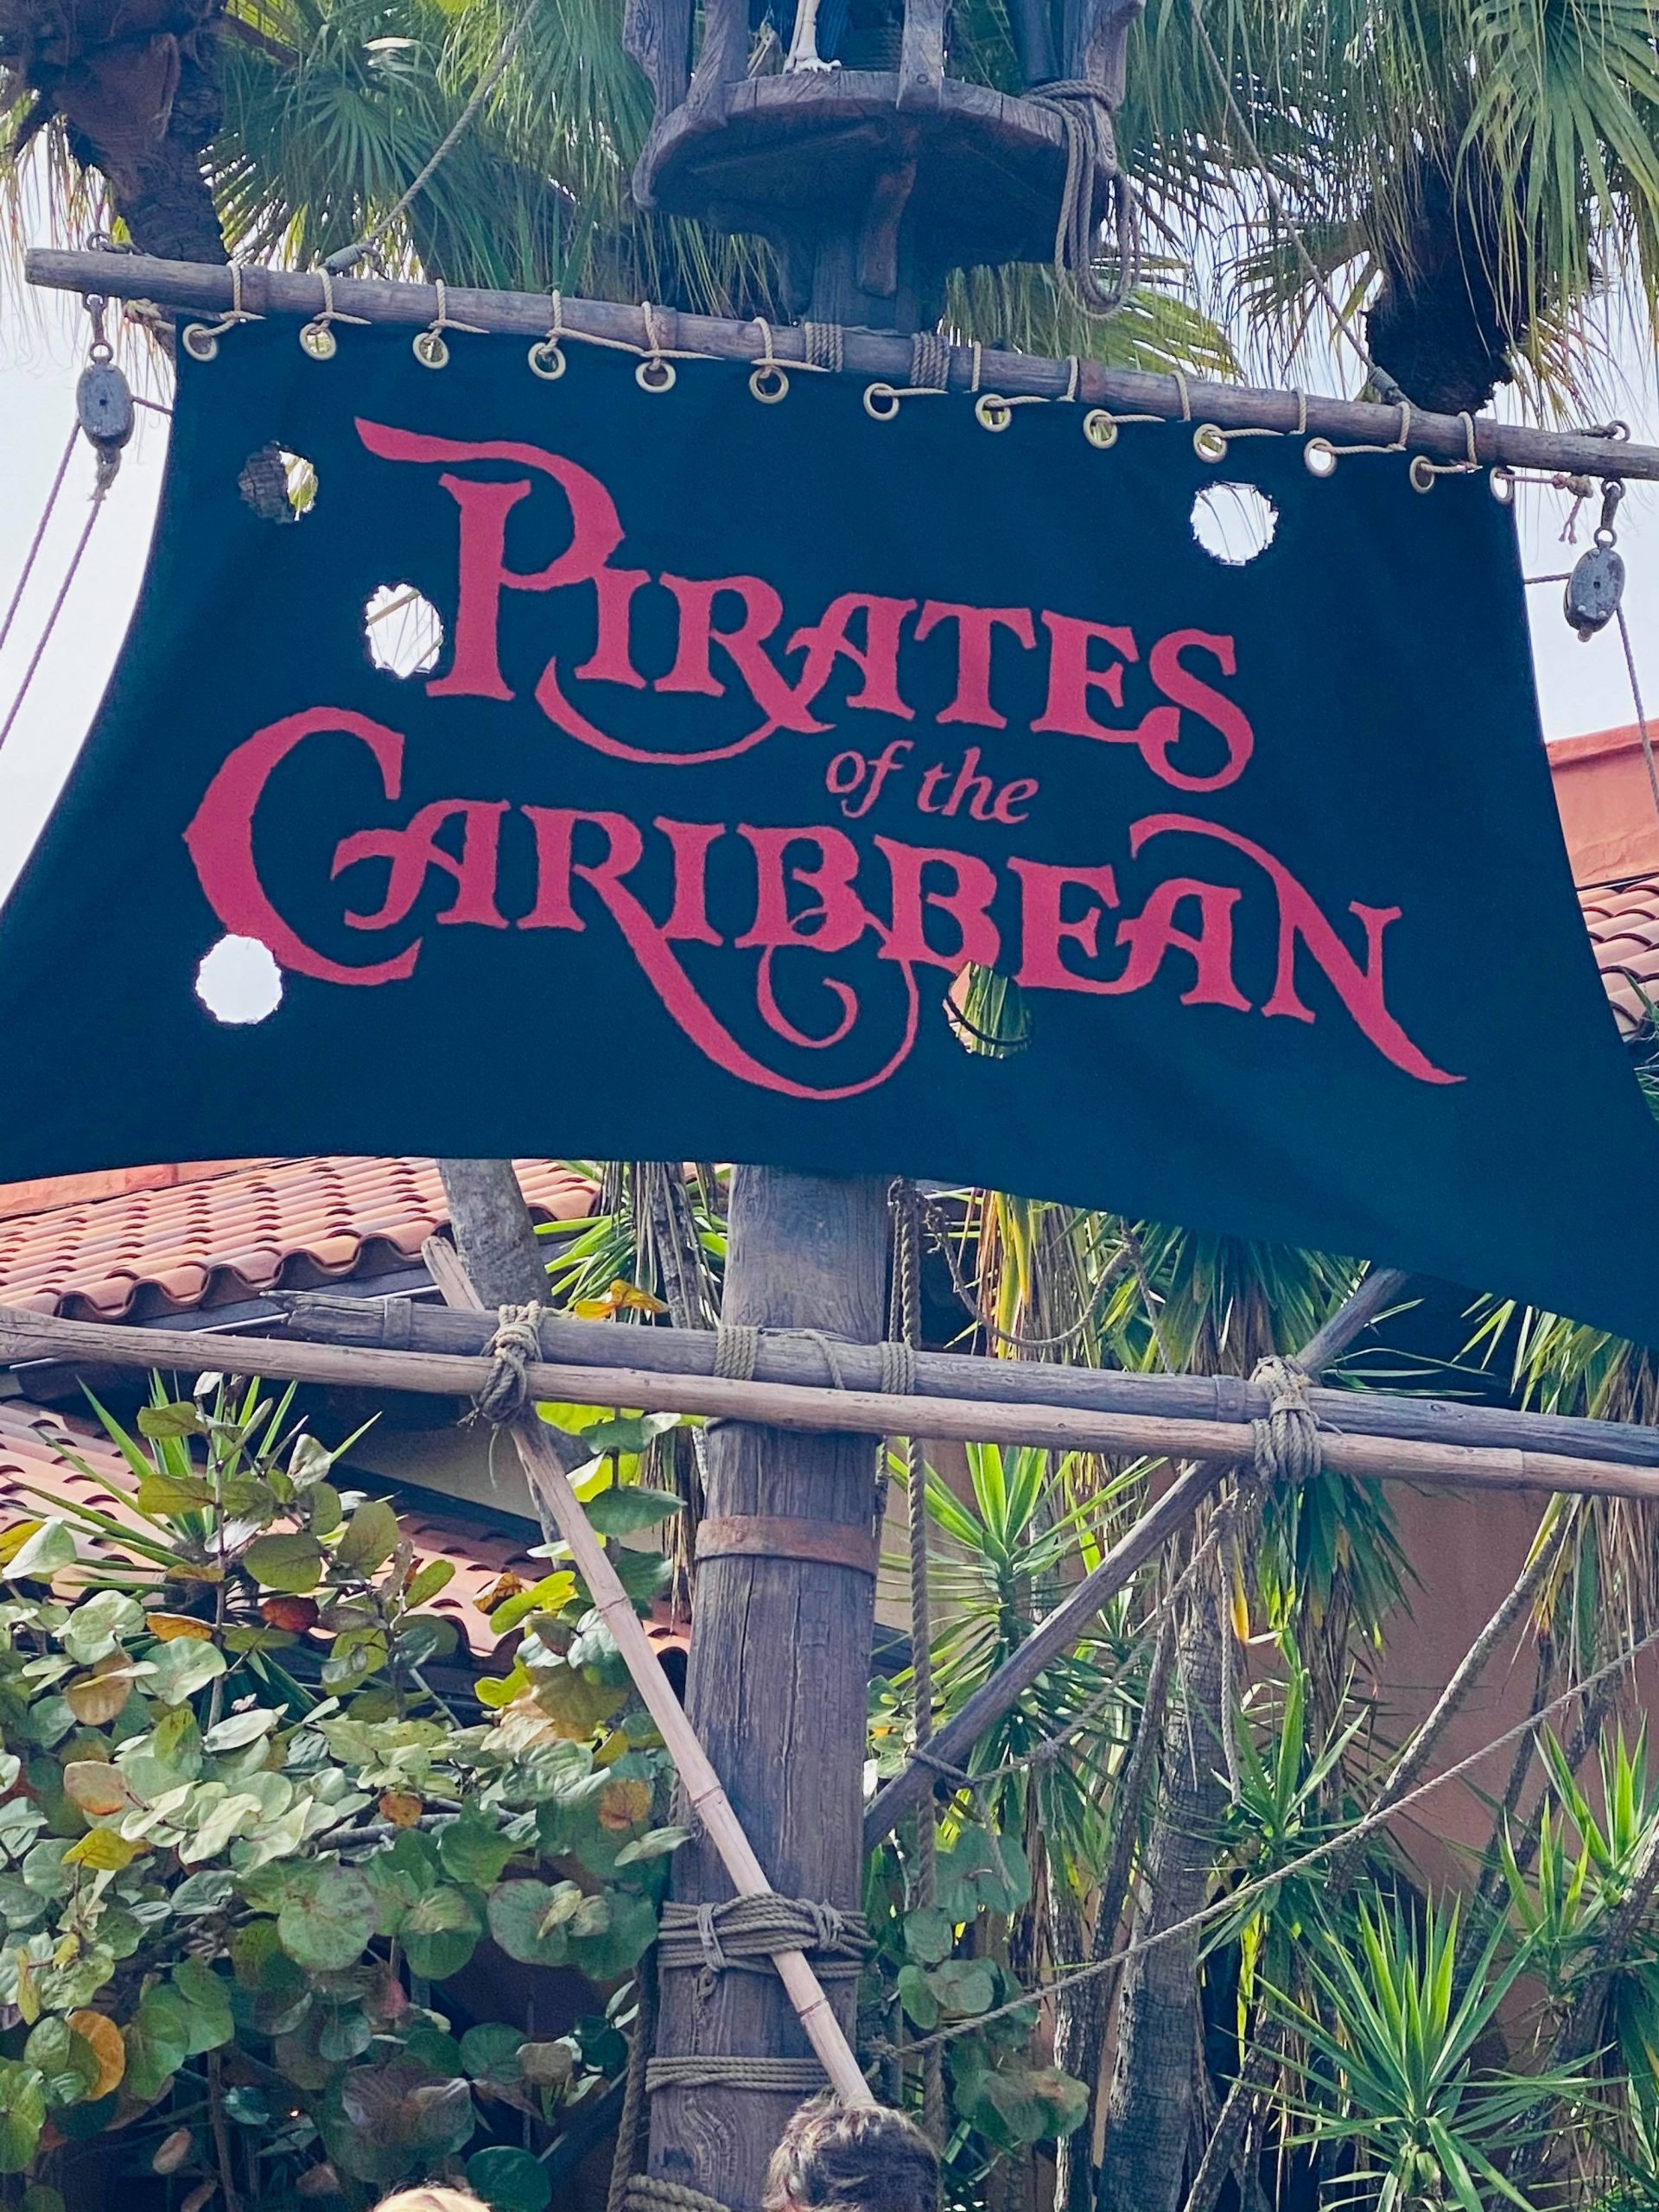
- Pirates of the Caribbean – 29 minutes, up 3
- It’s a Small World – 26 minutes, up 3
- Under the Sea ~ Journey of the Little Mermaid – 23 minutes, up 3
- Dumbo the Flying Elephant — 18 minutes, up 3
- Tomorrowland Speedway – 16 minutes, up 3
- Tomorrowland Transit Authority PeopleMover – 15 minutes, no change
- The Barnstormer – 15 minutes, up 3
- Magic Carpets of Aladdin – 14 minutes, up 2
- Mad Tea Party – 14 minutes, up 2
- Mickey’s PhilharMagic – 13 minutes, up 2
- Prince Charming Regal Carrousel – 10 minutes, no change
- Country Bear Jamboree – 8 minutes, no change
- Walt Disney’s Carousel of Progress – 5 minutes, no change
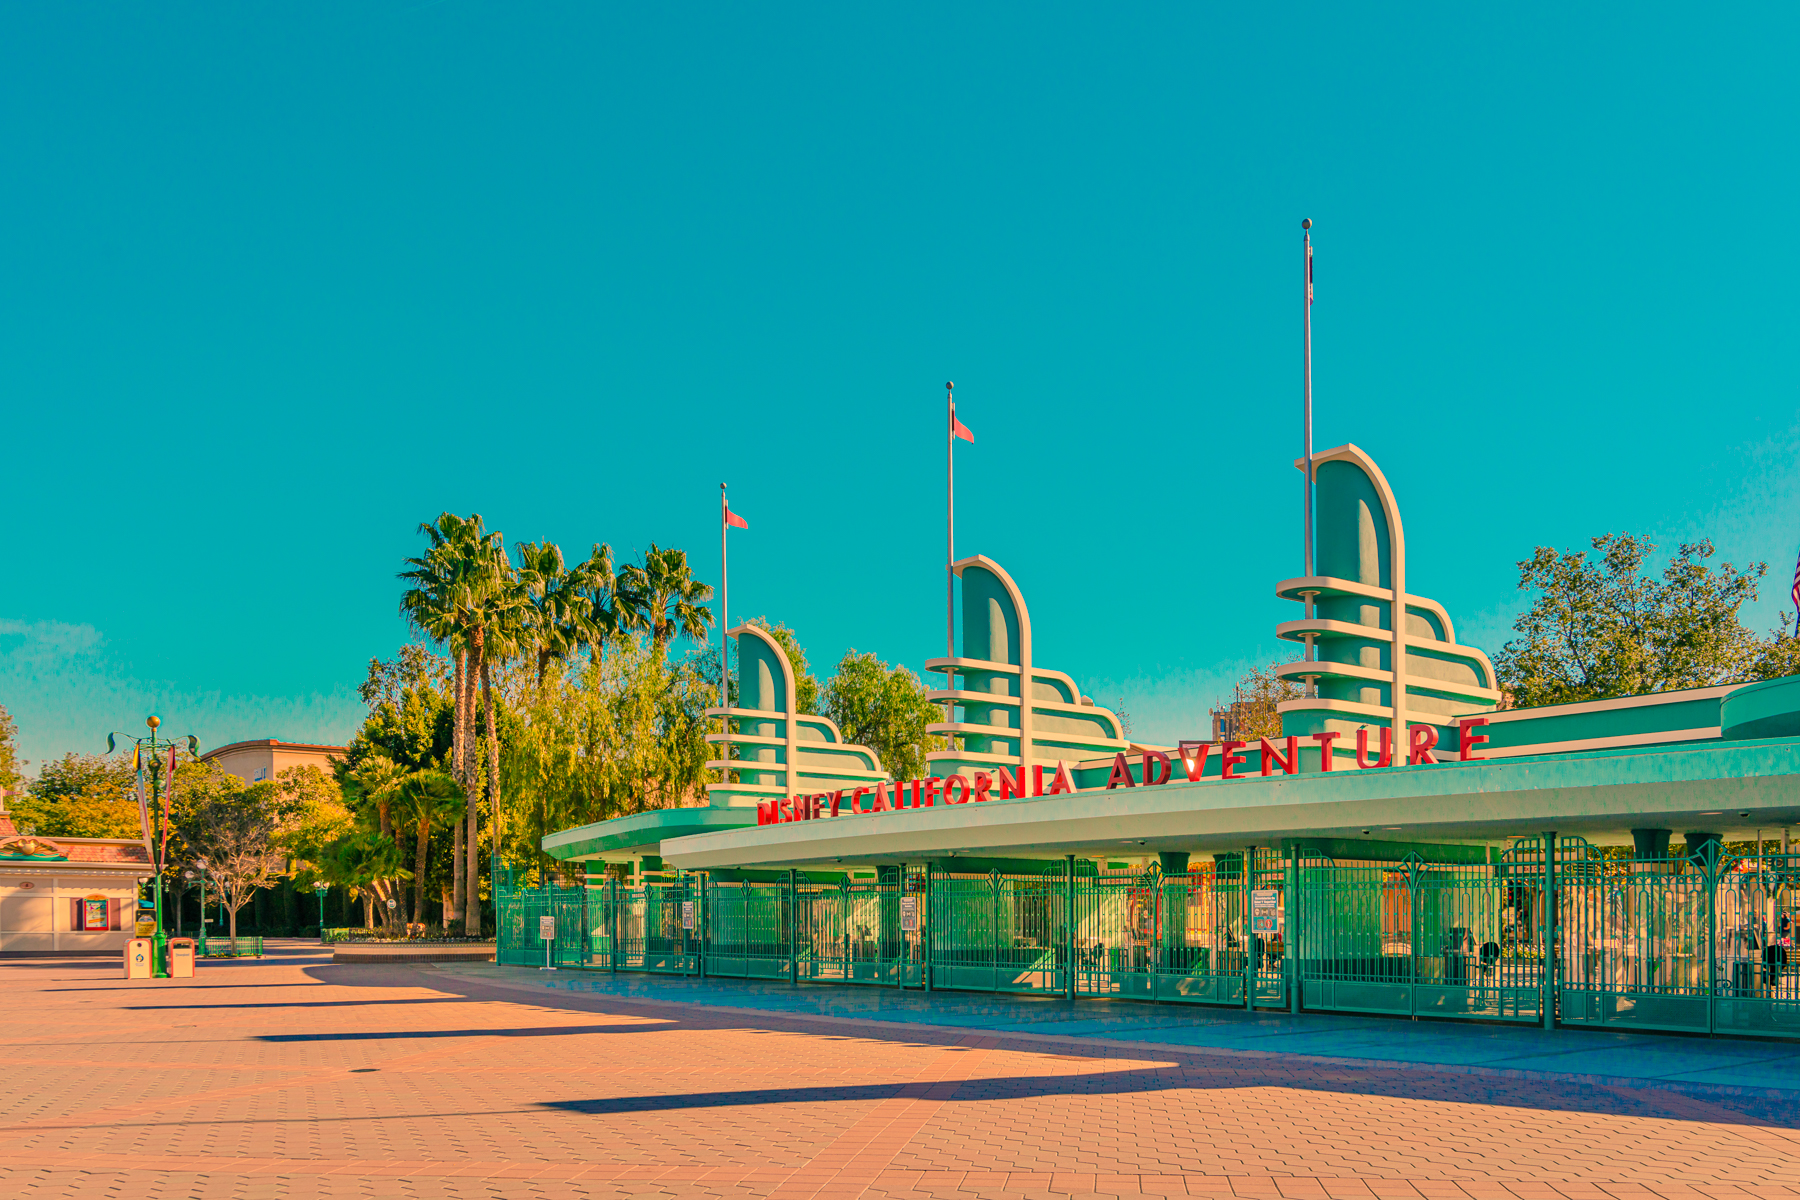
Disneyland Resort
I know that some of you have indicated that you don’t care as much about the Disneyland intel.
Still, I realize that it’s vital for California locals. Ergo, what I plan to do is list the highlights from now on, especially while we have a hot story going.
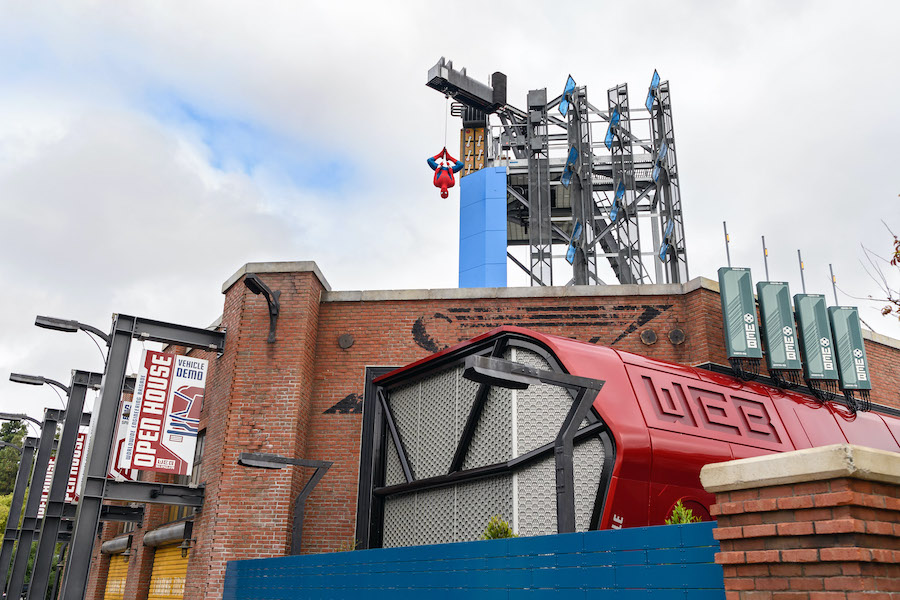
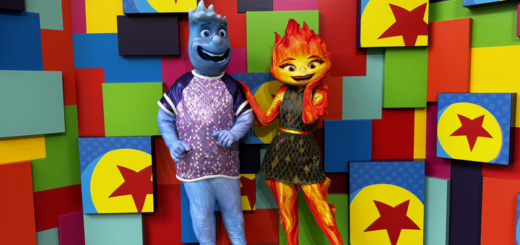
Image: Richard Harbaugh/Disneyland Resort
I’m referencing WEB SLINGERS: A Spider-Man Adventure, the hottest ride at Disney California Adventure since The Incredicoaster opened.
Alas, WEB SLINGERS utilizes a virtual queue, which makes wait time estimations challenging to determine.
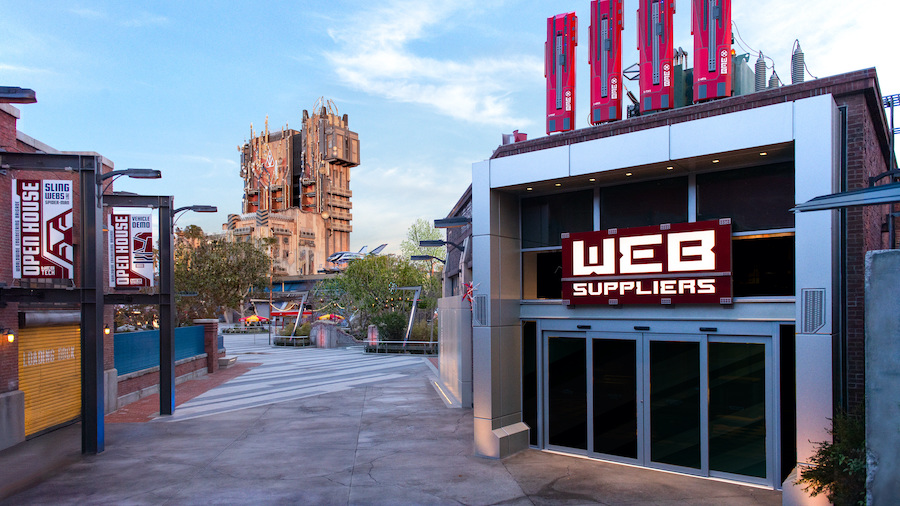
Image: Christian Thompson/Disneyland Resort
I mentioned last week that guests waited 206 minutes on average to experience the new attraction.
This week, that number has dropped to 90 minutes or so. However, I don’t list Star Wars: Rise of the Resistance for a reason.
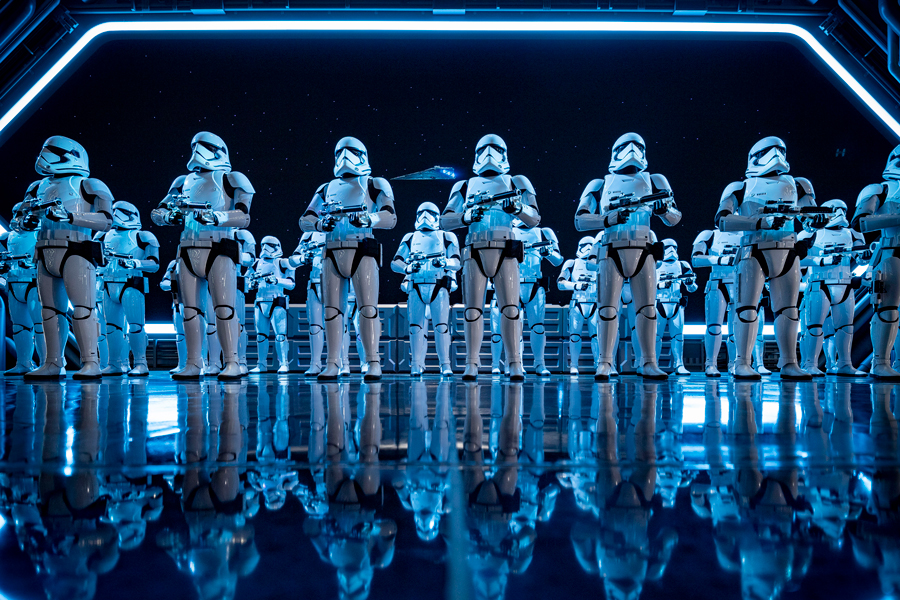
Image Credit: Disney
These estimates aren’t as accurate as the others I’m listing here. So, take this one with a grain of salt.
Anyway, here are a few Disneyland Resort attractions of interest:
- Radiator Springs Racers – 60 minutes, down 2
- Splash Mountain – 46 minutes, up 5
- Millennium Falcon: Smugglers Run – 40 minutes, up 6
- Guardians of the Galaxy — Mission: BREAKOUT! – 38 minutes, up 3
- Indiana Jones Adventure – 38 minutes, up 3
- Pixar Pal-A-Round – 29 minutes, no change
- Snow White’s Enchanted Wish – 25 minutes, down 2
- Incredicoaster – 19 minutes, no change
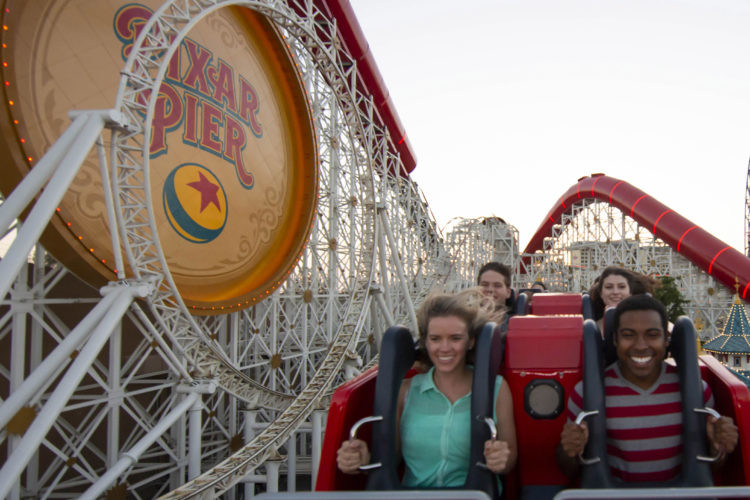
The Increditcoaster in California Adventure Park
Credit: Disney
Overall, the average Disneyland attraction required a modest 21-minute wait, up only a minute from last week.
Meanwhile, DCA also went up a minute, averaging 25 minutes per attraction. So, Disneyland Resort provides plenty of bang for the buck!