Walt Disney World Wait Times for Third Week of July 2024
The month of July has created a bit of a mystery for Walt Disney World fans.
Some have wondered why the park crowds aren’t as ginormous as usual.
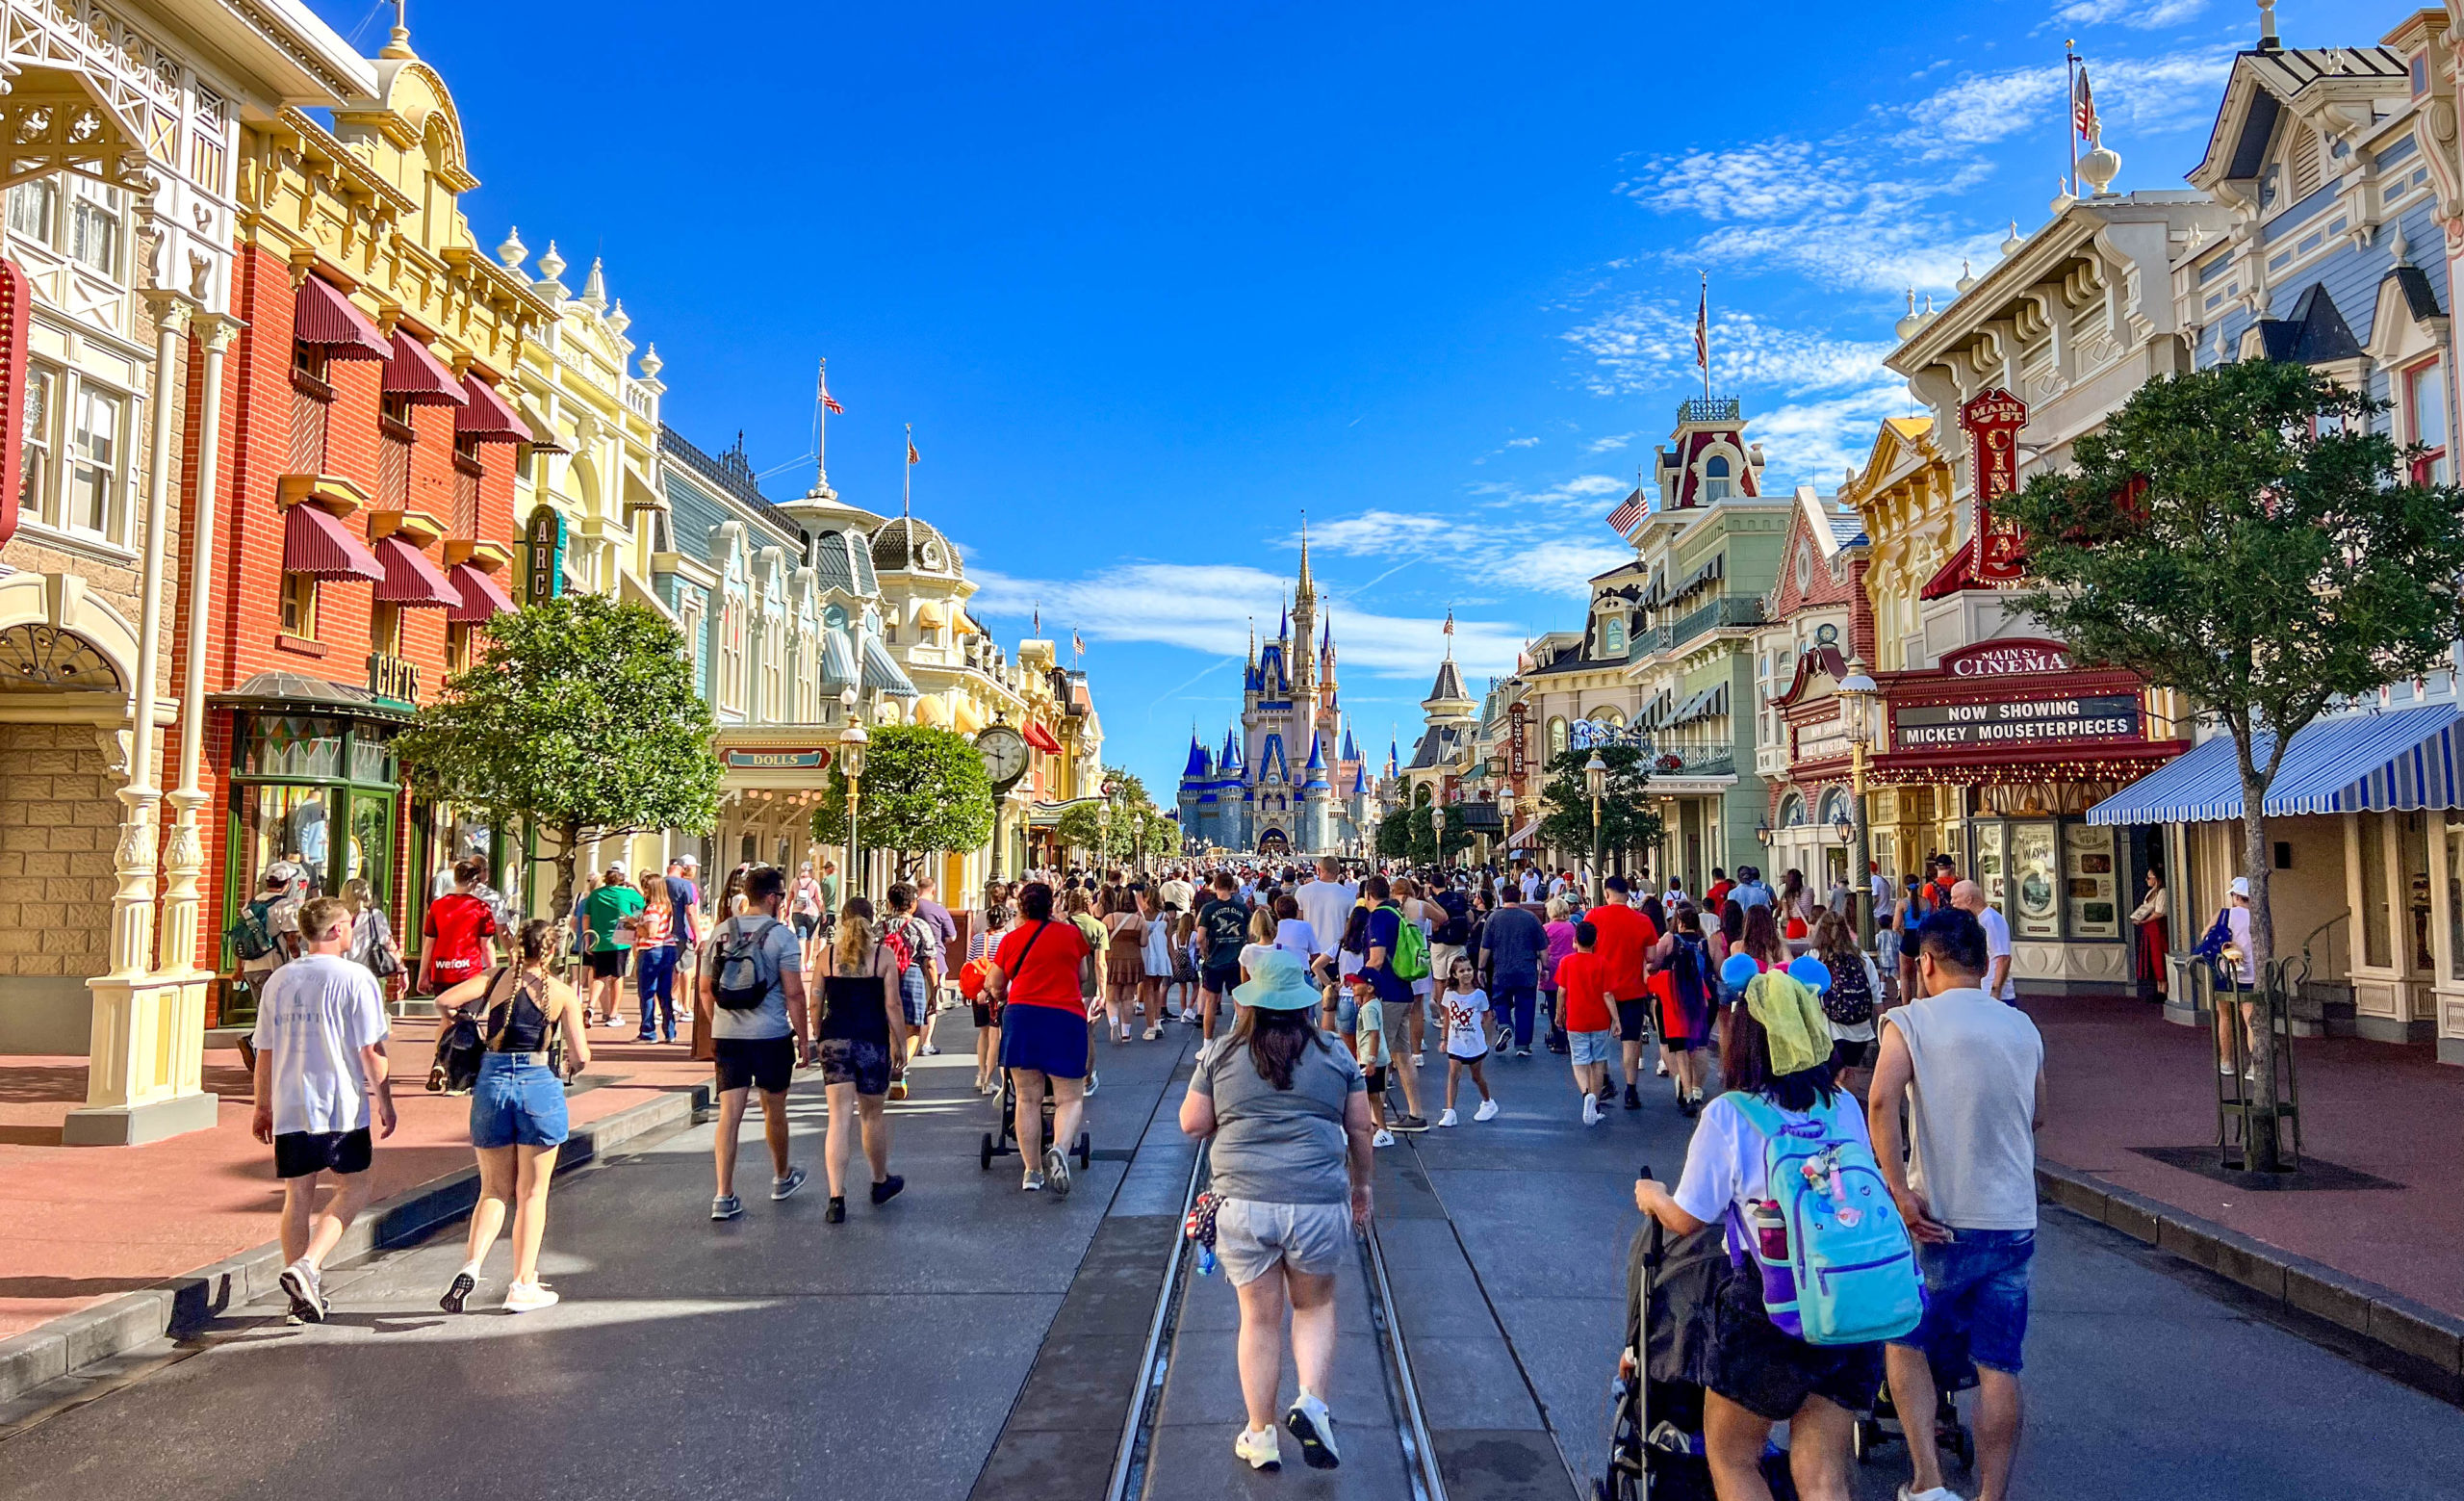
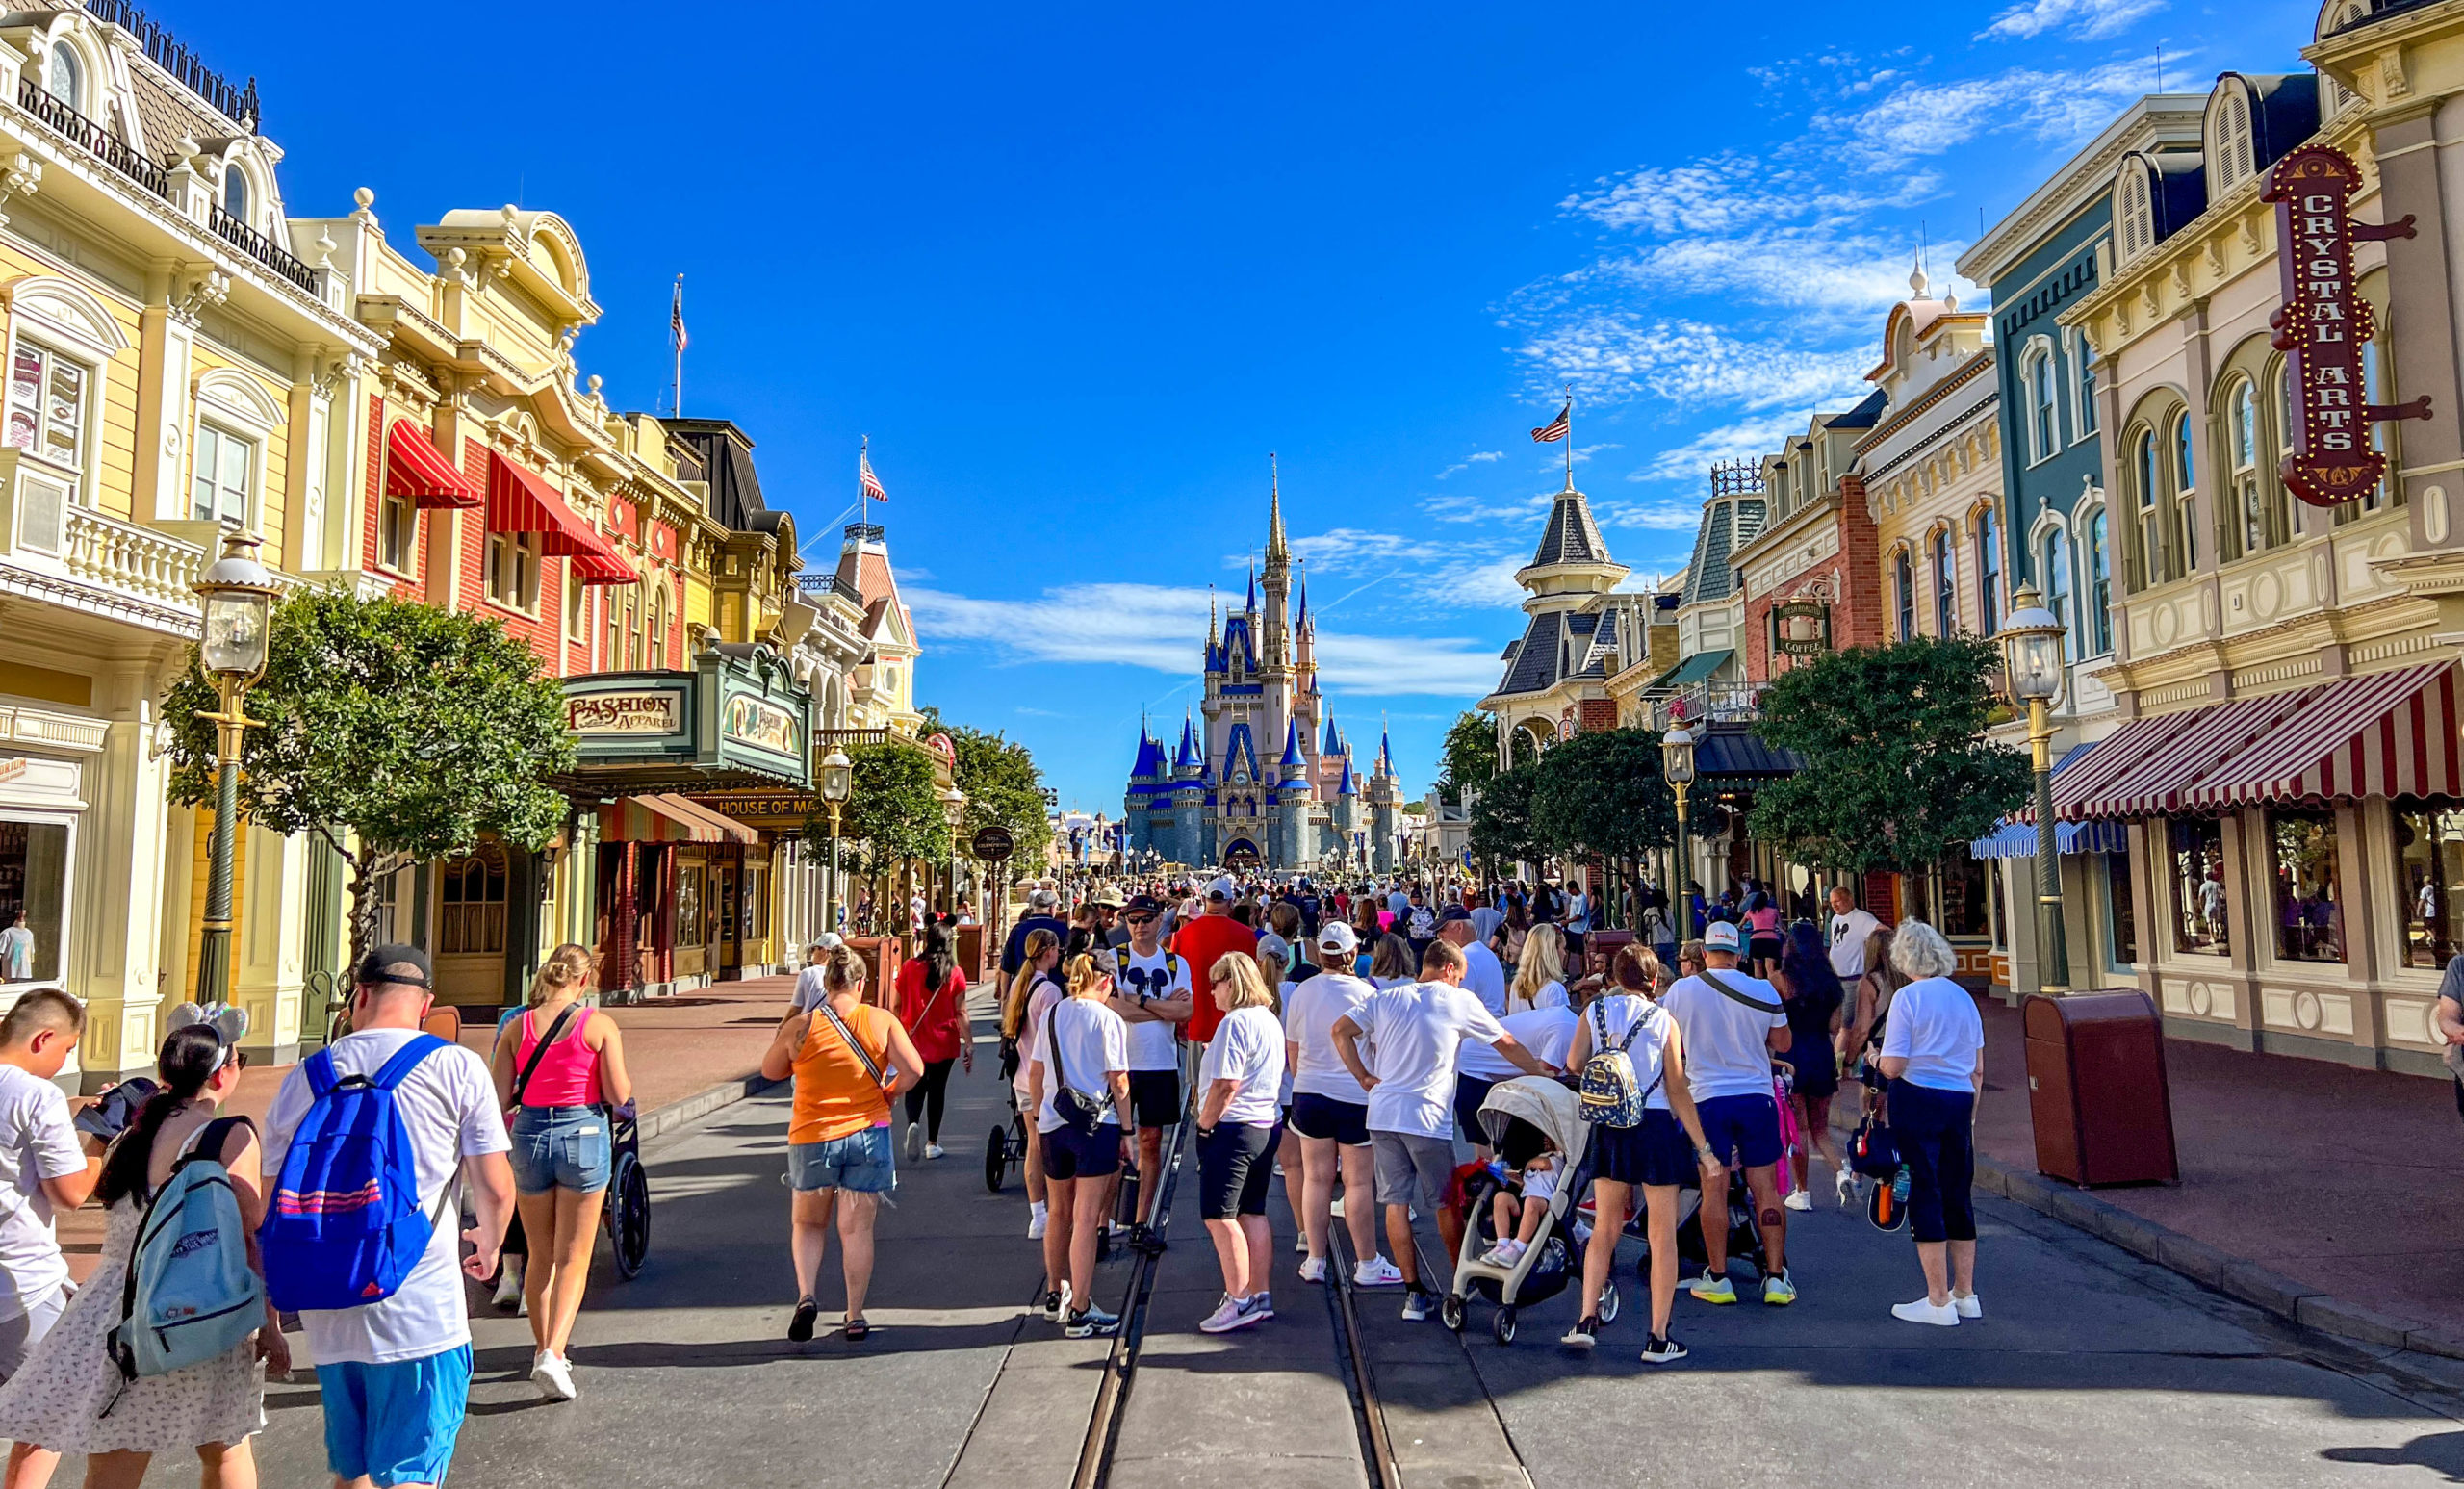
Main Street, U.S.A.
In fact, MickeyBlog recently got into the act. Here’s an article showing some surprisingly small crowds and low wait times.
Did we simply time our visit well, or are the parks not as crowded this summer? Let’s find out.
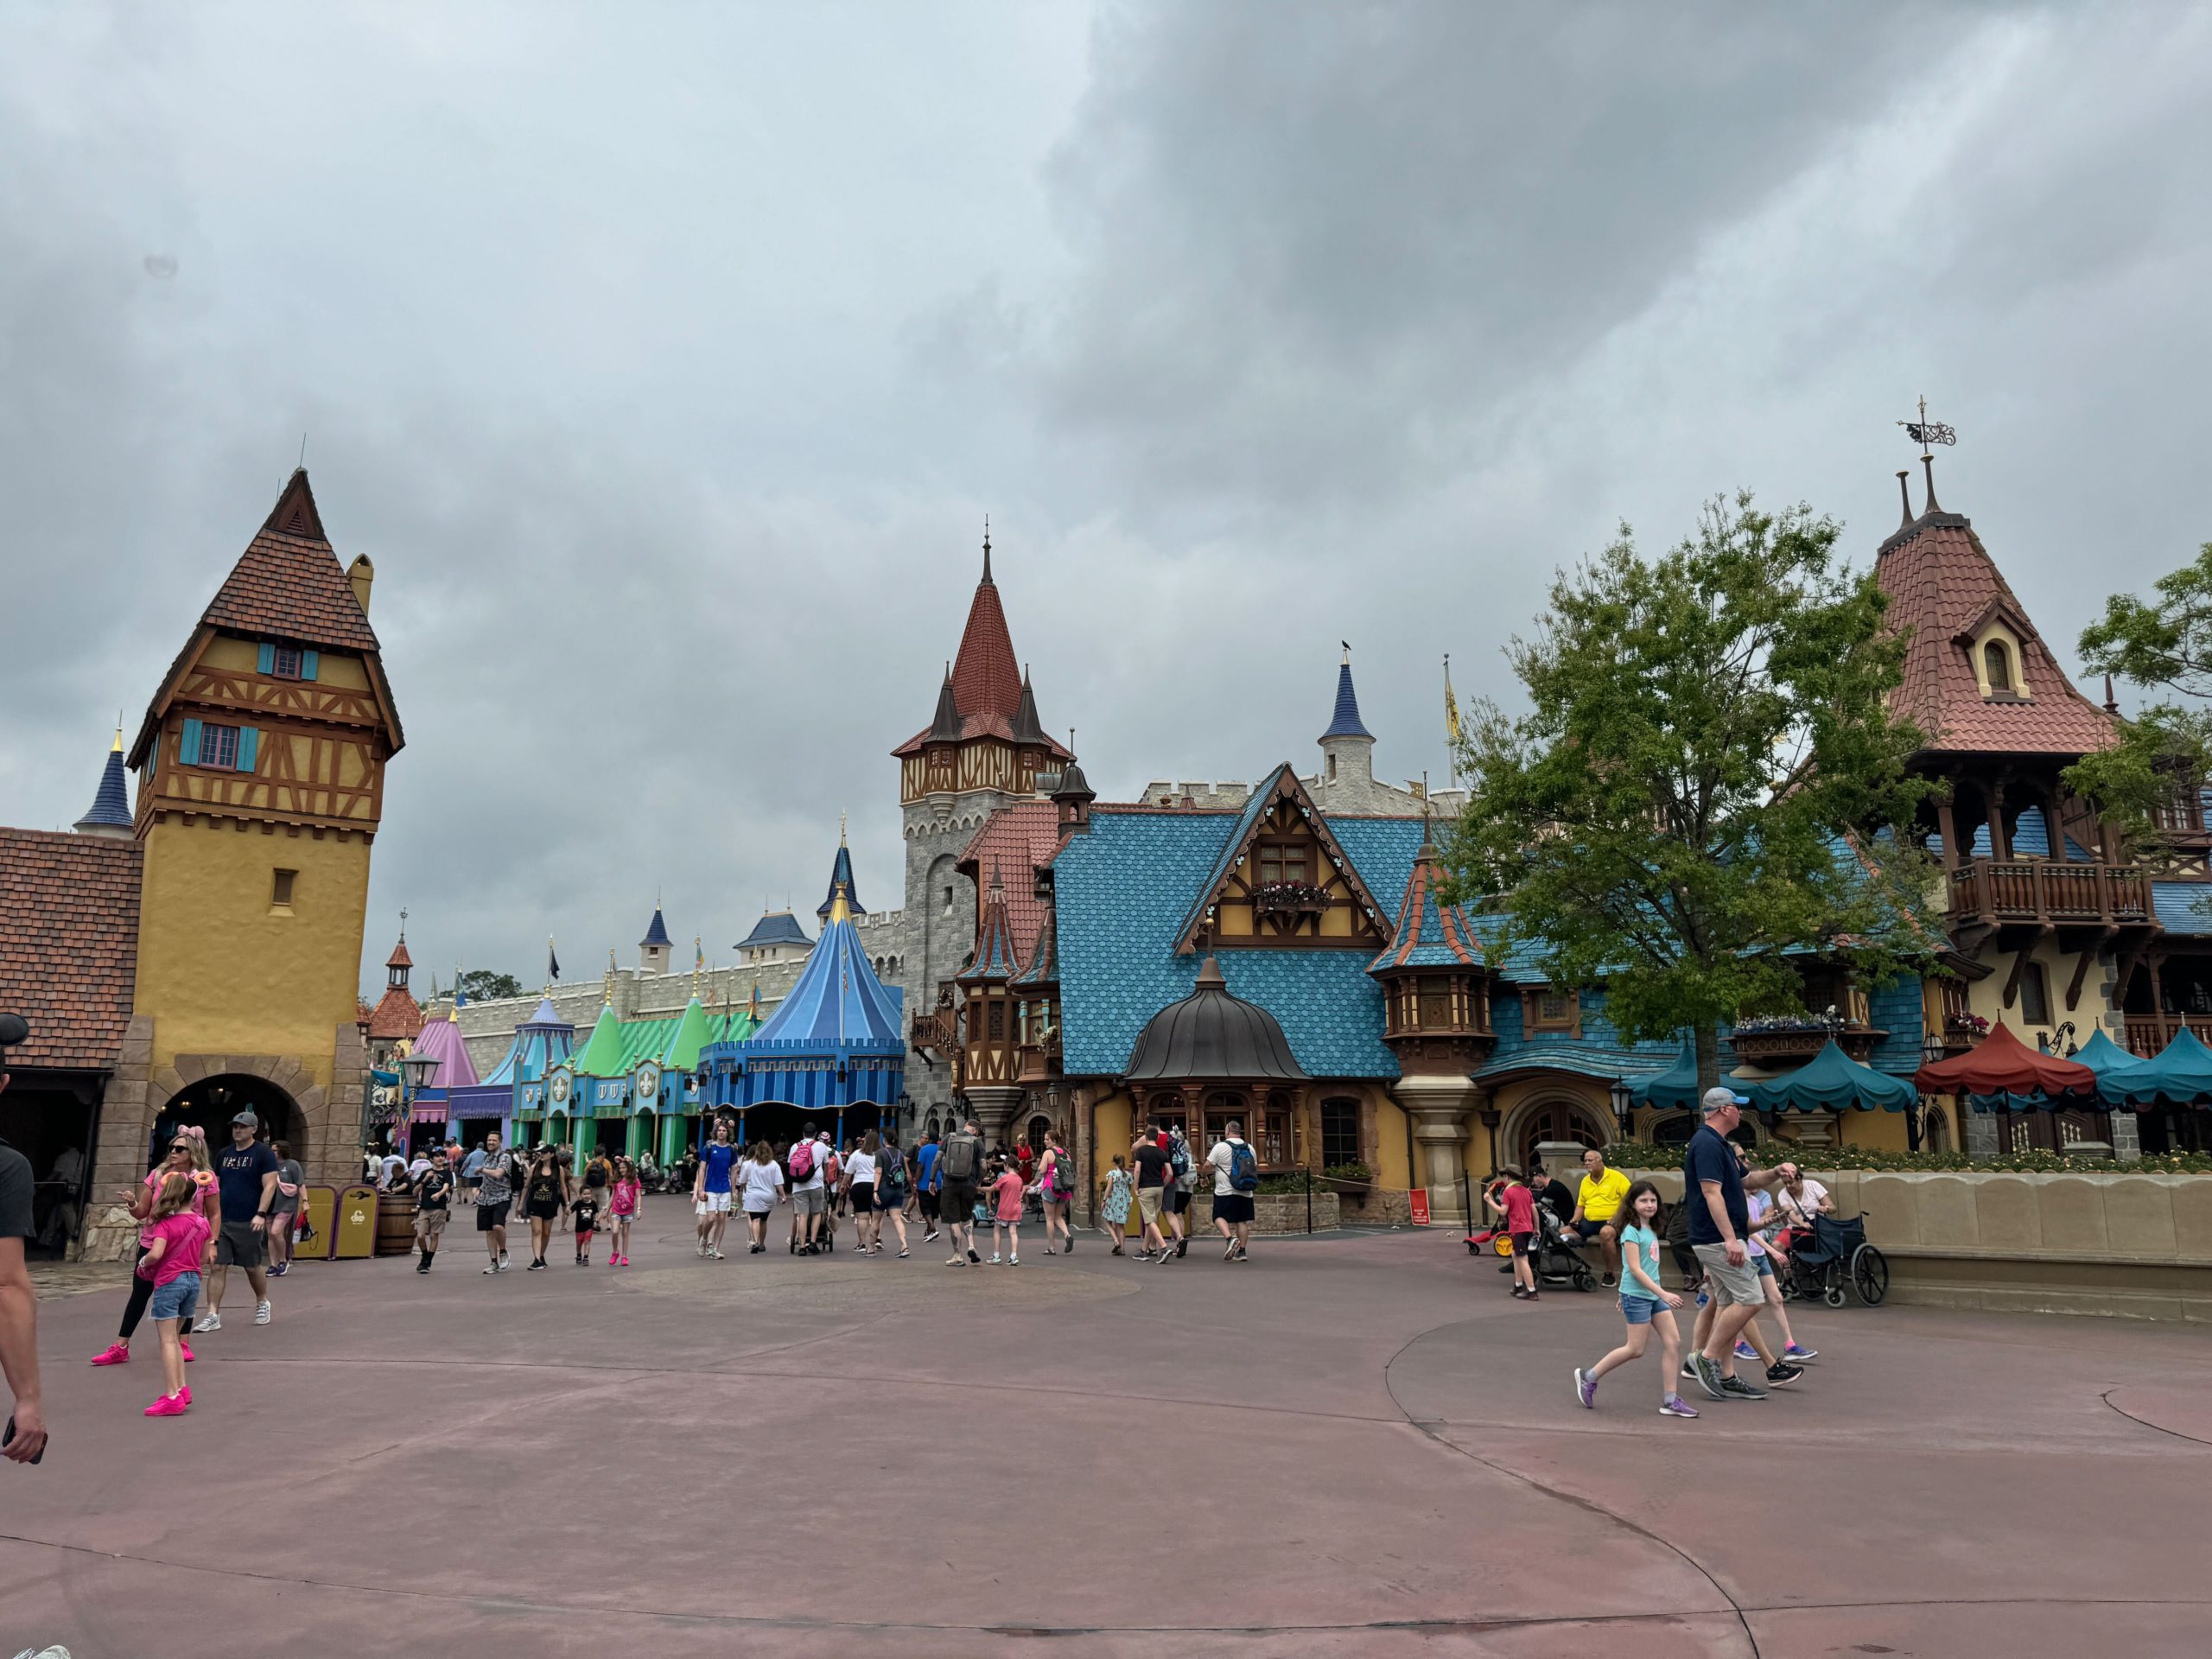
Magic Kingdom Spring Break Crowds
Here are Walt Disney World’s wait times for the third week of July 2024.
Disney’s Animal Kingdom
Okay, here’s what’s happening. Historically, Disney data sites have evaluated park attendance on a ten-point scale.
The idea is that a random day in January or September is probably a 1 out of 10 in terms of crowd size.
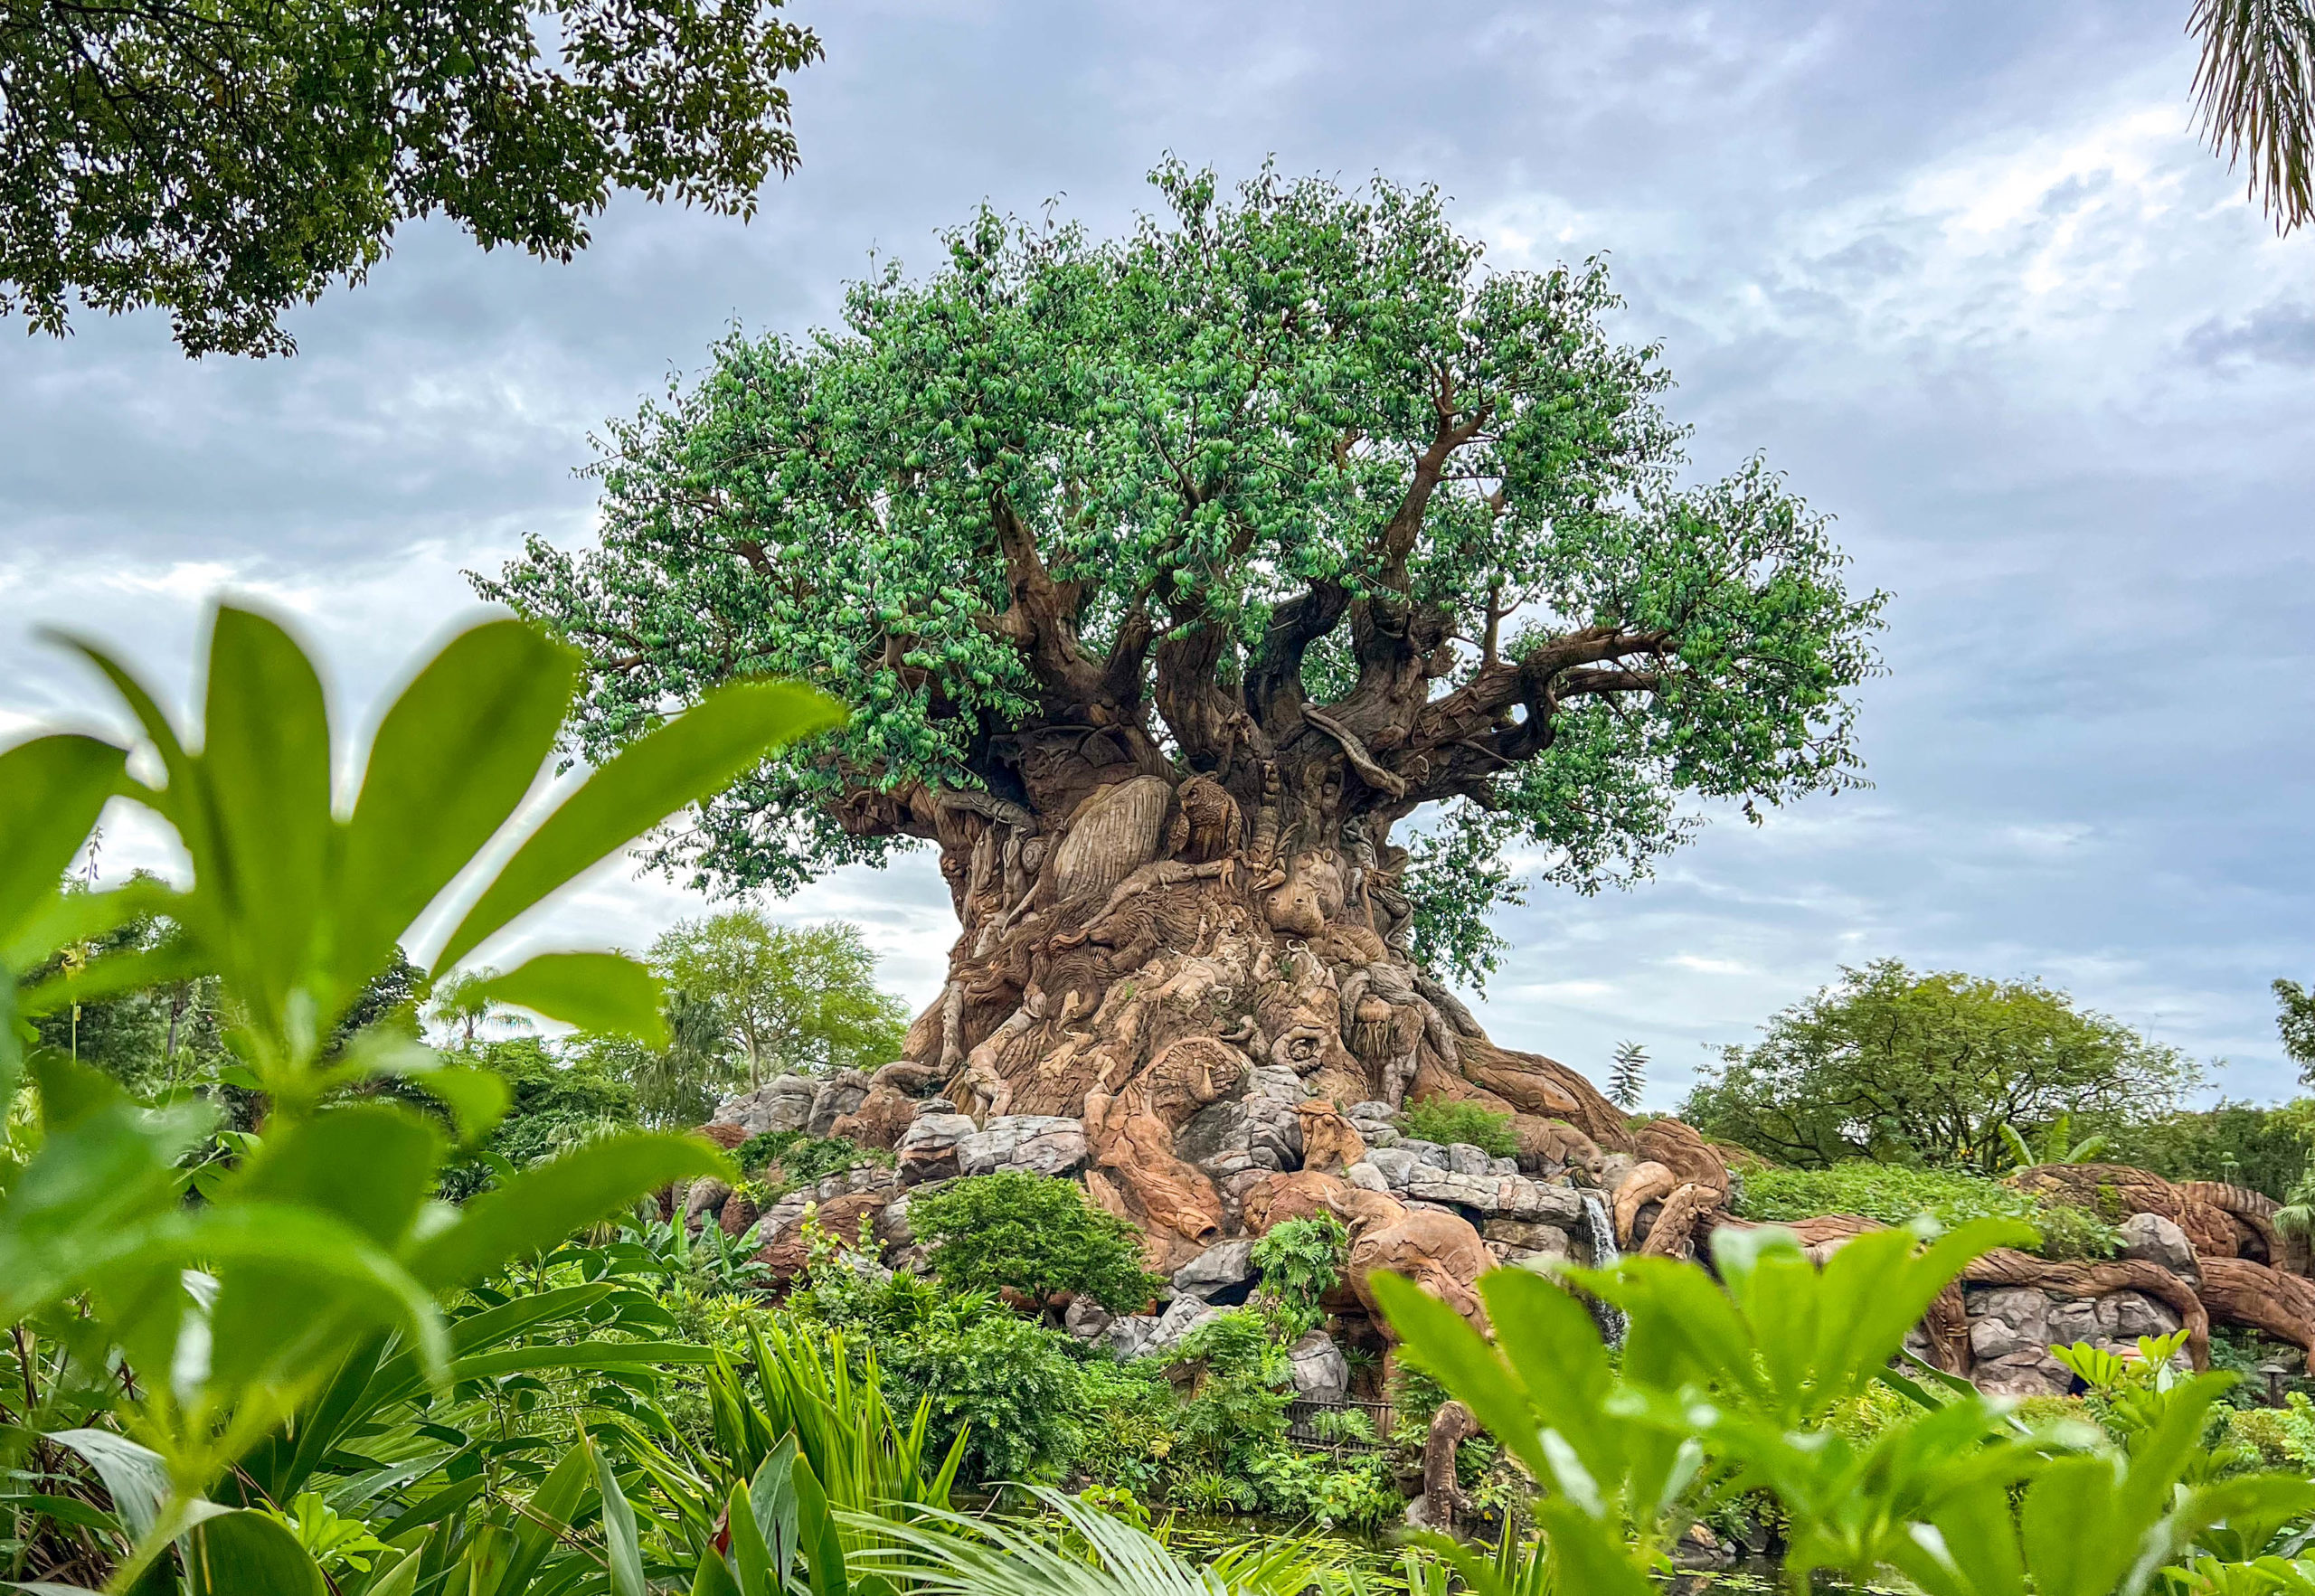
Tree of Life
Obviously, the EPCOT International Festival of the Arts has changed that statement a bit, but it’s accurate enough.
Meanwhile, times like Easter, Thanksgiving, and Christmas Week are a 10 out of 10 when it comes to crowds.
Avatar — Flight of Passage
Historically, most days in July have been at least a seven out of ten.
While I use different metrics for my evaluations, I’m noticing that this July isn’t quite as popular as it was any of the last three years.
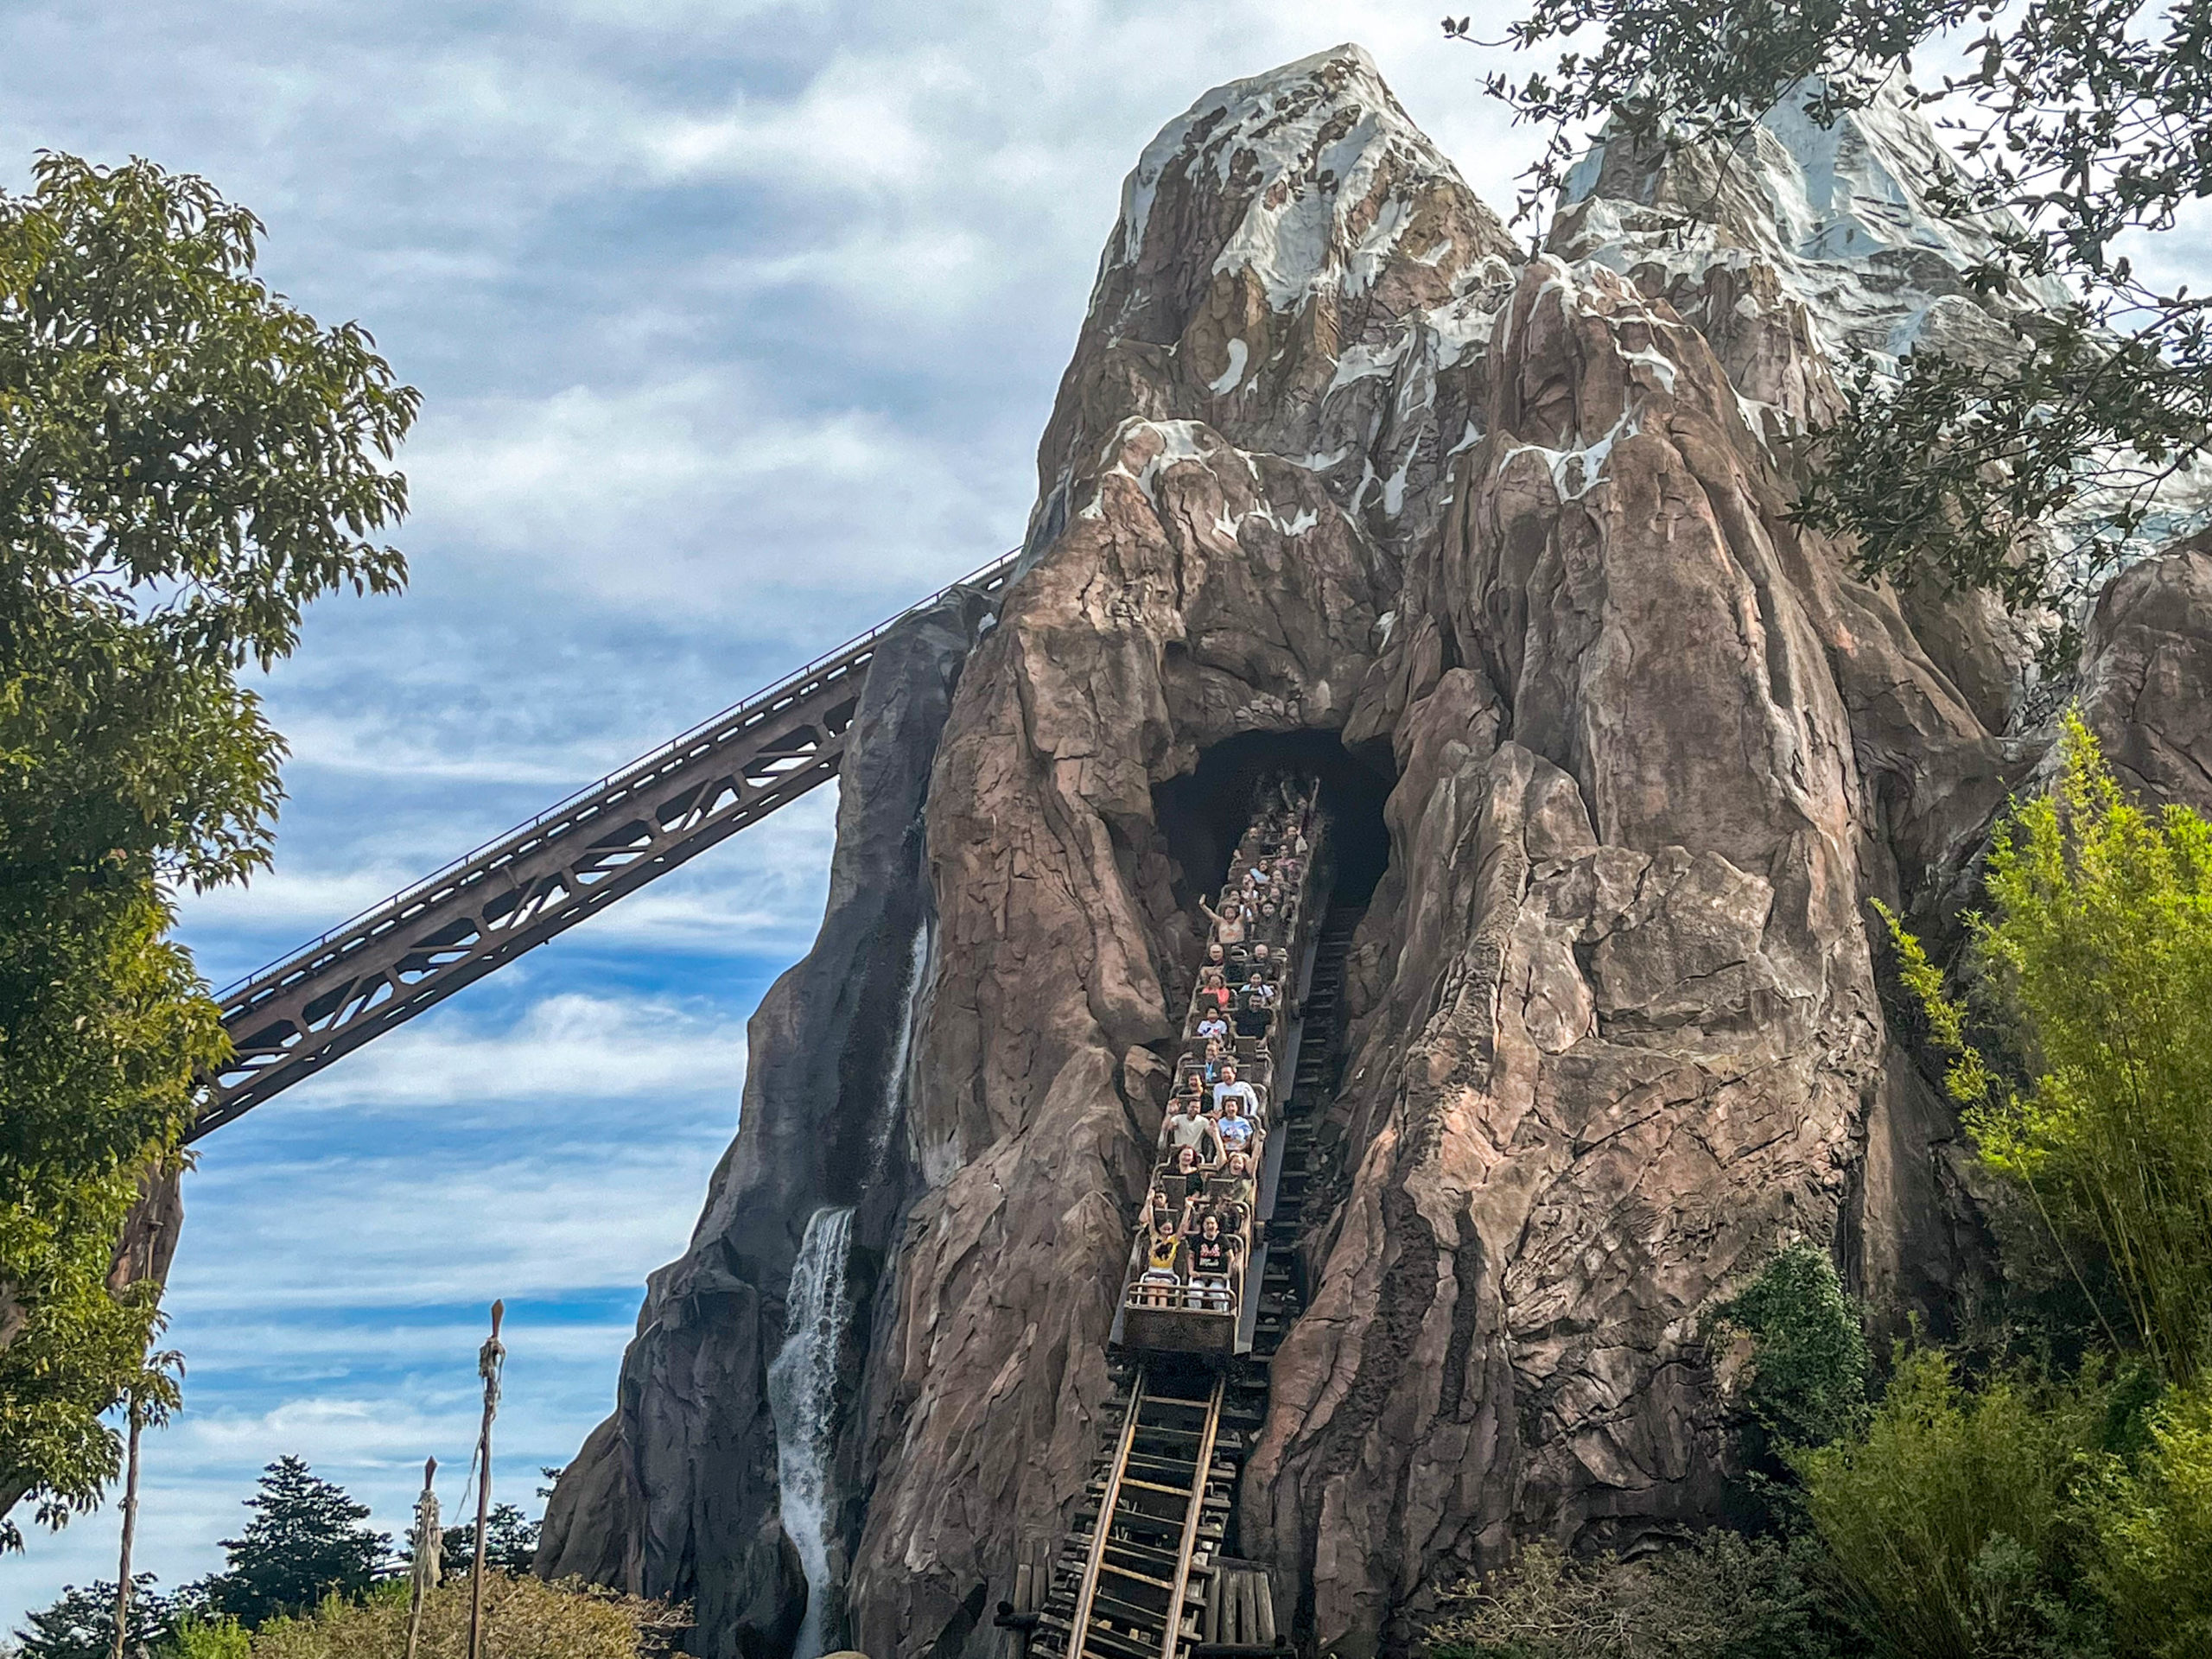
Expedition Everest
The pandemic makes apples-to-apples evaluations impossible, but that’s what my data suggests.
For example, last week’s average wait time for Animal Kingdom attractions was five minutes or 11 percent less than last year.
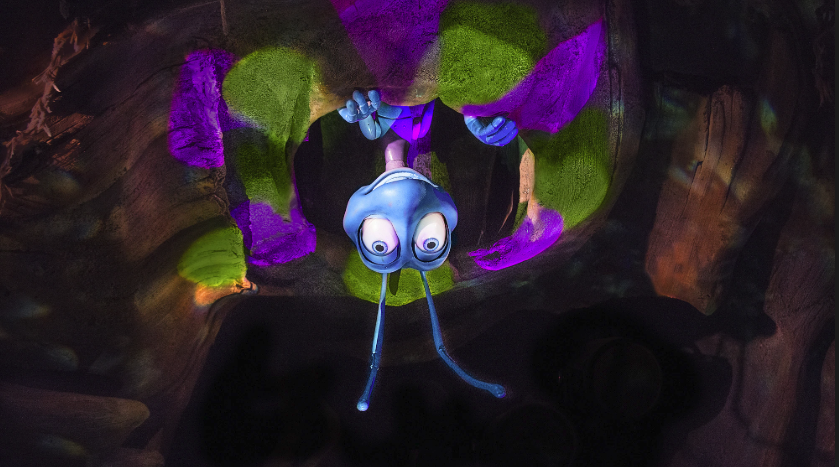
Photo: Disney
Did that behavior hold for this week? Here are the park’s average wait times:
- Avatar Flight of Passage – 93 minutes, up 6
- Kali River Rapids – 61 minutes, up 8
- Na’vi River Journey – 60 minutes, up 3
- Expedition Everest – 45 minutes, up 4
- Adventurers Outpost – 42 minutes, up 2
- DINOSAUR – 28 minutes, down 2
- Kilimanjaro Safaris – 27 minutes, no change
- It’s Tough to Be a Bug! – 10 minutes, no change
- TriceraTop Spin – 10 minutes, up 1
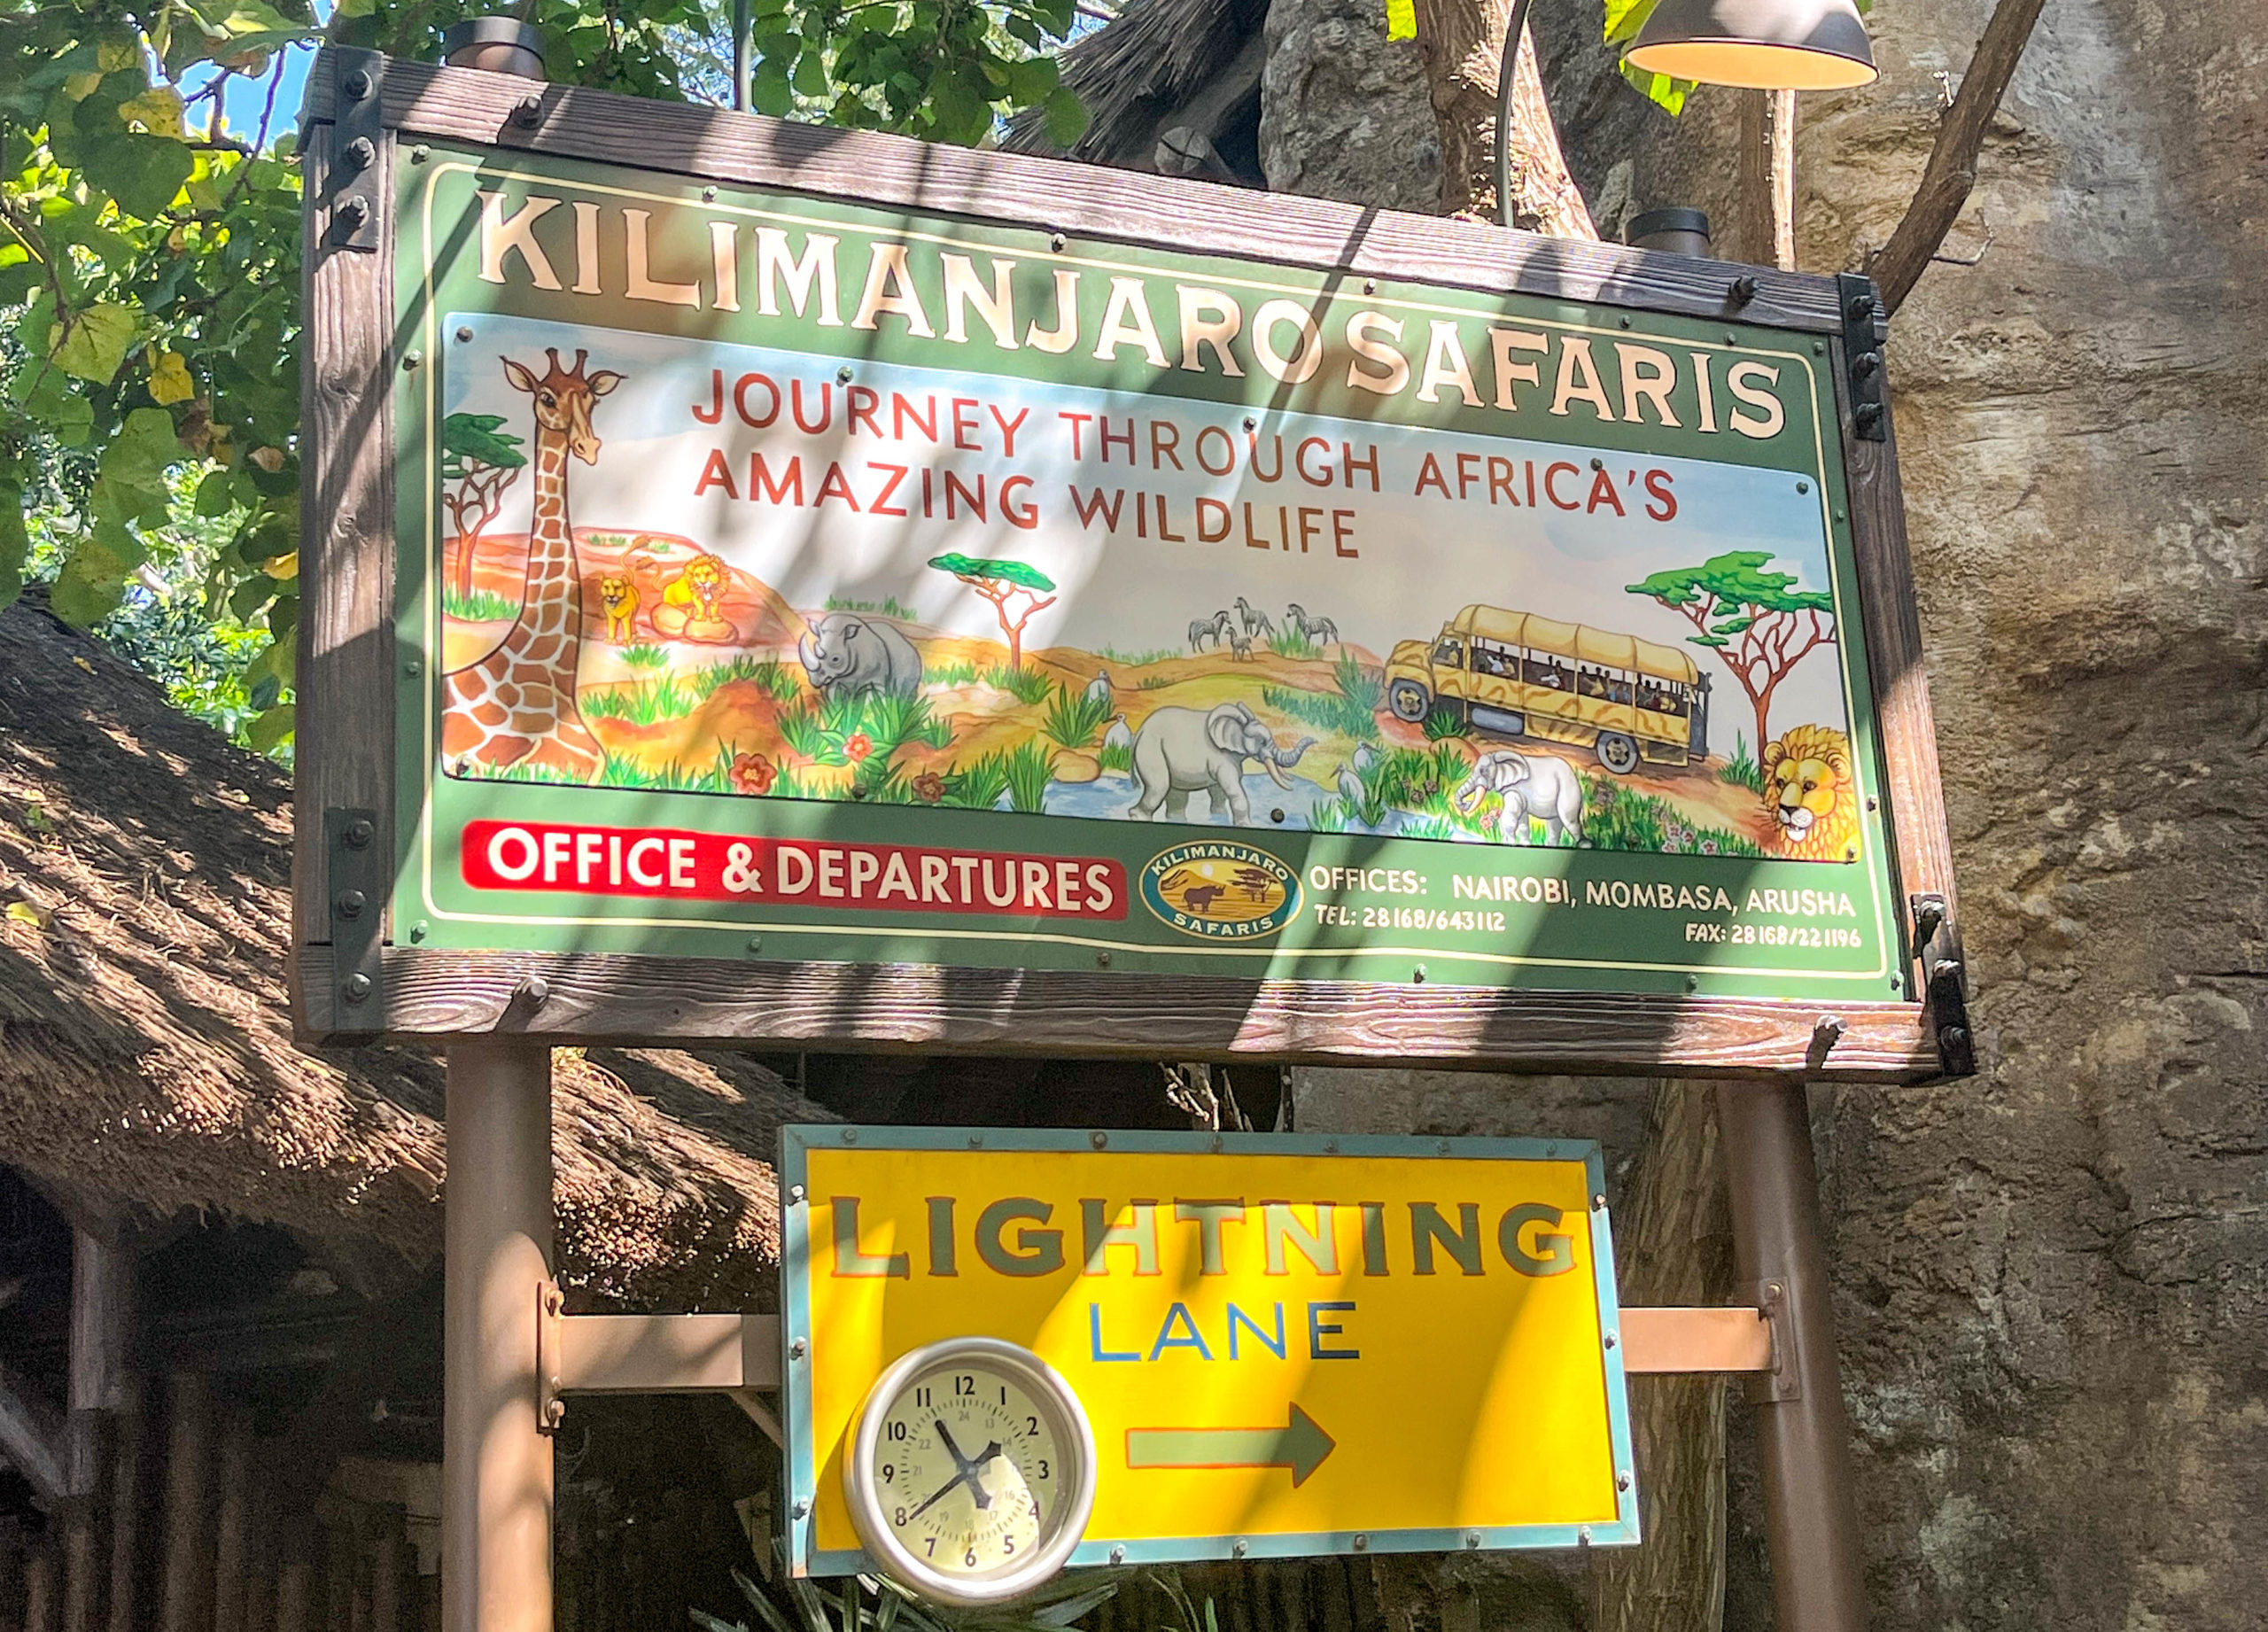
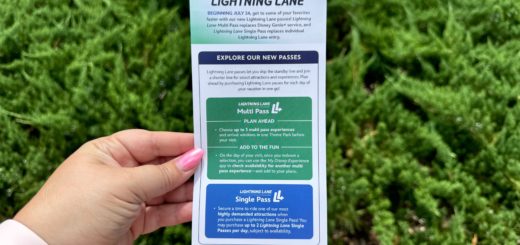
Lightning Lane
Overall, guests waited for an average of 42 minutes per attraction, which is two minutes more than last time.
For the same timeframe last year, Animal Kingdom attractions averaged a wait of 49 minutes.
Disney’s Hollywood Studios
So, you’re already recognizing why the thought process is out there.
The question becomes how much of this is overstated, how much is bad luck, and how much isn’t even Disney.
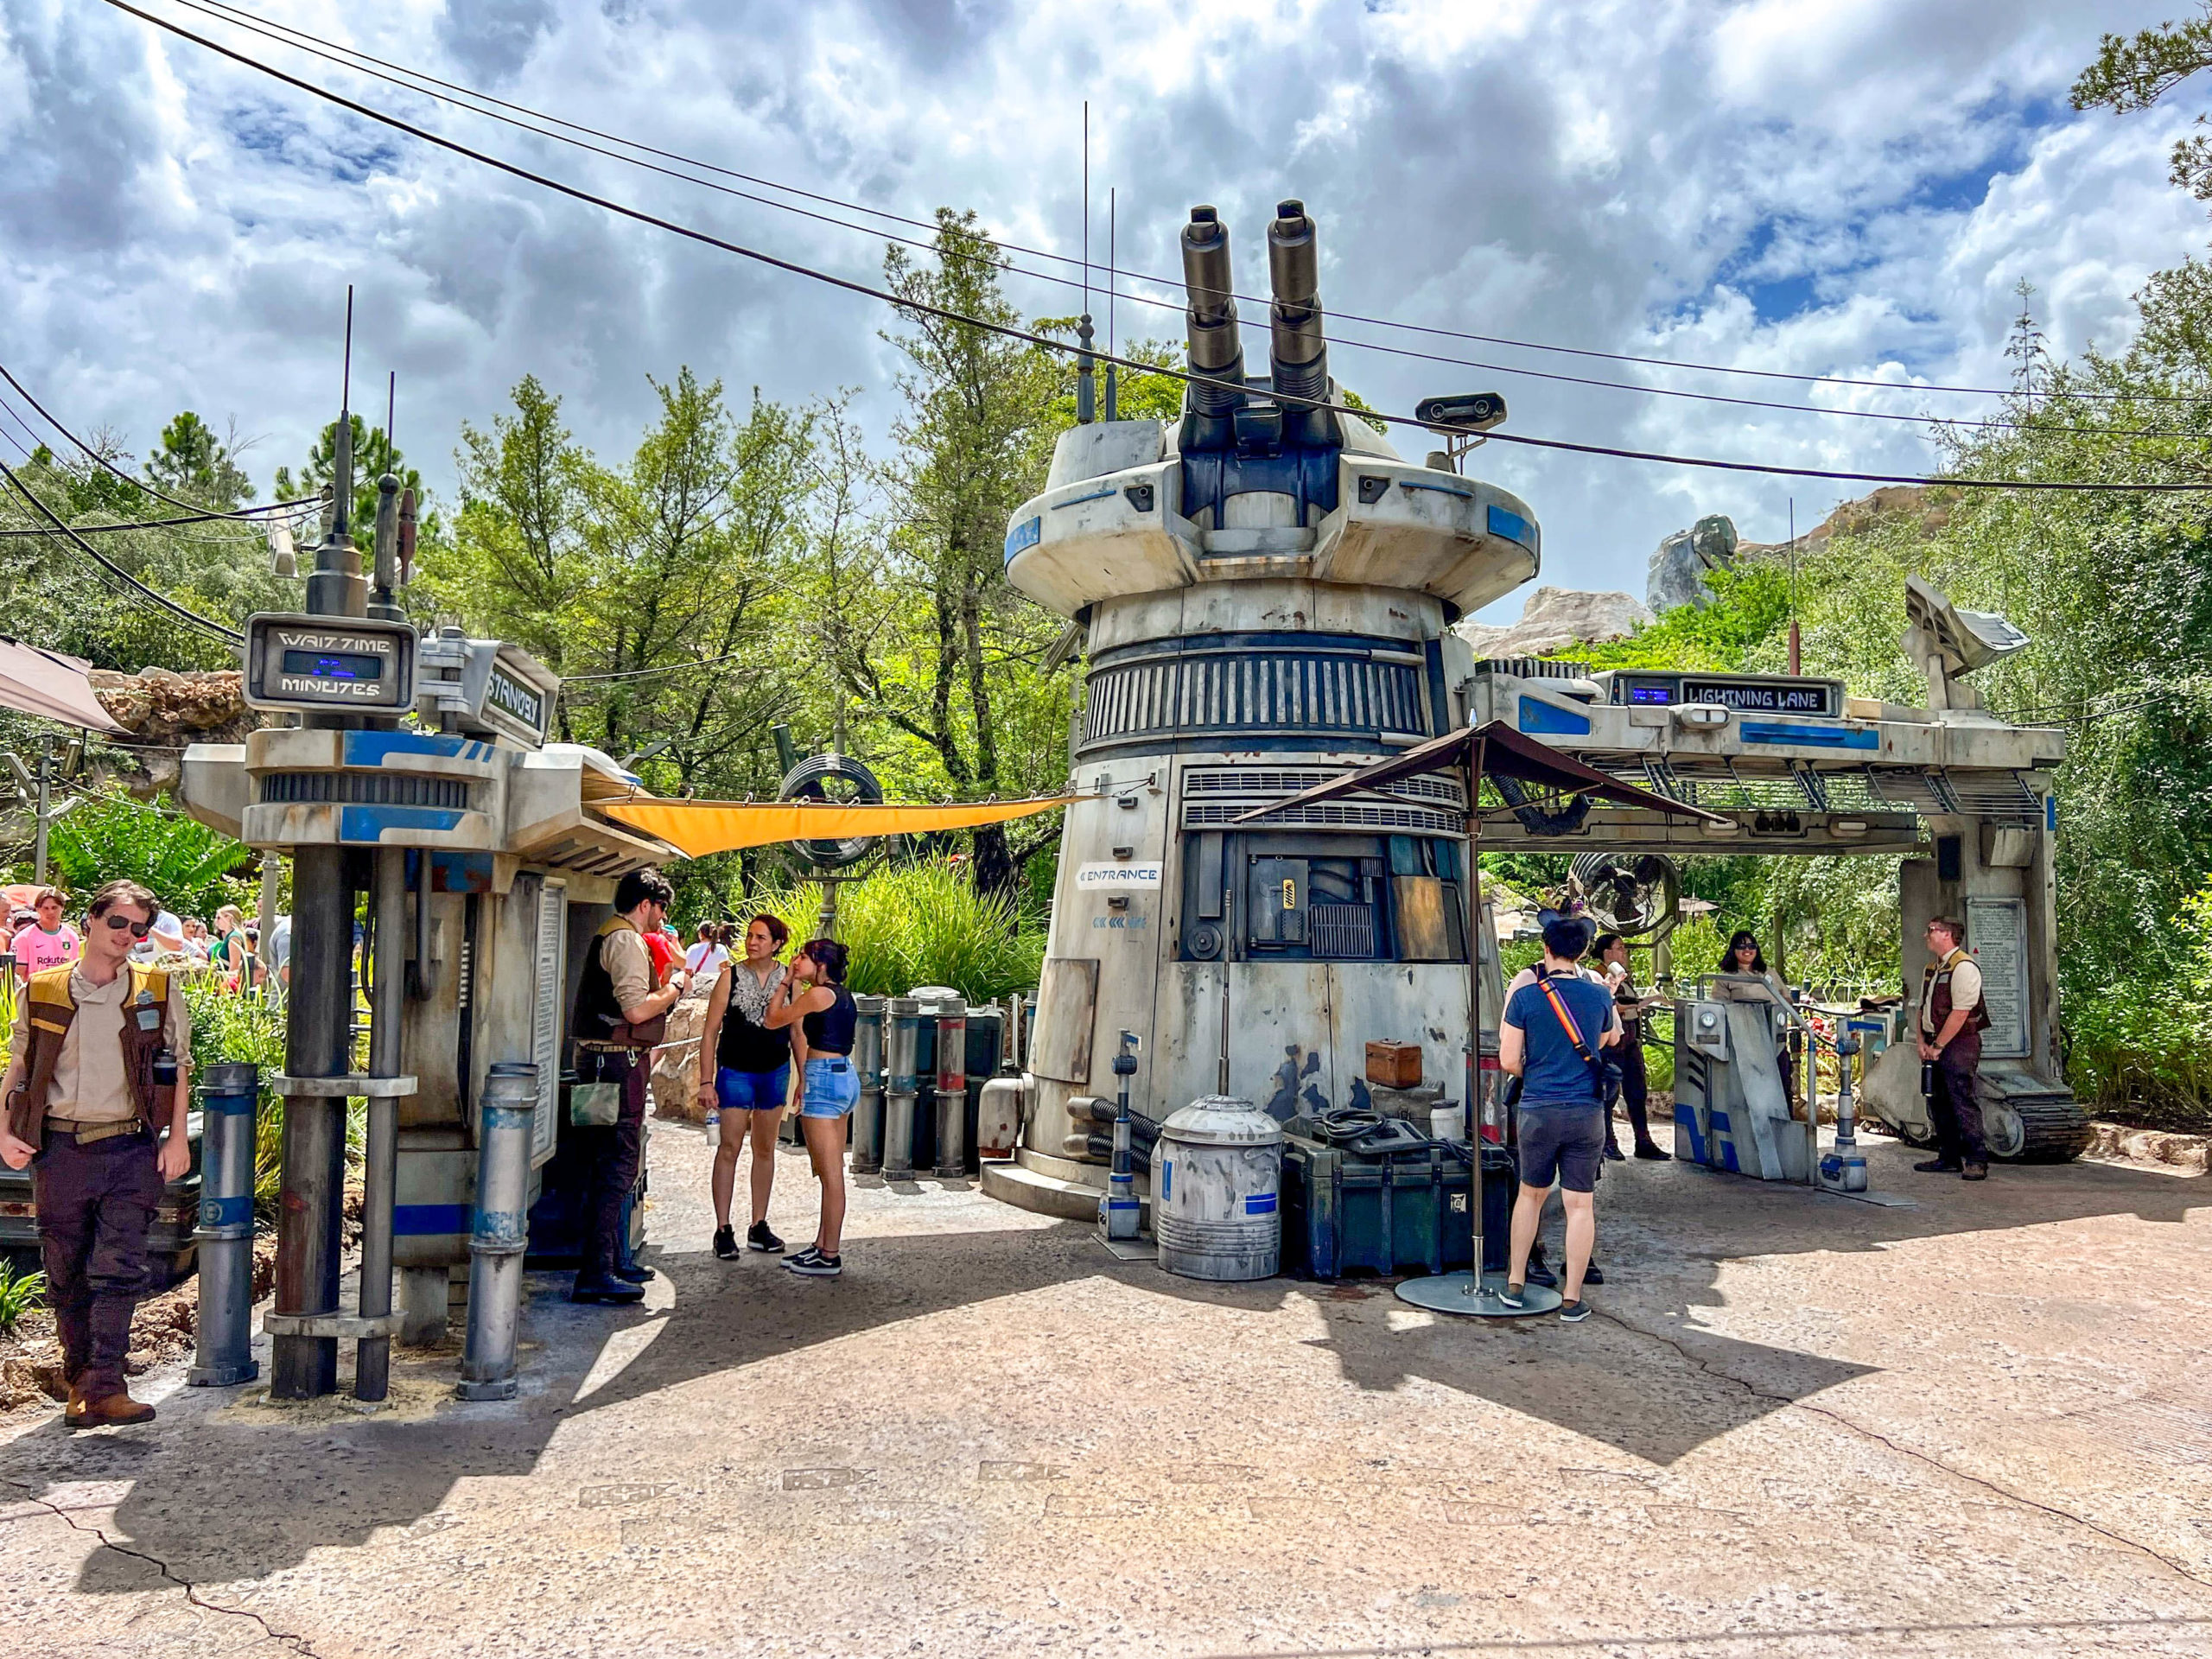
Star Wars: Rise of the Resistance
On the one hand, many tourists haven’t liked the state of Florida lately.
Then, on the bad luck front, we’ve got the blistering heat of Central Florida in July.
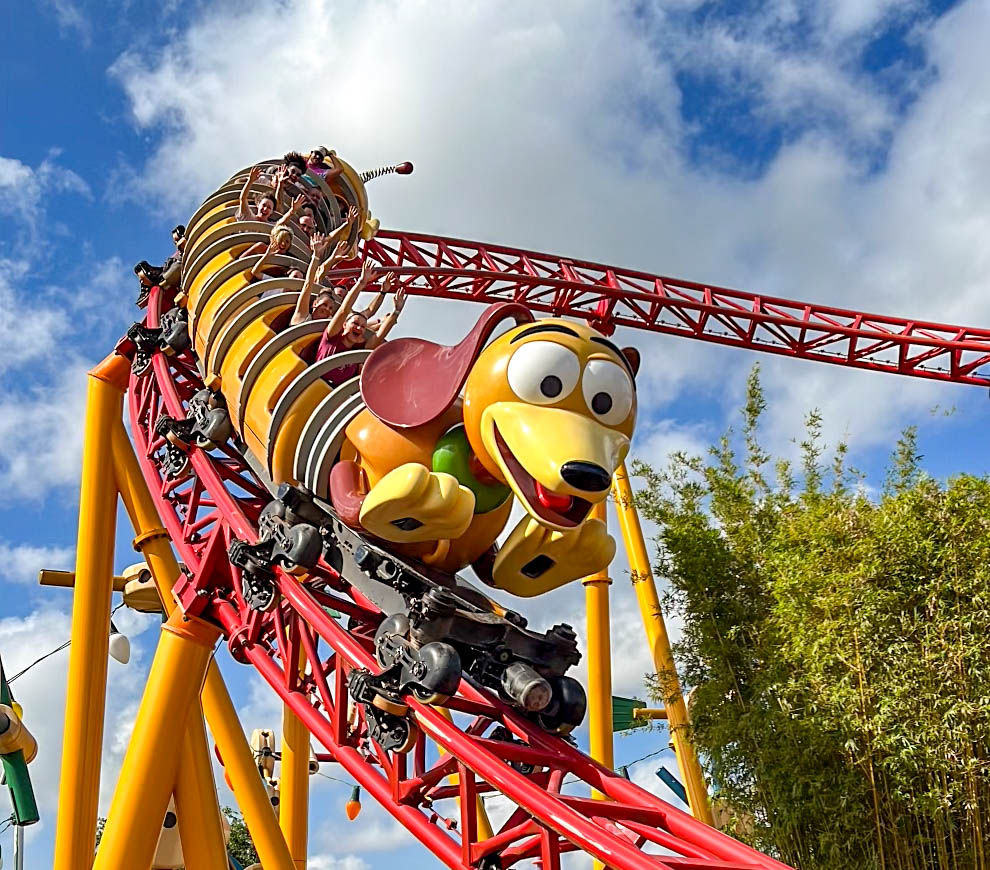
Slinky Dog Dash
Last year was statistically among the worst on record, but 2024 might have it beat.
Nobody wants to be out in the sun in 100-degree weather, but many of us do it anyway because we love Disney.
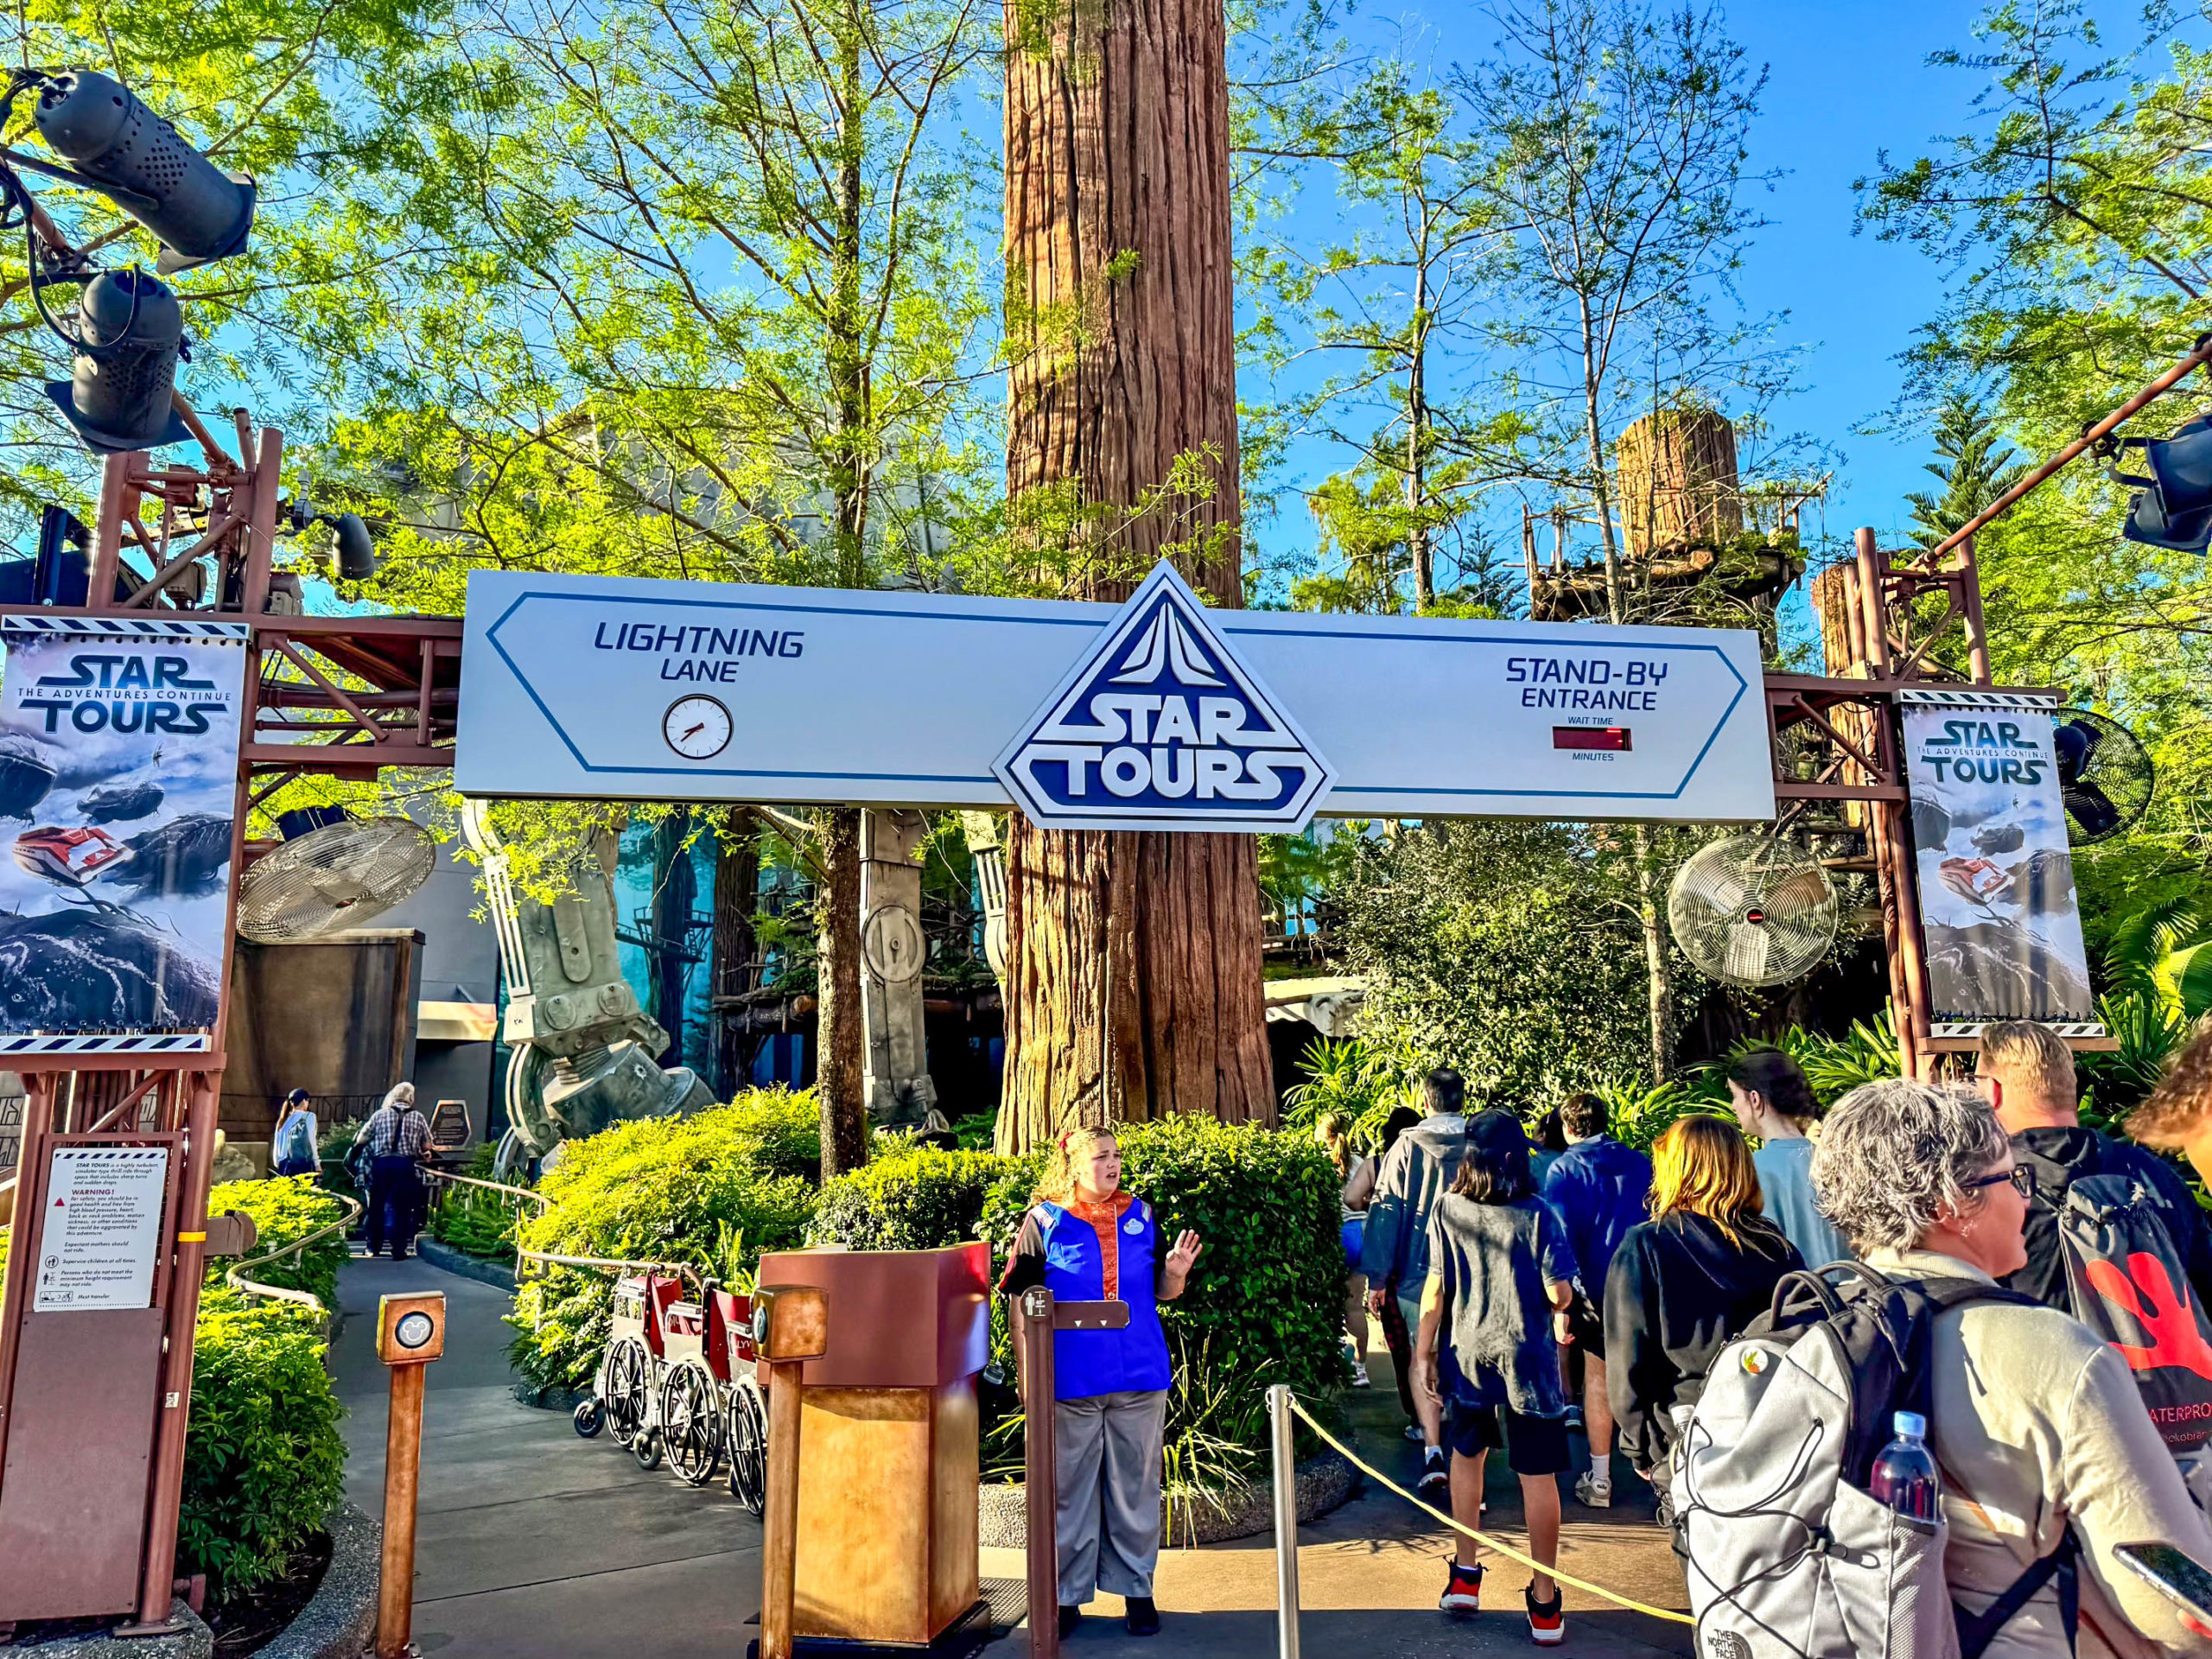
Star Tours
We’ve got lots of factors in play here as we evaluate the wait times at Hollywood Studios last week.
- Slinky Dog Dash – 74 minutes, down 2
- Rock ‘n’ Roller Coaster Starring Aerosmith – 67 minutes, up 2
- Millennium Falcon: Smugglers Run – 65 minutes, up 5
- Star Wars: Rise of the Resistance – 64 minutes, down 2
- Twilight Zone Tower of Terror – 57 minutes, up 6
- Mickey & Minnie’s Runaway Railway – 54 minutes, up 2
- Toy Story Mania! – 52 minutes, down 1
- Red Carpet Dreams – 38 minutes, up 1
- Alien Swirling Saucers – 37 minutes, no change
- Lightning McQueen’s Racing Academy – 15 minutes, no change
- Star Tours – The Adventures Continue – 15 minutes, down 2
- Celebrity Spotlight – 14 minutes, down 2
- Muppet*Vision 3D – 10 minutes, no change
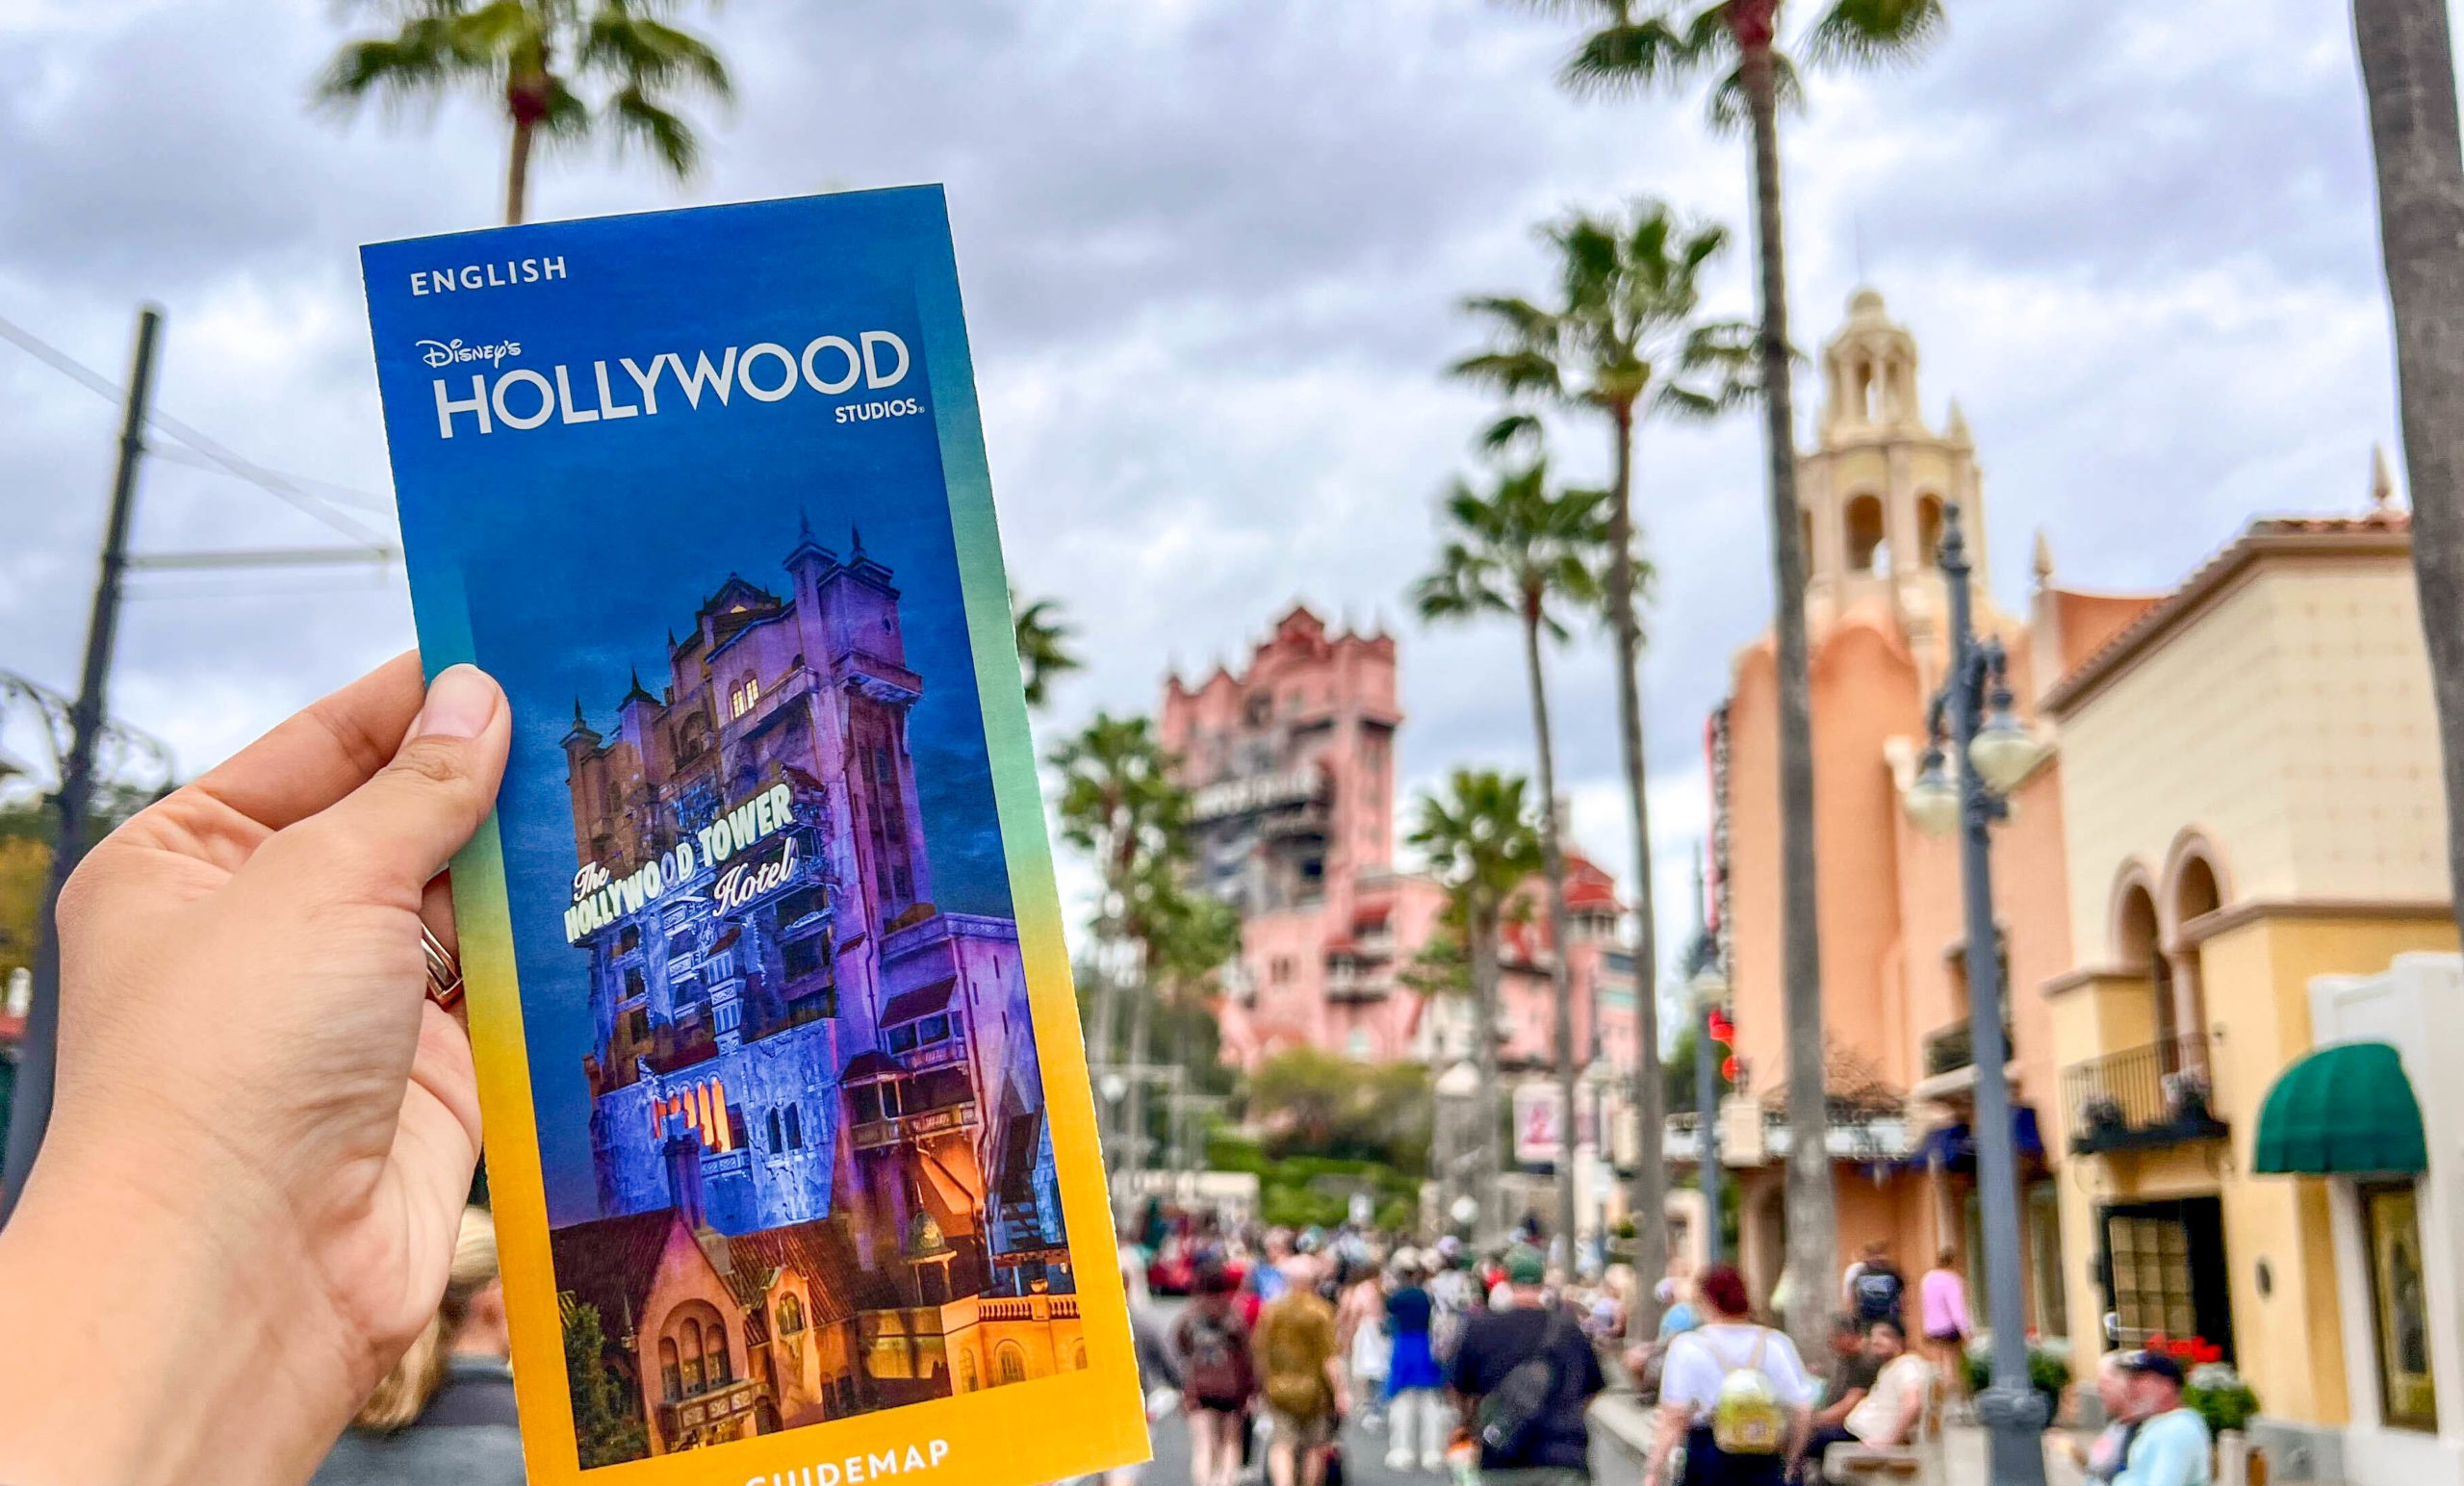
Hollywood Studios
Overall, Hollywood Studios attractions averaged a wait of 39 minutes, which is one minute more than last time.
During the third week of July 2023, the average wait time was 45 minutes.
EPCOT
Just to be clear, the first two parks we’ve studied are down 6.5 minutes from the same time last year.
Some of that could be improved crowd management at the parks. But there ARE signs of smaller park attendance.
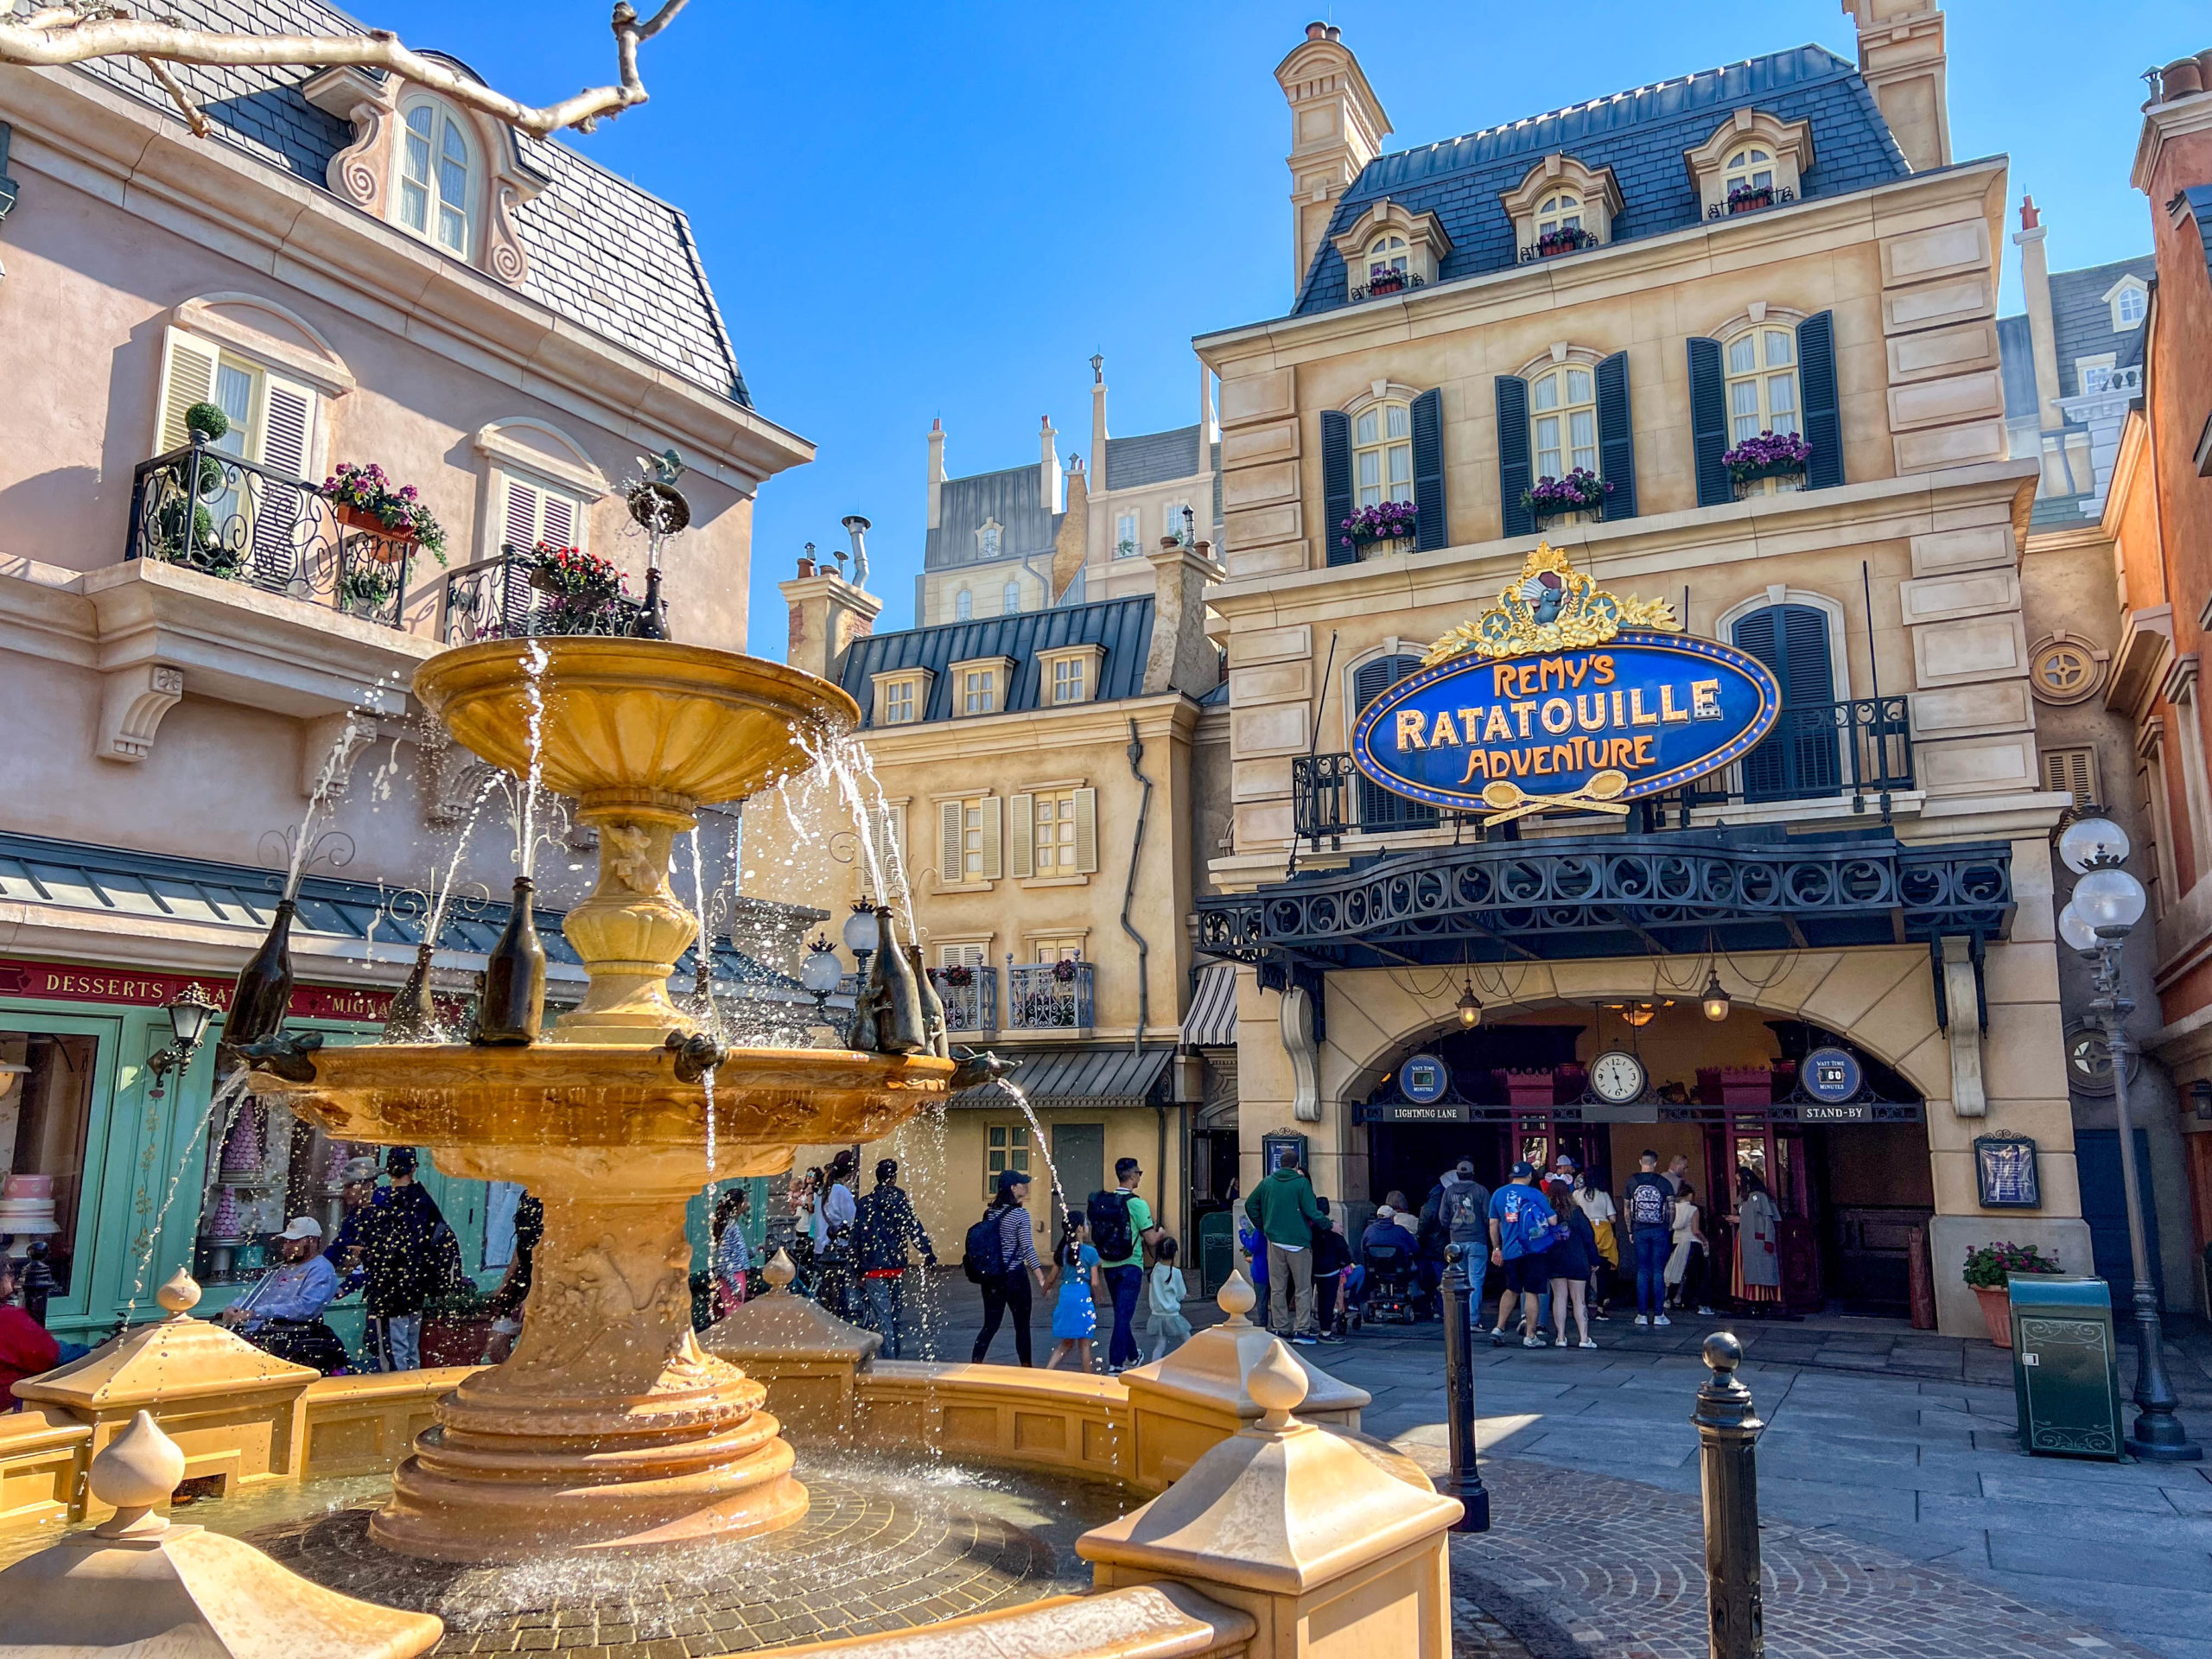
Remy’s Ratatouille Adventure
Is that the case at EPCOT as well? Here are the park’s average wait times:
- Remy’s Ratatouille Adventure – 54 minutes, down 8
- Frozen Ever After – 52 minutes, down 7
- Soarin’ Around the World – 38 minutes, down 1
- Meet Mickey & Friends – 34 minutes, up 2
- Mission: SPACE – 33 minutes, up 4
- Royal Sommerhus – 29 minutes, no change
- Spaceship Earth – 19 minutes, up 1
- Turtle Talk with Crush – 18 minutes, down 1
- Journey into Imagination with Figment – 14 minutes, up 3
- Gran Fiesta Tour Starring the Three Caballeros – 12 minutes, no change
- Living with the Land – 12 minutes, up 1
- The Seas with Nemo & Friends – 12 minutes, no change
Frozen Ever After
Overall, EPCOT attractions averaged a wait of 27 minutes, which is one minute less than last time.
For the same week in 2023, the average wait was 32 minutes.
Soarin’
To be fair, Test Track had the longest wait time at 72 minutes, though.
Without that consideration, 2024 and 2023 would be closer than the first two parks we’ve discussed.
Magic Kingdom
I think you’re getting the point.
Magic Kingdom
So, here are Magic Kingdom’s average wait times:
- Seven Dwarfs Mine Train – 63 minutes, no change
- Space Mountain – 54 minutes, up 3
- Princess Fairytale Hall – 51 minutes, up 4
- Big Thunder Mountain Railroad – 43 minutes, down 3
- Jungle Cruise – 43 minutes, down 1
- Haunted Mansion – 42 minutes, up 2
- Town Square Theater – 40 minutes, up 3
- The Many Adventures of Winnie the Pooh – 36 minutes, no change
- Buzz Lightyear’s Space Ranger Spin – 35 minutes, up 2
- Ariel’s Grotto – 32 minutes, no change
- Pete’s Silly Sideshow – 30 minutes, down 1
- Pirates of the Caribbean – 30 minutes, up 2
- Astro Orbiter – 28 minutes, no change
- It’s a Small World – 28 minutes, up 3
- Enchanted Tales with Belle – 27 minutes, up 2
- Under the Sea ~ Journey of the Little Mermaid – 27 minutes, up 6
- The Barnstormer – 21 minutes, up 1
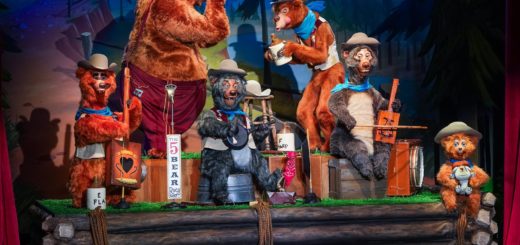
- Country Bear Musical Jamboree – 18 minutes, n/a
- The Magic Carpets of Aladdin – 18 minutes, up 1
- Tomorrowland Speedway – 18 minutes, down 5
- Monsters, Inc. Laugh Floor – 17 minutes, up 1
- Mickey’s PhilharMagic – 16 minutes, down 2
- Dumbo the Flying Elephant — 15 minutes, up 2
- Mad Tea Party – 12 minutes, no change
- Tomorrowland Transit Authority PeopleMover – 12 minutes, down 1
- Prince Charming Regal Carrousel – 11 minutes, no change
- Walt Disney World Railroad – 11 minutes, down 1
- Walt Disney’s Carousel of Progress – 5 minutes, no change
Final Thoughts
Overall, the average wait time for Magic Kingdom attractions was 26 minutes, one minute less than last time.
At the same time last year, the park’s attractions averaged a wait of 34 minutes.

Tiana’s Bayou Adventure
So, yes, all four Walt Disney World theme parks had longer wait times last year than this year.
That fact certainly lends credence to the thought that the parks are less crowded this July.
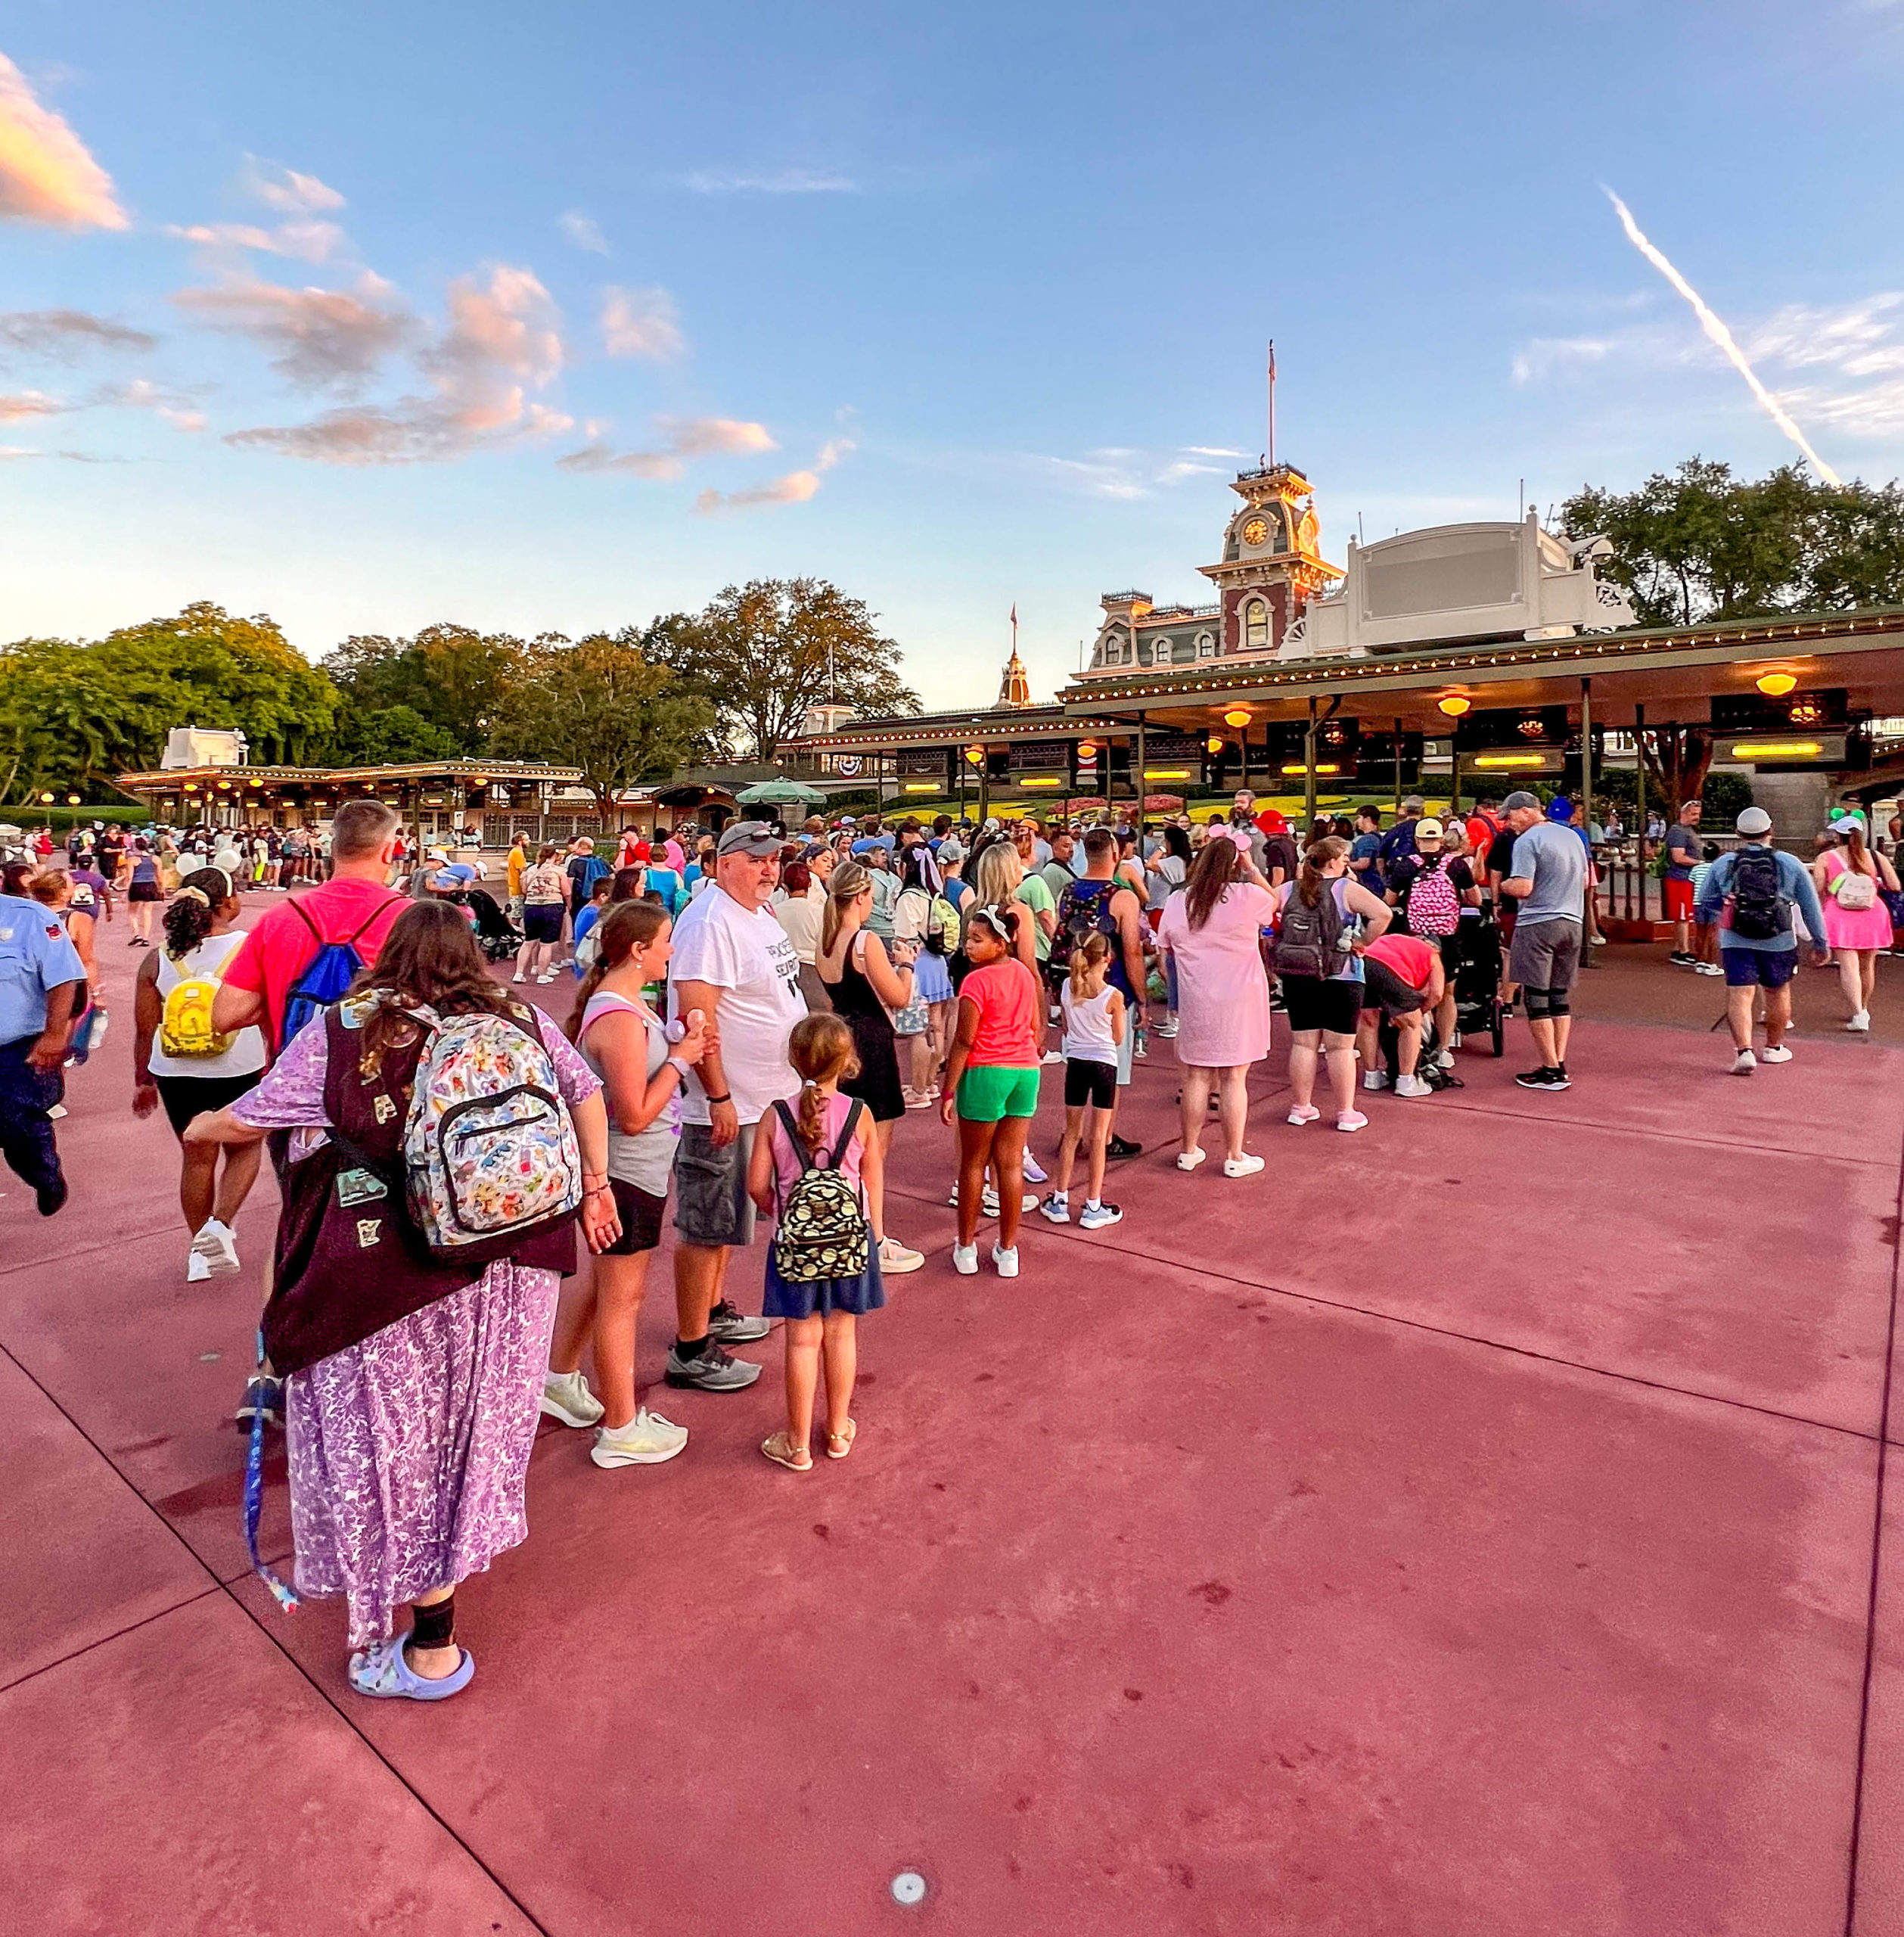
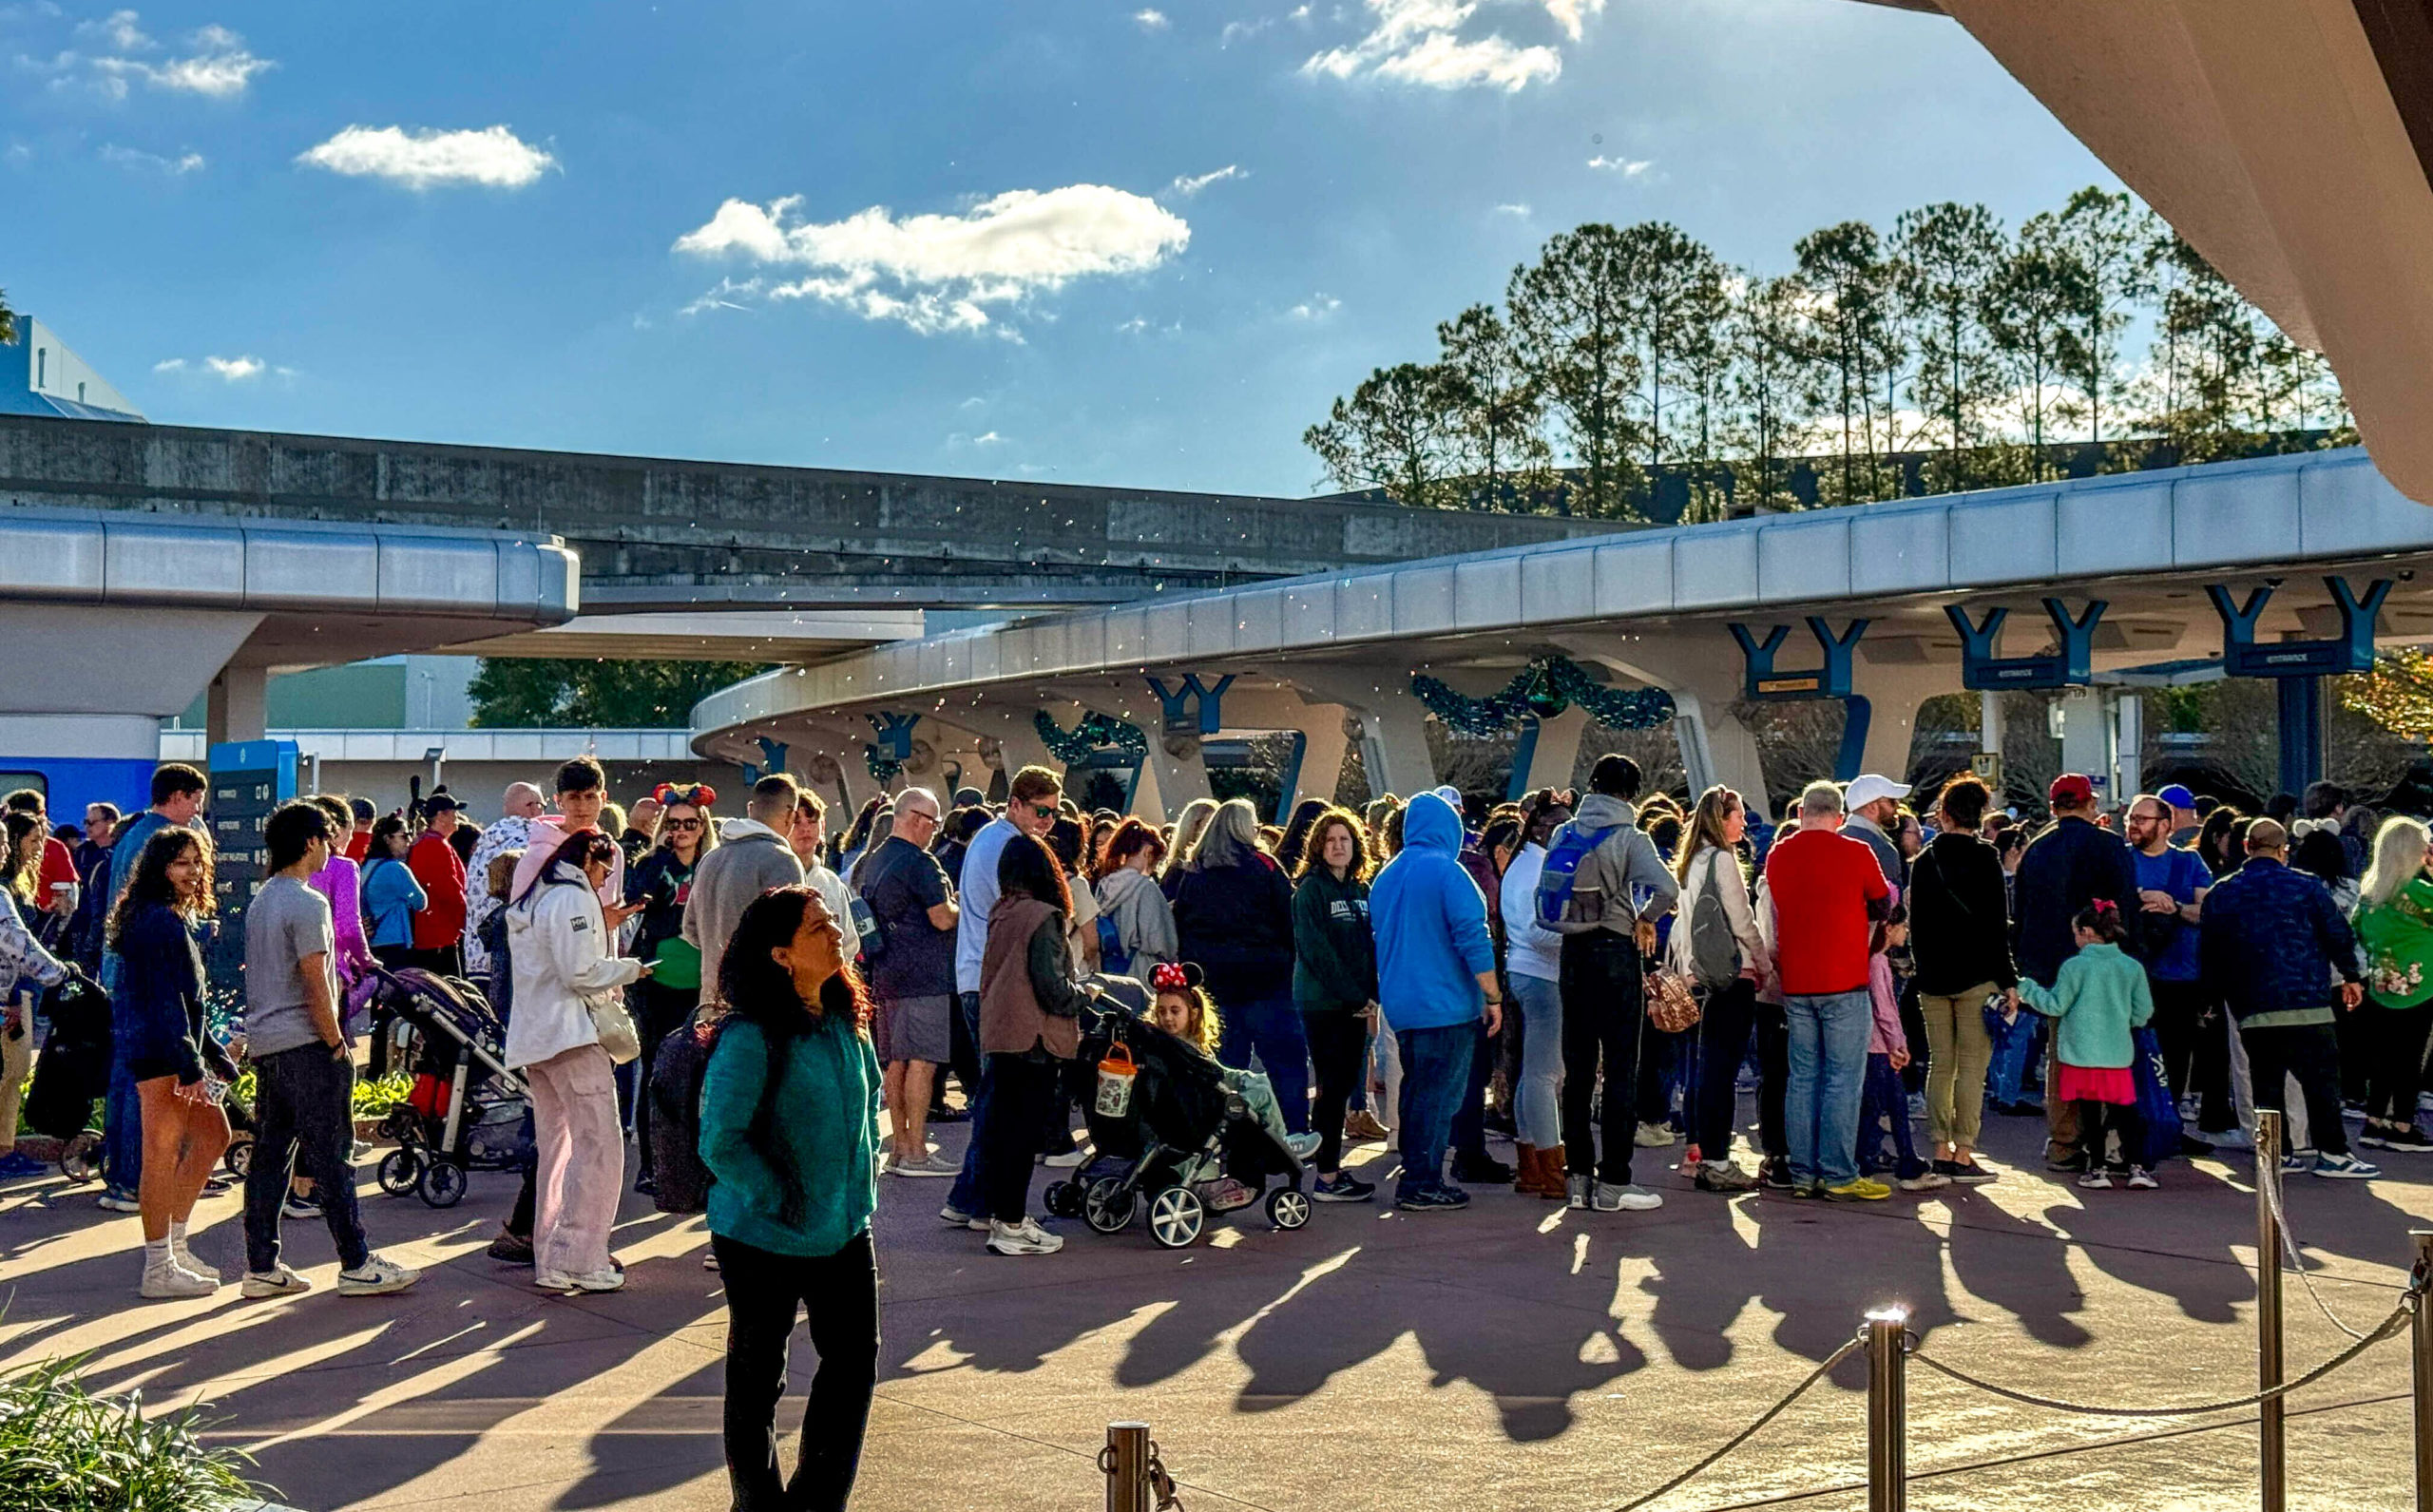
Entrance gates
We’ll almost assuredly learn more when Disney hosts its fiscal earnings call on August 7th.
Right now, I’d expect Disney executives to indicate that attendance was soft this quarter.
EPCOT lines
Then again, we never really know until the company files its SEC documents.
![]()
Thanks for visiting MickeyBlog.com! Want to go to Disney? For a FREE quote on your next Disney vacation, please fill out the form below, and one of the agents from MickeyTravels, a Diamond Level Authorized Disney Vacation Planner, will be in touch soon!