Walt Disney World Wait Times for End of April 2024
As April winds down, we enter the final couple of “slower” weeks at the parks, at least theoretically.
Nothing at Disney theme parks is ever slow these days. It’s just slightly less crowded.
Did that statement apply to last week’s park guests? Let’s find out!
Here are the Walt Disney World wait times for the end of April 2024.
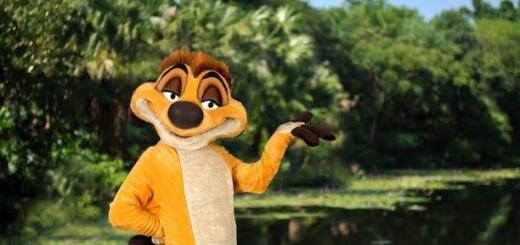
Disney’s Animal Kingdom
We had something last week that may have impacted attendance, at least slightly.
Earth Day occurred on Monday, April 22nd, and it happens to be Animal Kingdom’s anniversary date as well.
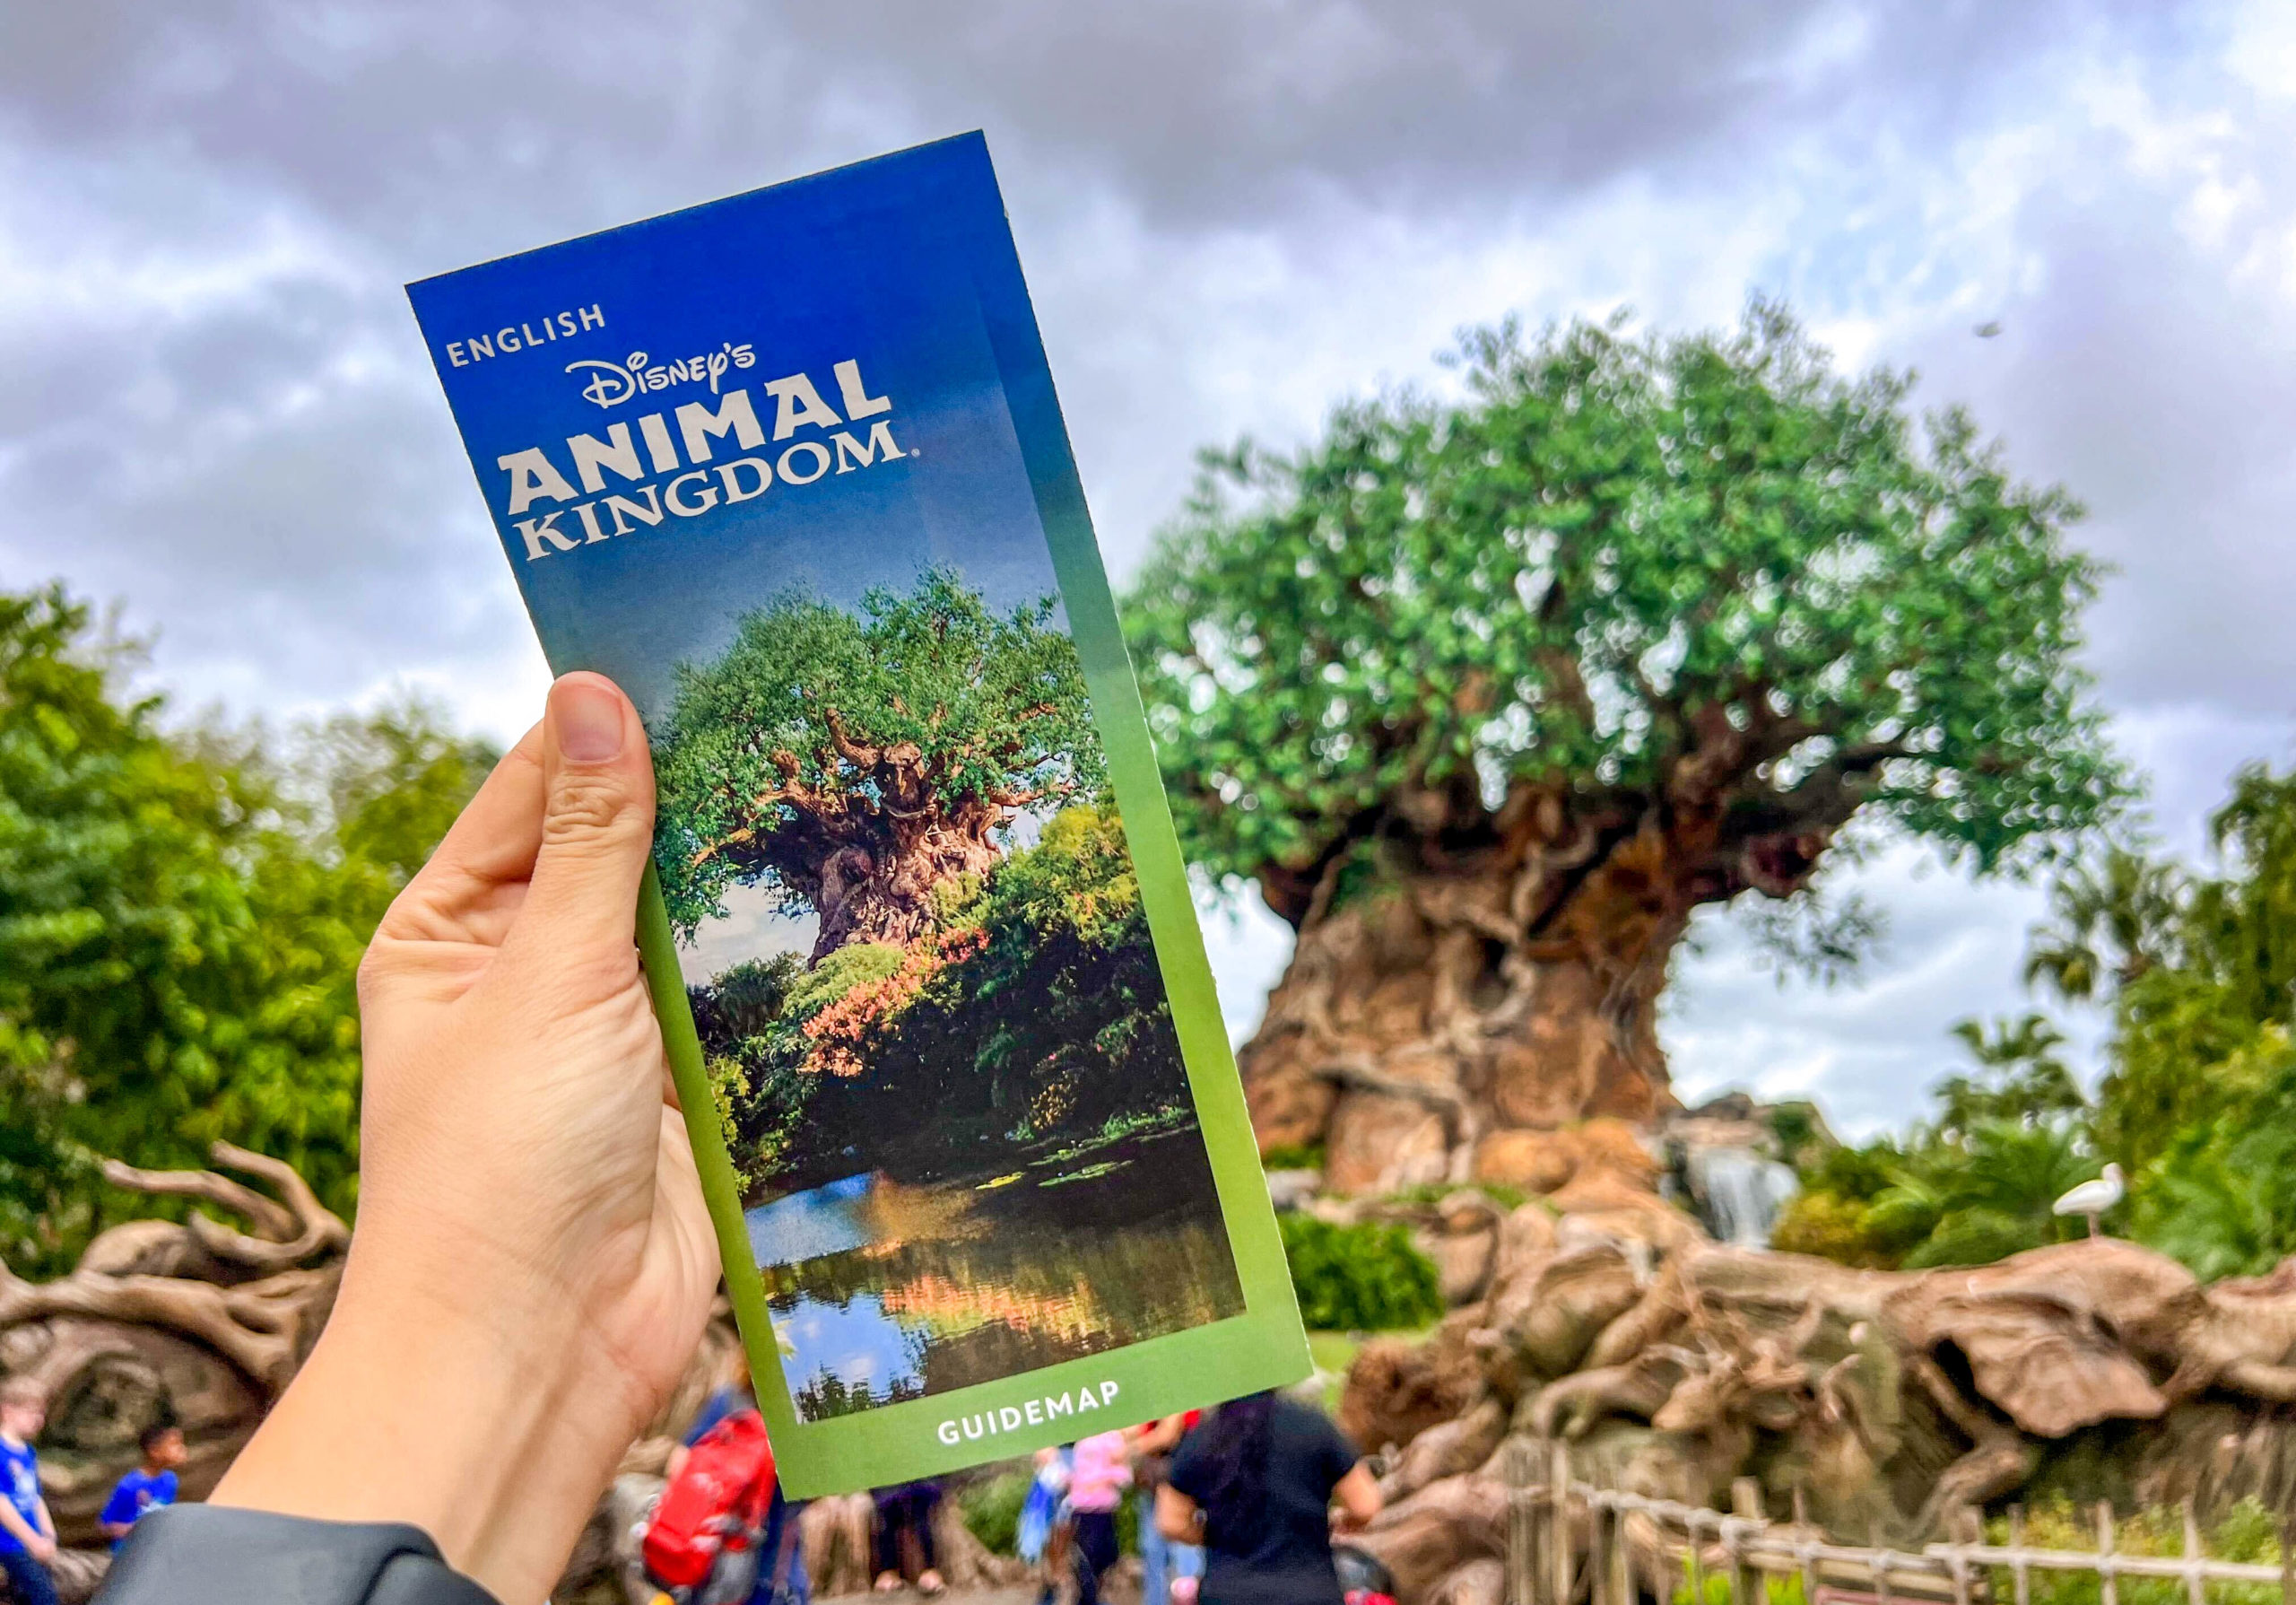
For this reason, management went ahead and celebrated Earth Week at Animal Kingdom.
Did that move the needle on attendance? Here were the average attraction wait times last week:
- Avatar Flight of Passage – 94 minutes, up 6
- Na’vi River Journey – 66 minutes, up 9
- Adventurers Outpost – 55 minutes, up 5
- Expedition Everest – 46 minutes, up 13
- Kilimanjaro Safaris – 46 minutes, up 6
- Kali River Rapids – 36 minutes, no change
- DINOSAUR – 27 minutes, up 5
- It’s Tough to Be a Bug – 15 minutes, up 5
- TriceraTop Spin – 12 minutes, up 3

Photo: Disney
Overall, Animal Kingdom guests stood in line for an average of 44 minutes, which is six minutes or 16 percent more than last time.
What we don’t know yet is whether the entirety of Disney World was up from last week.
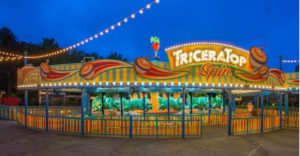
Photo: Disney
Animal Kingdom’s surge could be specific to Earth Week activities, or that aspect could be wildly overblown. We’re about to find out!
Disney’s Hollywood Studios
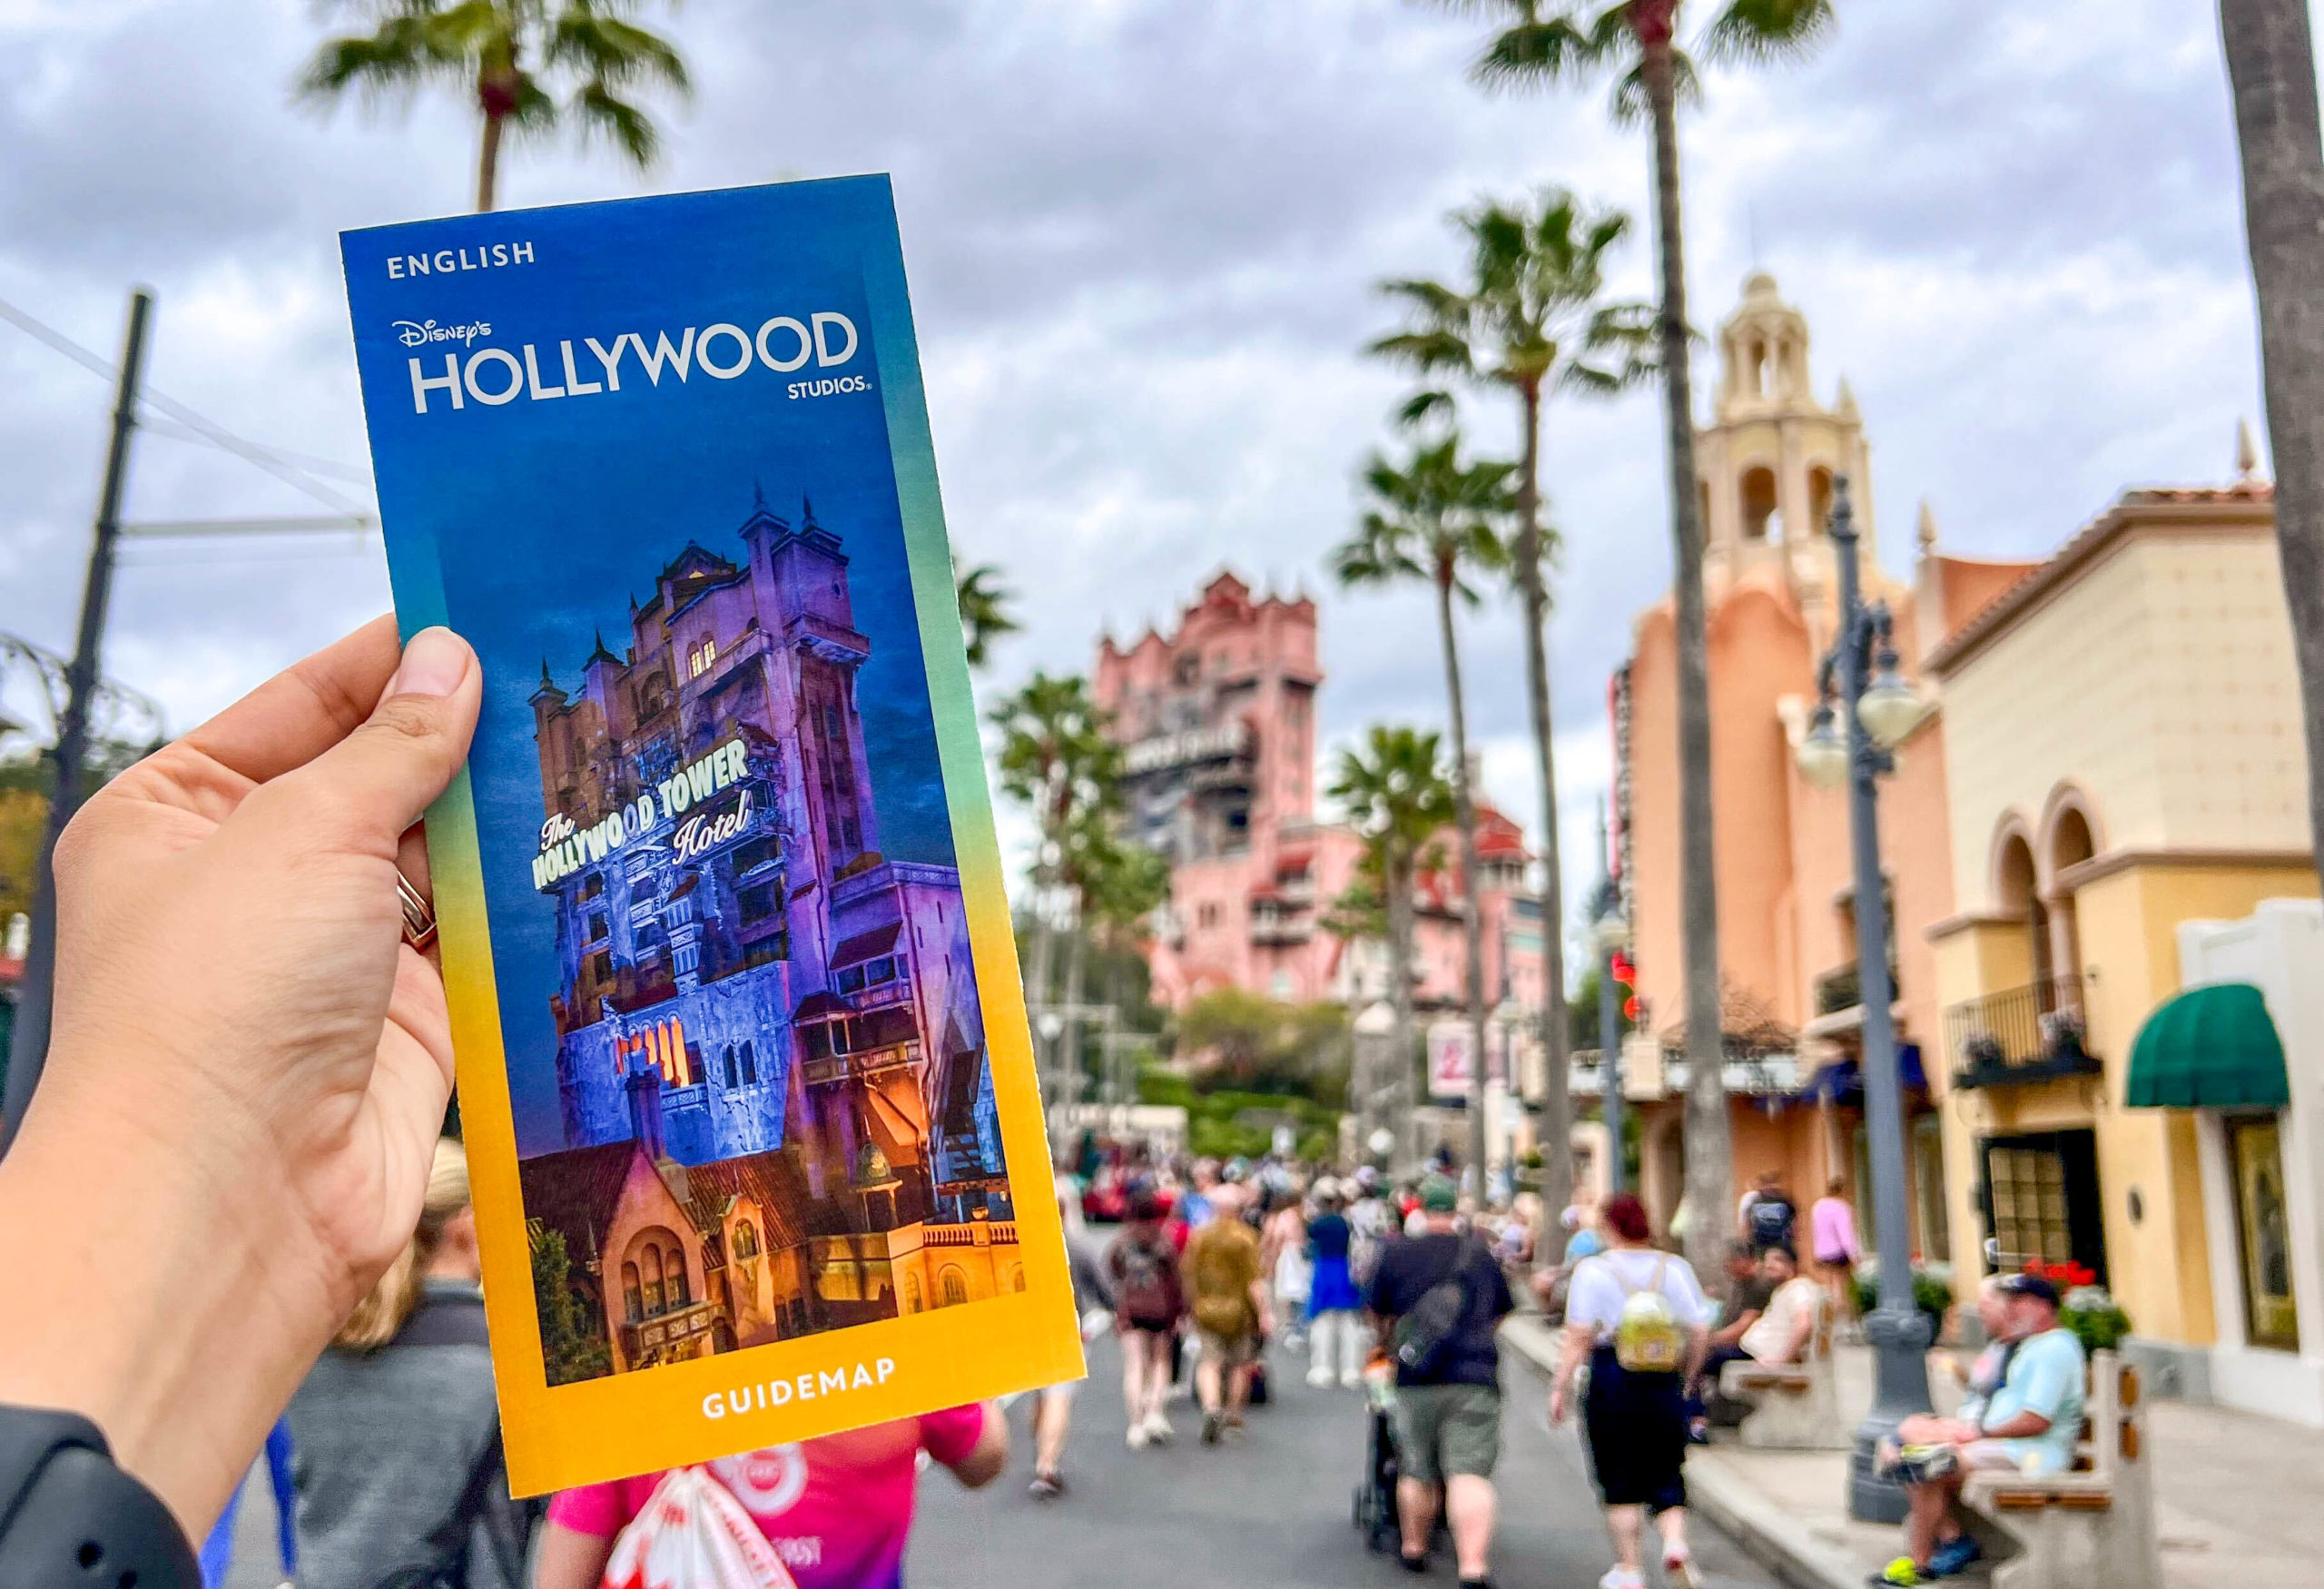
Hollywood Studios
I deem Hollywood Studios the most chaotic of the four Disney World gates. Anything can happen here on a given day.
For that reason, the daily wait times prove an endless source of fascination to me, but they generally even out in the end.
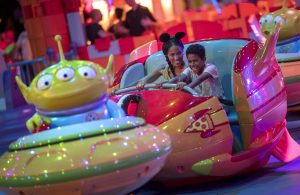
Photo: Disney
What I mean by that is the weekly wait times aren’t as dramatic in their fluctuations. Was last week any different?
Here are Animal Kingdom’s wait times for the past seven days:
- Slinky Dog Dash – 97 minutes, up 14
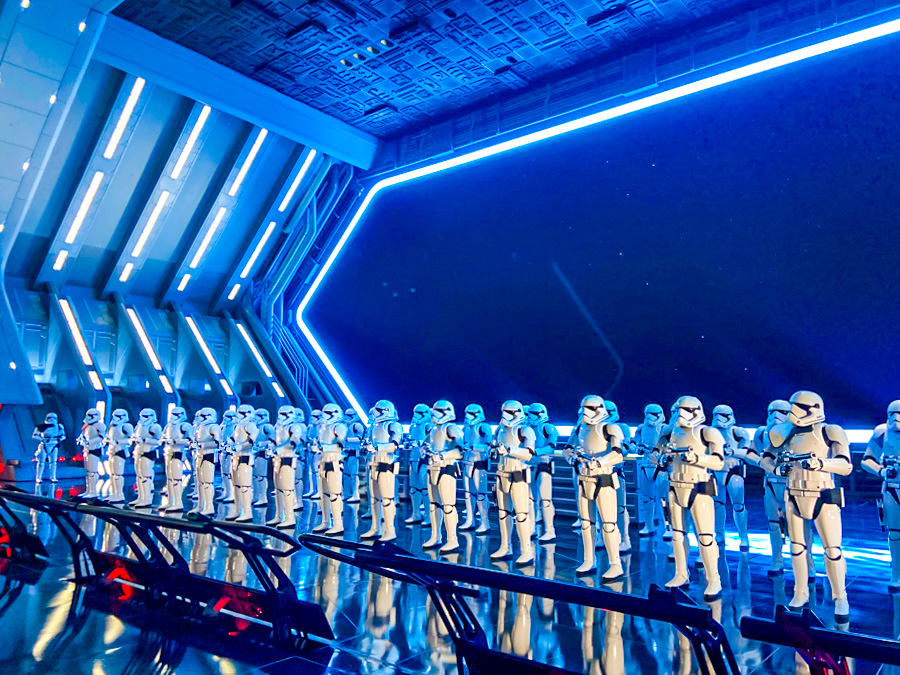
- Star Wars: Rise of the Resistance – 80 minutes, up 4
- Millennium Falcon: Smugglers Run – 64 minutes, up 2
- Mickey & Minnie’s Runaway Railway – 62 minutes, up 6
- Twilight Zone Tower of Terror – 60 minutes, down 1
- Toy Story Mania! – 55 minutes, up 1
- Red Carpet Dreams – 43 minutes, up 4
- Alien Swirling Saucers – 42 minutes, up 6
- Celebrity Spotlight – 24 minutes, up 4
- Lightning McQueen’s Racing Academy – 17 minutes, up 2
- Star Tours – The Adventures Continue! – 17 minutes, down 1
- Muppet*Vision 3D – 10 minutes, no change
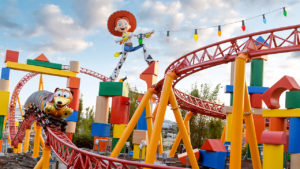
Image Credit: Disney
Overall, Hollywood Studios visitors waited for an average of 43 minutes, or eight percent more than last week.
I’ve got a couple of points to make here. The first is that Slinky Dog Dash has become the longest wait at the park.
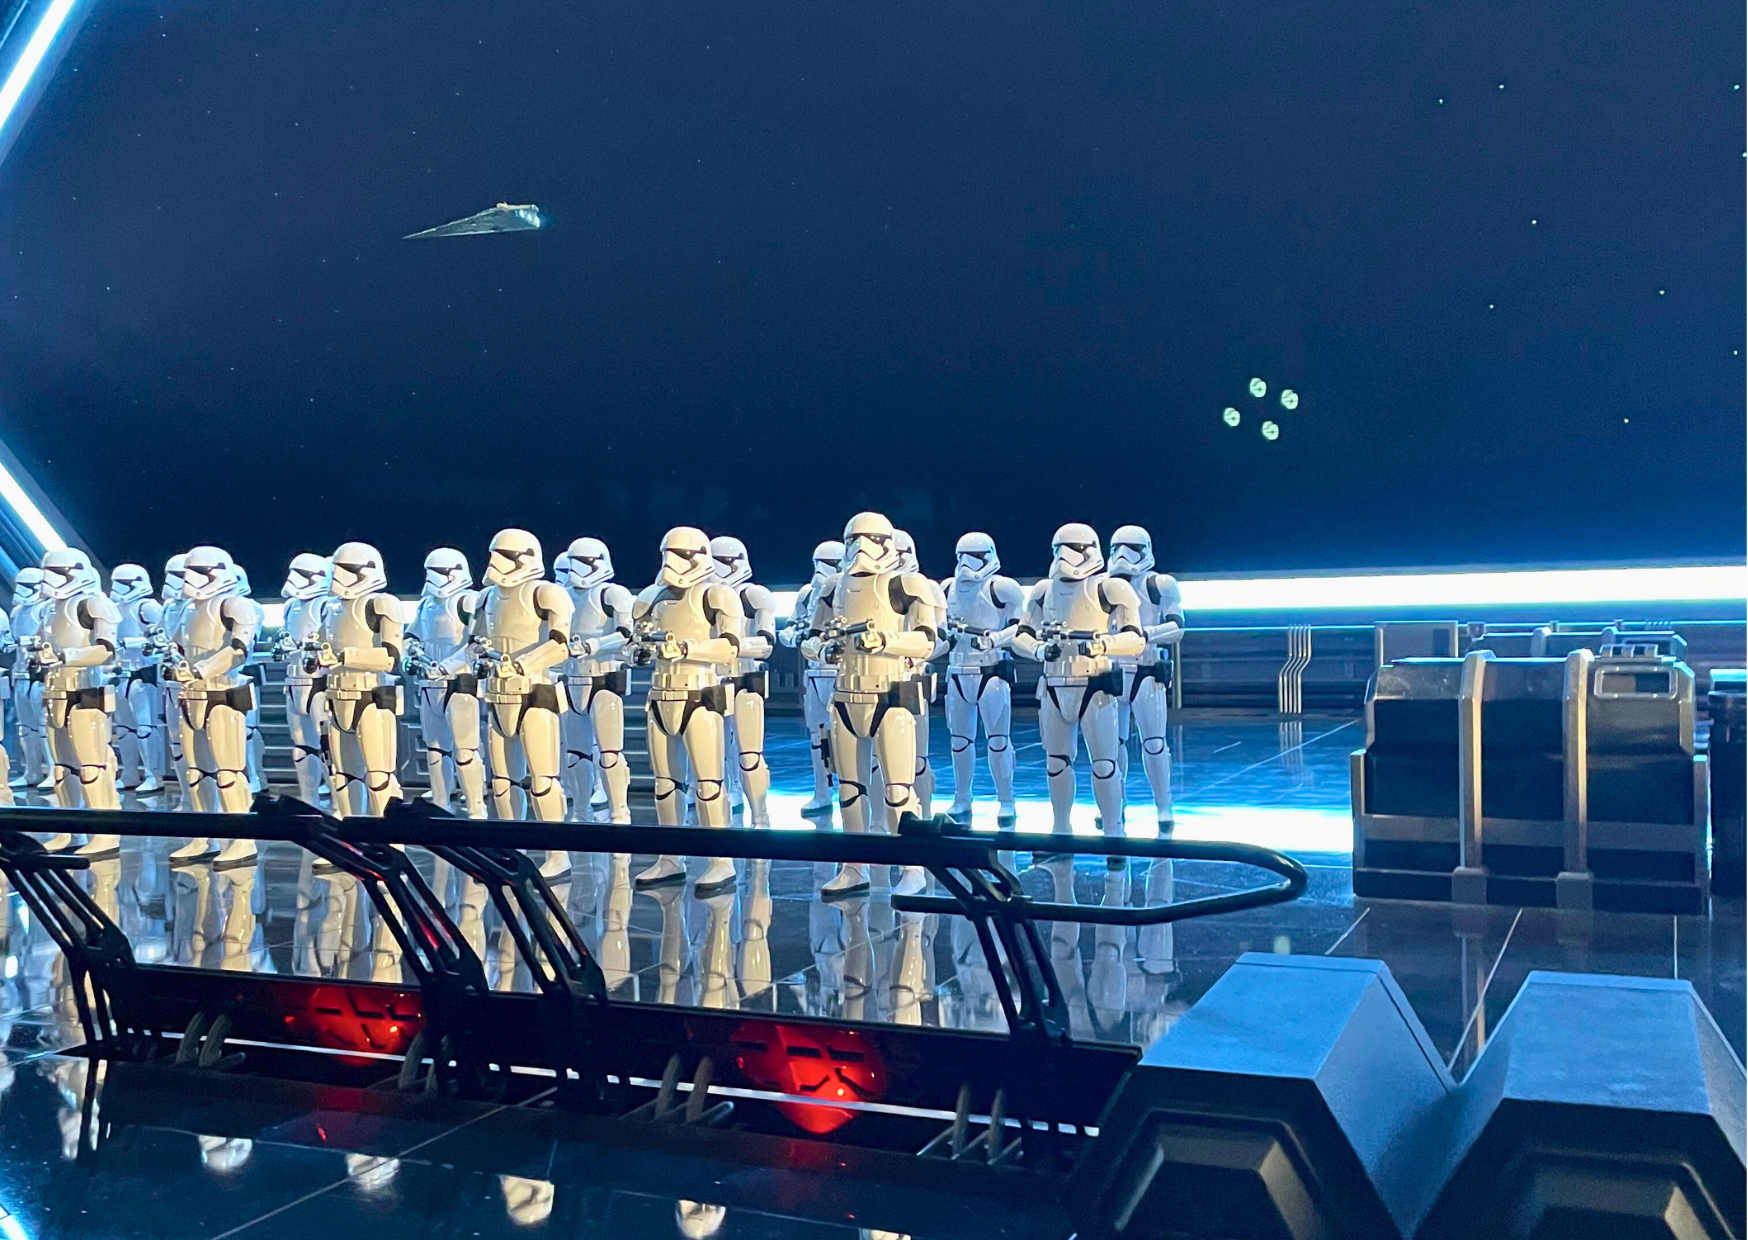
For the longest time, Rise of the Resistance held that title, but Disney has really streamlined its throughput while improving its uptime.
Sure, you’ll still have days (or sometimes even weeks) when it struggles to stay open, but it’s gotten much better.
Credit: Disney
Now, the lackluster throughput of Slinky Dog Dash all but ensures it’ll be the longest wait on a given date.
Finally, the new scenes at Star Tours don’t appear to have impacted attendance much. I’m a bit surprised by that.
@mickeyblog_ 🌌 NEW scenes and characters have been added to Star Tours at Hollywood Studios 🌌 The force was with us today as we rode Star Tours. Not only have new adventures been added, but we also spotted new Star Wars merch to celebrate at Tatooine Traders 👀👀 #startours #hollywoodstudios #disneyparks #disneyrides
EPCOT
Photo: Disney
At EPCOT, the song remains the same. We’re in a holding pattern until CommuniCore Hall & Plaza opens in June.
We’ll witness the typical uptick as summer approaches, but the next big push occurs around June 10th.
Until then, there should be steady behavior. So, here are the park’s average wait times for the past week.
- Frozen Ever After – 80 minutes, up 9
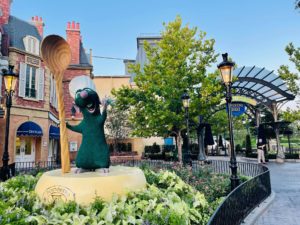
- Remy’s Ratatouille Adventure – 75 minutes, up 8
- Test Track – 69 minutes, up 9
- Soarin’ Around the World – 52 minutes, up 12
- Mission: SPACE – 51 minutes, up 10
- Royal Sommerhus – 39 minutes, up 5
- Spaceship Earth – 21 minutes, up 4
- The Seas with Nemo & Friends – 20 minutes, up 6
- Journey into Imagination with Figment – 19 minutes, up 4
- Turtle Talk with Crush – 18 minutes, no change
- Gran Fiesta Tour Starring the Three Caballeros – 15 minutes, up 3
- Living with the Land – 14 minutes, up 2
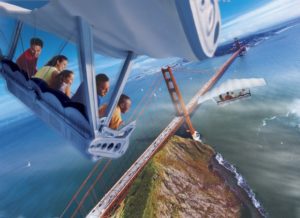
Photo: Touring Plans
Overall, EPCOT attractions required an average wait of 40 minutes, which is eight minutes or 25 percent more than last time.
Notably, all the big attractions here increased their average waits by at least eight minutes. So, I may have this one wrong.
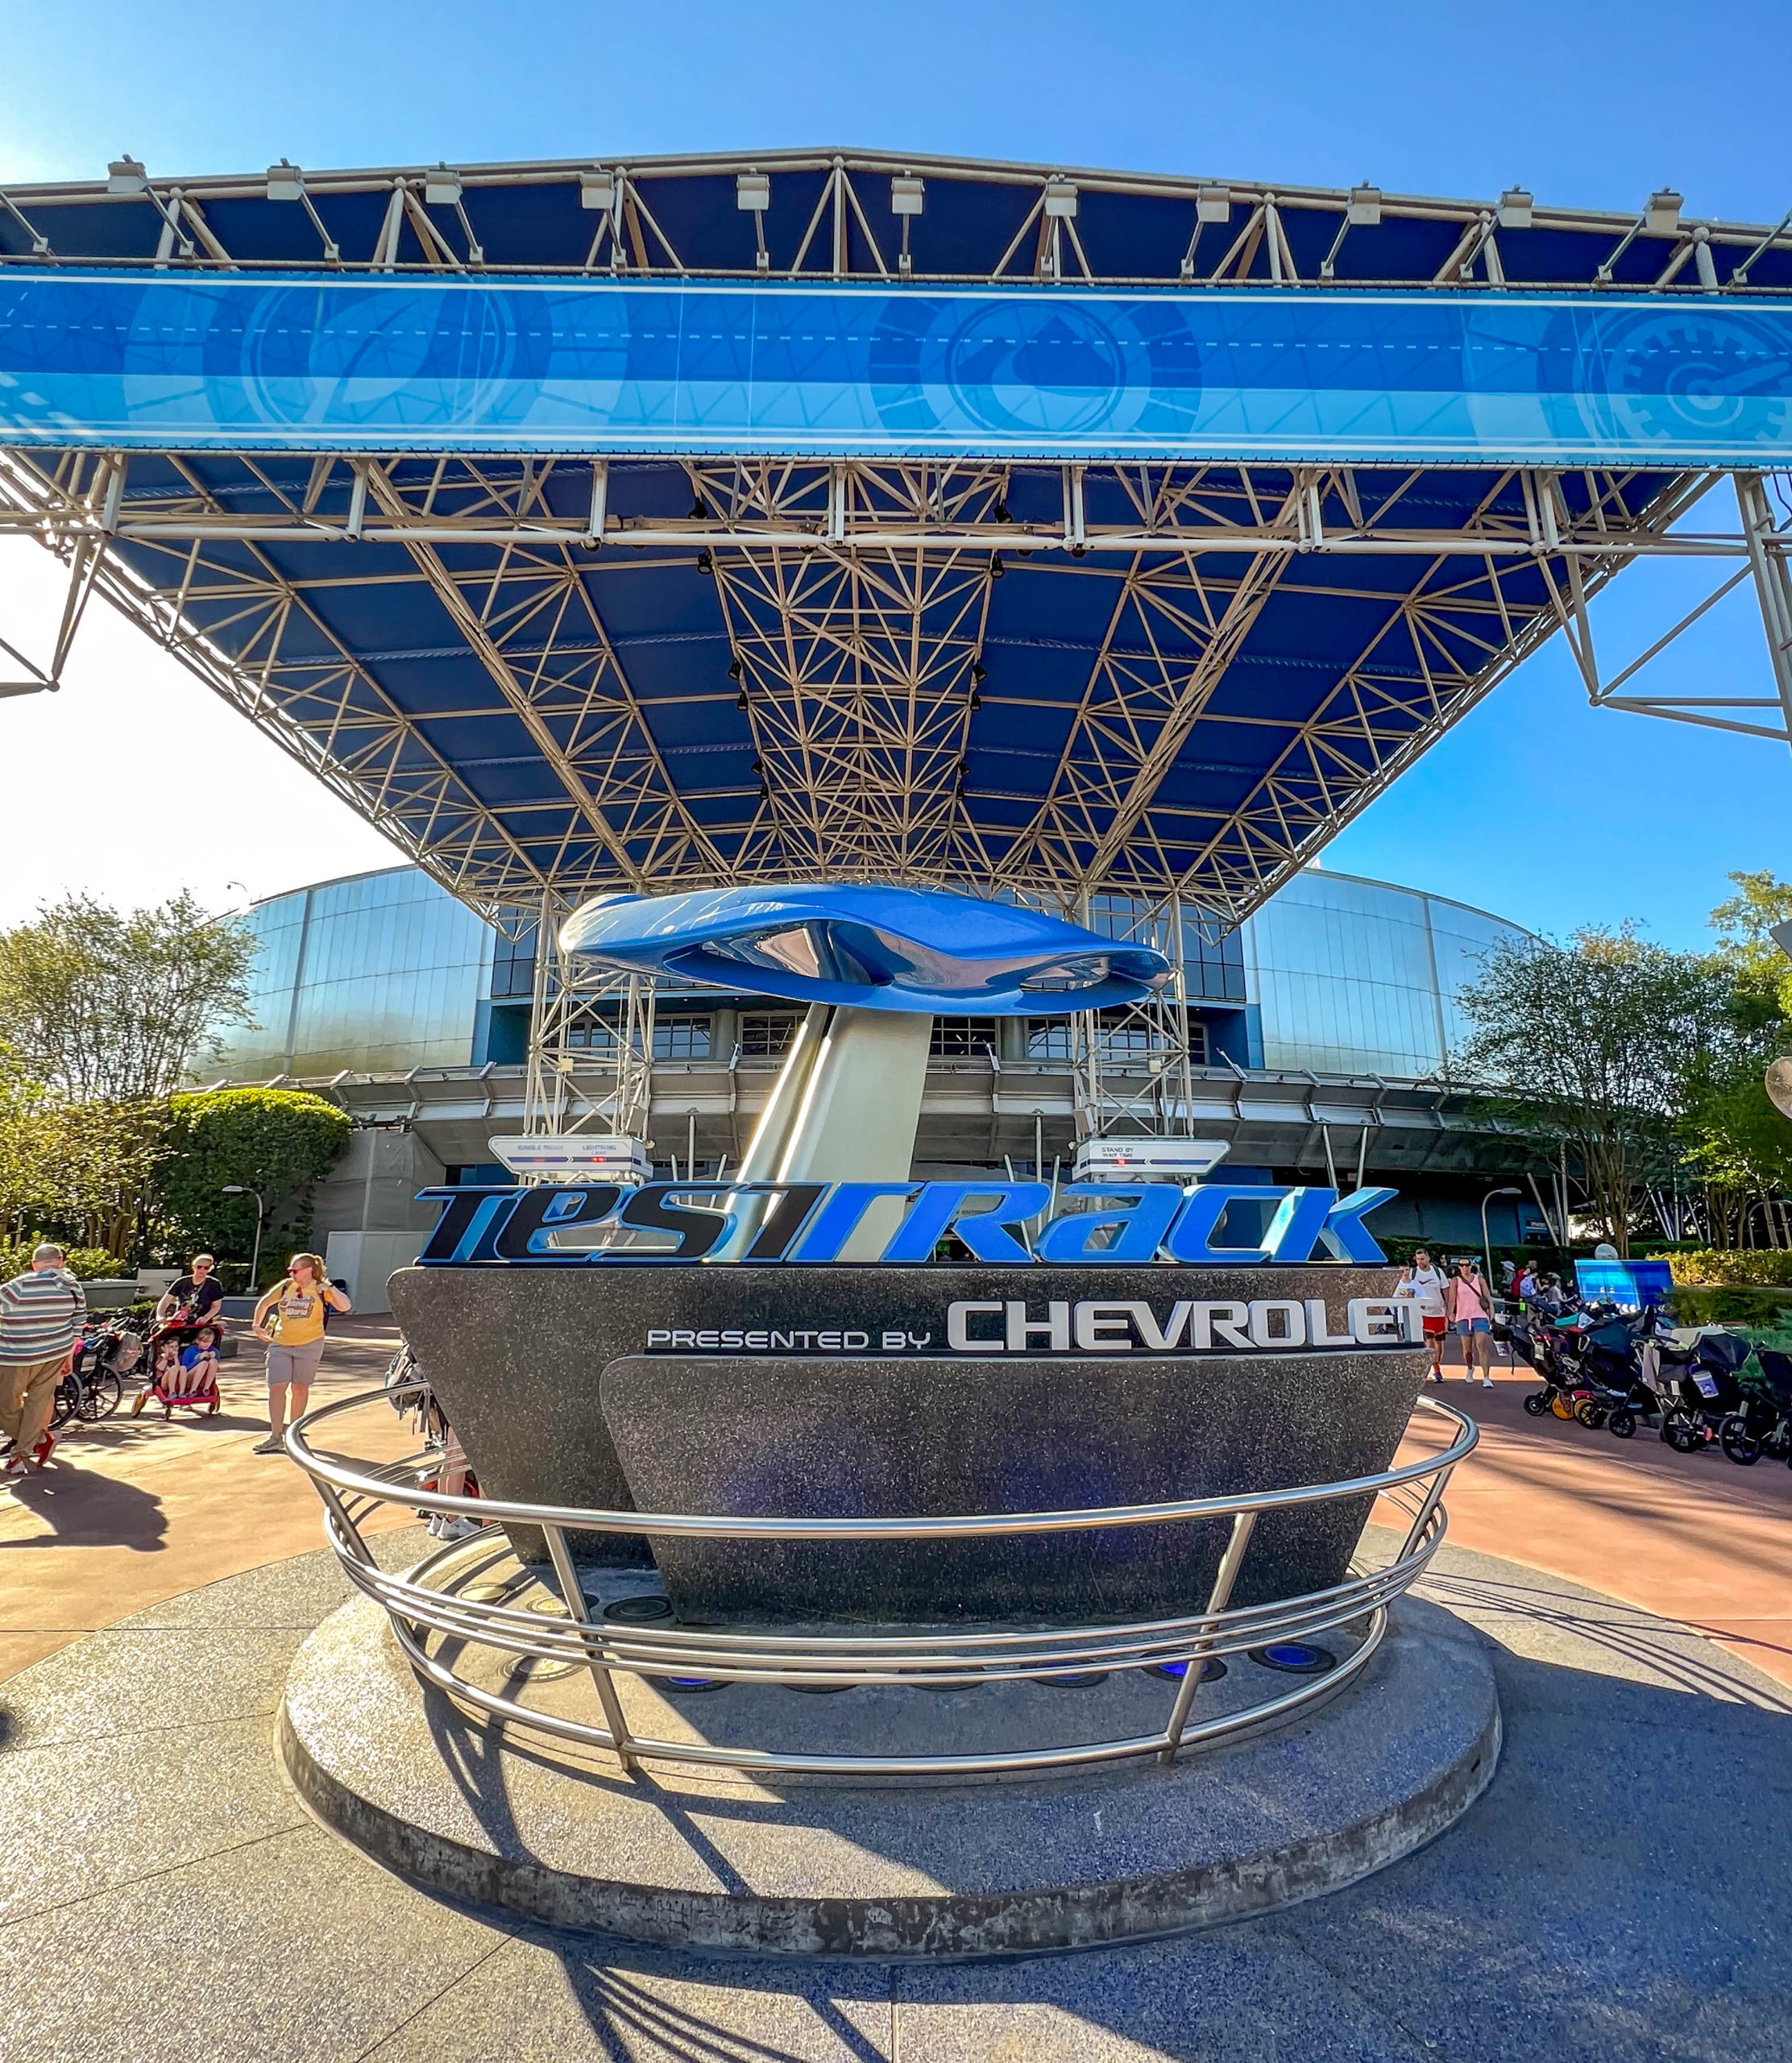
With Test Track closing permanently soon, guests may feel more of a compulsion to visit this park than usual.
If so, EPCOT might remain busier than usual until CommuniCore opens…and stay that way all the way through the start of Food & Wine. We’ll see.
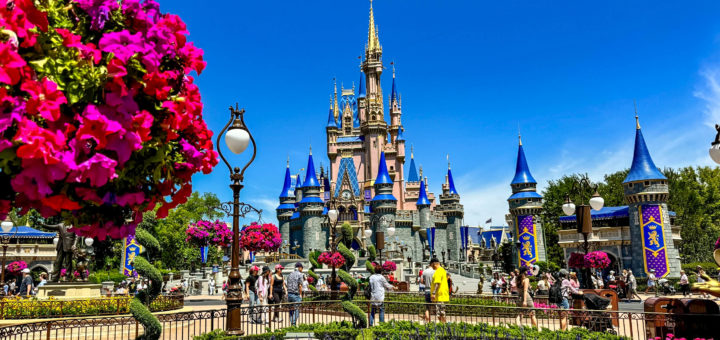
Magic Kingdom

Ariel’s Grotto
Here are Magic Kingdom’s average wait times last week:
- Seven Dwarfs Mine Train – 74 minutes, up 5
- Peter Pan’s Flight – 67 minutes, up 10
- Jungle Cruise – 59 minutes, up 6
- Space Mountain – 53 minutes, up 5
- Town Square Theater – 46 minutes, up 6
- Haunted Mansion – 44 minutes, up 5
- Ariel’s Grotto – 42 minutes, up 3
- Princess Fairytale Hall – 42 minutes, up 3
- The Many Adventures of Winnie the Pooh – 40 minutes, up 3
- Big Thunder Mountain Railroad – 38 minutes, up 5
- Buzz Lightyear’s Space Ranger Spin – 38 minutes, up 4
- Pete’s Silly Sideshow – 36 minutes, up 3
- Astro Orbiter – 35 minutes, up 6
- Pirates of the Caribbean – 34 minutes, up 6
- Enchanted Tales with Belle – 31 minutes, up 5
- It’s a Small World – 31 minutes, up 7
- Under the Sea ~ Journey of the Little Mermaid – 30 minutes, up 9
- Dumbo the Flying Elephant – 27 minutes, up 9
- The Barnstormer – 26 minutes, up 6
- Magic Carpets of Aladdin – 23 minutes, up 7
- Tomorrowland Speedway – 20 minutes, up 6
- Mad Tea Party – 19 minutes, up 5
- Mickey’s PhilharMagic – 18 minutes, up 1
- Tomorrowland Transit Authority PeopleMover – 15 minutes, up 2
- Prince Charming Regal Carrousel – 14 minutes, down 1
- Monsters, Inc. Laugh Floor – 13 minutes, down 1
- Walt Disney World Railroad – 13 minutes, up 1
- Walt Disney’s Carousel of Progress – 5 minutes, no change
Final Thoughts
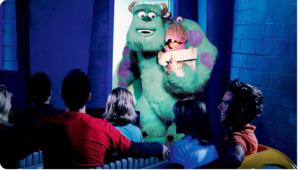
Photo: Disney
Overall, Magic Kingdom guests spent an average of 30 minutes in line, which is three minutes or 11 percent more than last time.
Since every Walt Disney World gate required a longer wait this past week, it’s clear the parks were more crowded.
Photo:visitorlando.com
So, the Animal Kingdom increase wasn’t because of Earth Week, or at least not all of it was.
Meanwhile, that final push for Test Track could be a factor over the next six weeks.
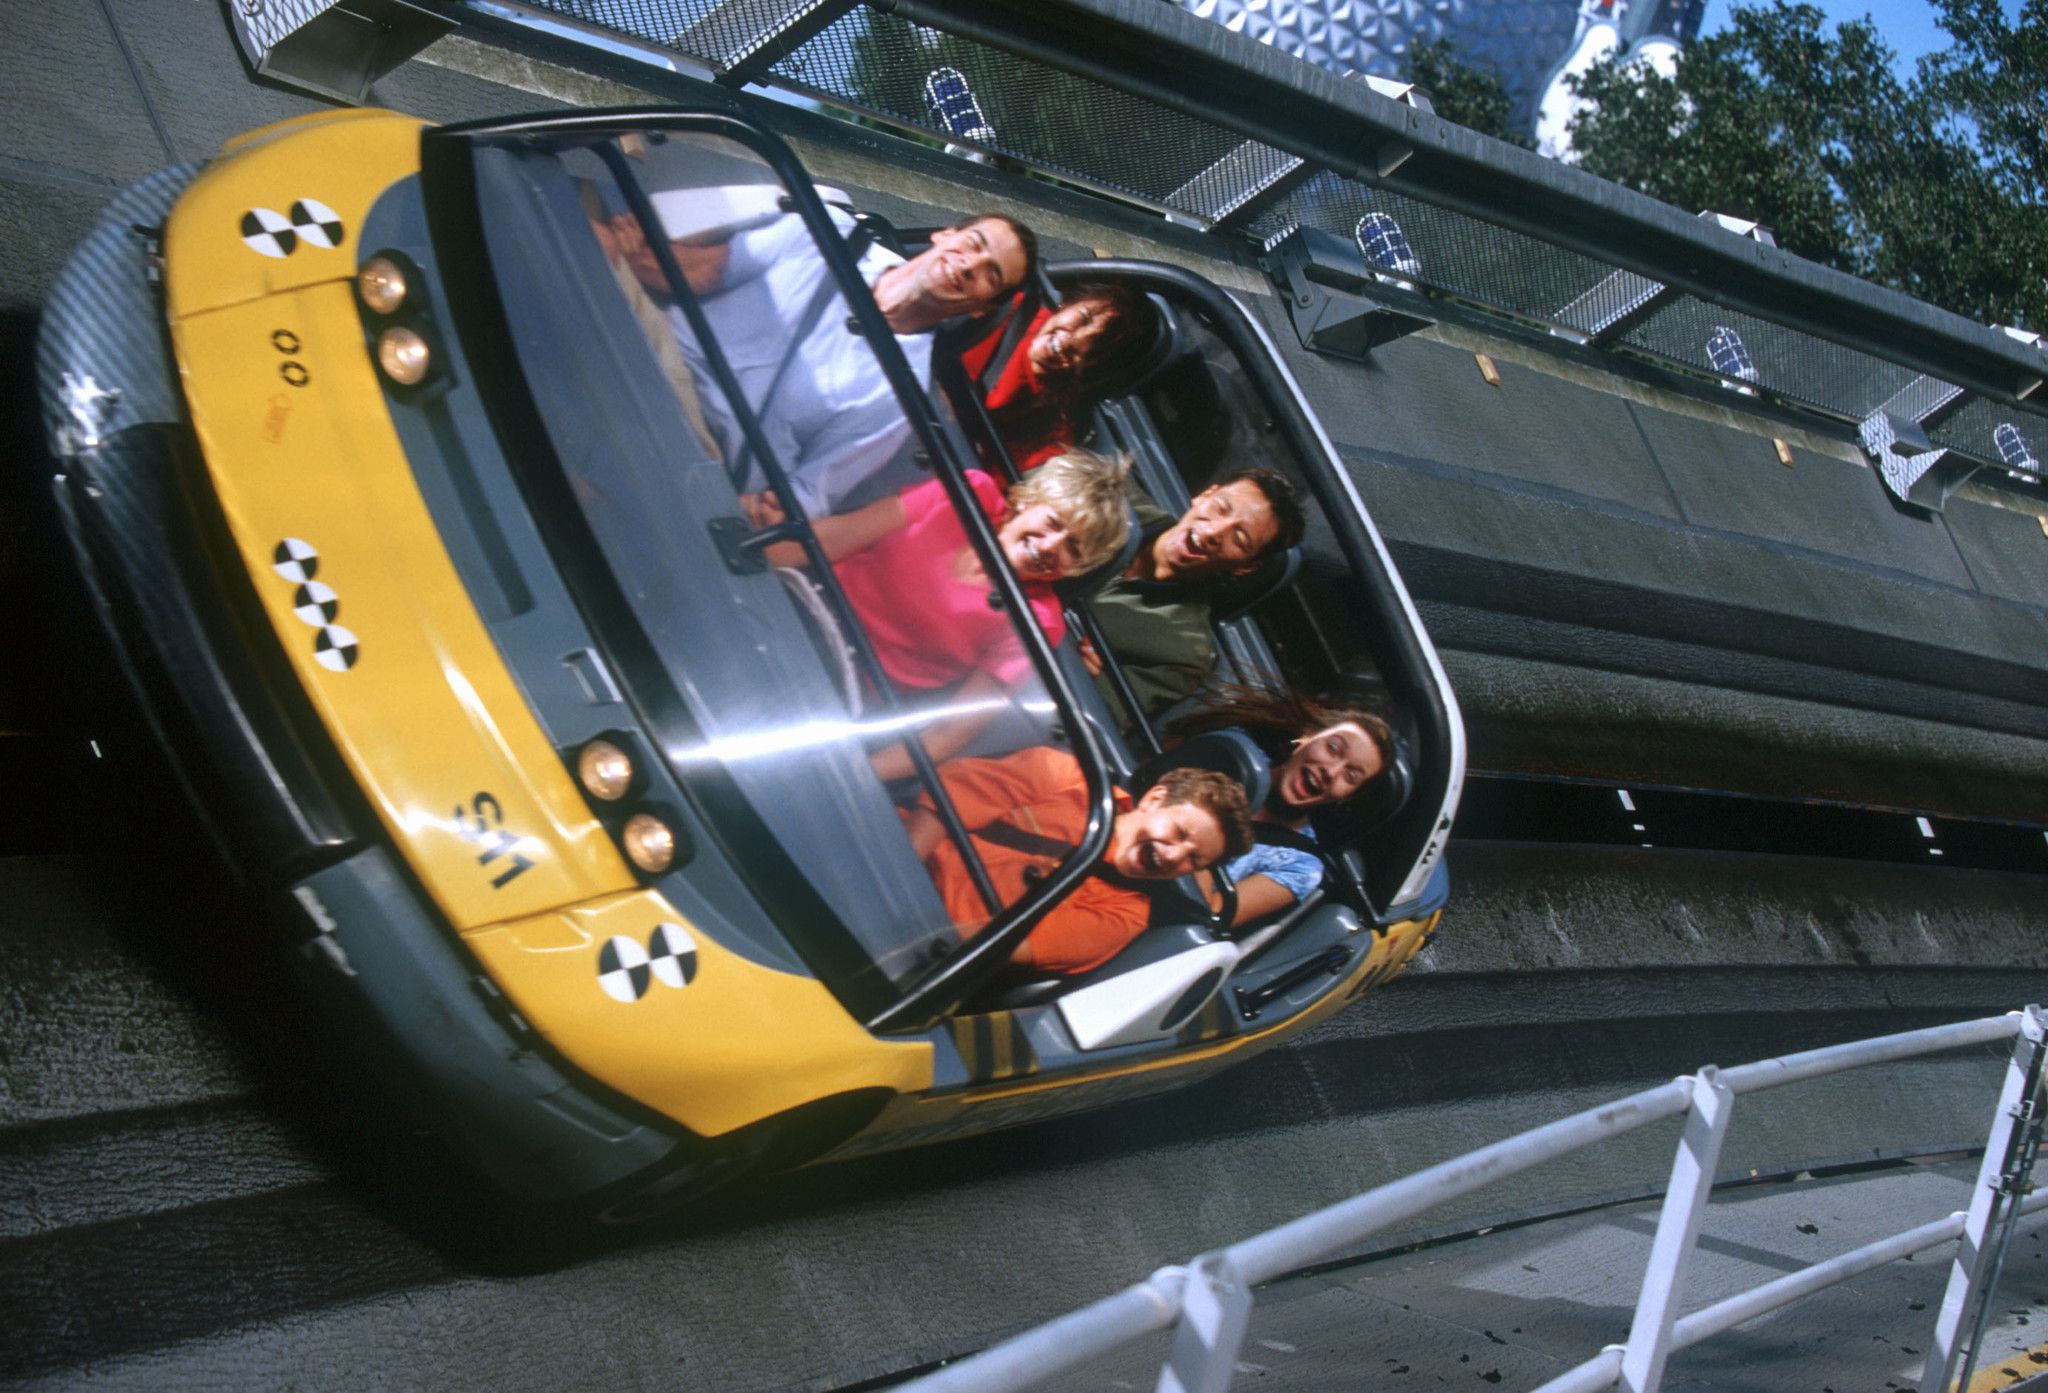
Photo: Disney
The beloved ride will close for good the week after CommuniCore Hall & Plaza debuts.
![]()
Thanks for visiting MickeyBlog.com! Want to go to Disney? For a FREE quote on your next Disney vacation, please fill out the form below, and one of the agents from MickeyTravels, a Diamond Level Authorized Disney Vacation Planner, will be in touch soon!