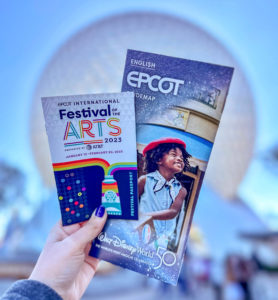
Walt Disney World Wait Times for Second Week of January 2023
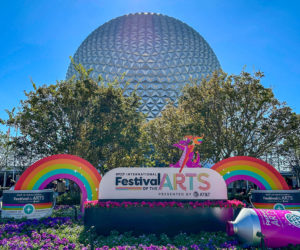
The 2023 EPCOT International Festival of the Arts has opened.
In recent years, this event fundamentally altered Walt Disney World’s theme park attendance in late January.
Guests visited much more frequently during this time of the year than they had before the event.
Did the Festival of the Arts impact this past week’s wait times? Let’s take a look!
Disney’s Animal Kingdom
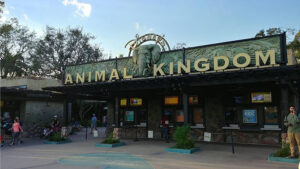
The Festival of the Arts usually doesn’t affect Animal Kingdom. The park still could have one factor impacting its wait times, though.
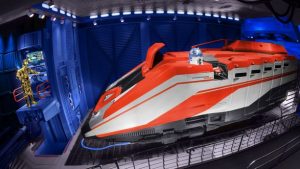
Avatar: The Way of Water will enter the top five all-time in the worldwide box office in a matter of days.
For this reason, Disney faces unprecedented demand for all things Avatar.

Photo: touring plans.com
Pandora – The World of Avatar had swollen in crowd size during the holiday season. Did the trend continue into mid-January?
Well, Avatar Flight of Passage averaged a wait of 132 minutes, an increase of 22 minutes.
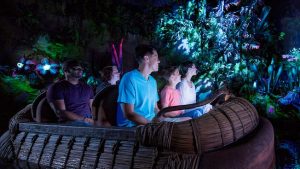
Photo: Disney
Meanwhile, Na’vi River Journey required a wait of 77 minutes, up 17 minutes from the last time.
This behavior isn’t surprising, but it’s the latest proof that Disney lacks a true off-season these days.
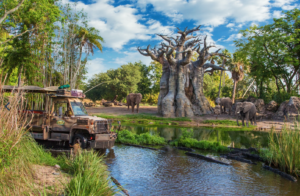
Photo: Disney
Here are the other average wait times at Animal Kingdom:
- Kilimanjaro Safaris – 50 minutes, up 15
- Expedition Everest – 45 minutes, up 15
- Adventurers Outpost – 42 minutes, up 2
- DINOSAUR – 27 minutes, up 15
- TriceraTop Spin – 15 minutes, up 8
- It’s Tough to Be a Bug! – 12 minutes, up 6
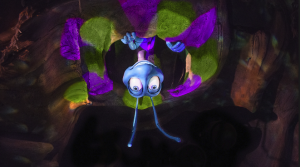
Photo: Disney
Overall, guests waited for an average of 42 minutes per attraction. That’s eight minutes or 24 percent longer lines than last week.
Disney’s Hollywood Studios
If you read the wait times during December, you know that Hollywood Studios was more crowded than ever.
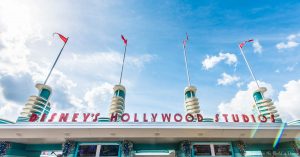
Photo credit: DisneyWorldVacationGuide.com
Thankfully, some semblance of normalcy returned after the first few days of 2023.
Hollywood Studios comes with what passes for sane wait times these days. Here are the averages for each attraction:
- Star Wars: Rise of the Resistance – 125 minutes, down 17
- Twilight Zone Tower of Terror – 120 minutes, up 17
- Slinky Dog Dash – 100 minutes, up 25
- Rock ‘n’ Roller Coaster Starring Aerosmith – 78 minutes, up 25
- Mickey & Minnie’s Runaway Railway – 75 minutes, up 18
- Toy Story Mania! – 73 minutes, up 3
- Millennium Falcon: Smugglers Run – 70 minutes, up 20
- Red Carpet Dreams – 42 minutes, down 3
- Alien Swirling Saucers – 37 minutes, up 5
- Star Tours – The Adventures Continue! – 30 minutes, up 12
- Meet Sulley at Walt Disney Presents – 29 minutes, up 4
- Celebrity Spotlight – 27 minutes, up 10
- Lightning McQueen’s Racing Academy – 15 minutes, no change
- Muppet*Vision 3D – 10 minutes, no change
Overall, the average Hollywood Studios attraction required a wait of 52 minutes. That’s nine minutes more than last week.
So, we’re definitely showing signs that Walt Disney World increased its crowd sizes across the board.
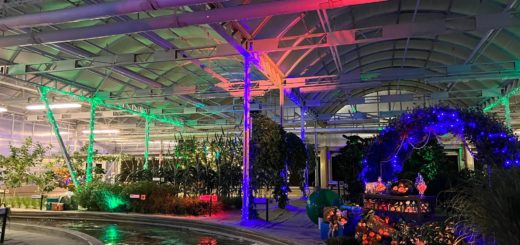
EPCOT
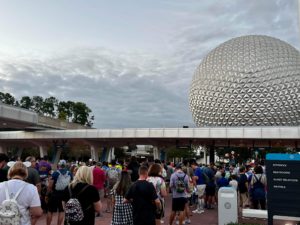
The Festival of the Arts will factor into crowd sizes at EPCOT for the next month.
However, the spread-out nature of the park lessens the impact, as does the high number of attractions with modest waits.
Also, we’re only factoring less than half a week of EPCOT festival crowds into this week’s data. So, we’ll know more next week.
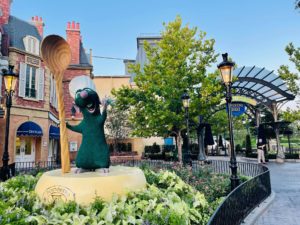
Having said that, here are the average attraction waits for the past week:
- Remy’s Ratatouille Adventure – 80 minutes, down 27
- Frozen Ever After – 75 minutes, up 18
- Test Track – 68 minutes, up 16
- Soarin’ Around the World – 50 minutes, up 24
- Mission: SPACE – 35 minutes, up 19
- Royal Sommerhus – 34 minutes, up 19
- Spaceship Earth – 19 minutes, up 9
- Turtle Talk with Crush – 17 minutes, up 2
- Journey into Imagination with Figment – 12 minutes, up 7
- The Seas with Nemo & Friends – 8 minutes, up 3
- Living with the Land – 7 minutes, up 2
- Gran Fiesta Tour Starring the Three Caballeros – 6 minutes, no change
The average EPCOT attraction came with a wait of 37 minutes. That’s 17 minutes or 85 percent more than last week.
So, yes, the Festival of the Arts is a massive draw. The data is quite emphatic here.
Magic Kingdom
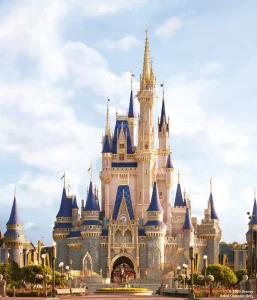
Photo: Disney Parks
Finally, we have Magic Kingdom. Here are this park’s average wait times for the past week:
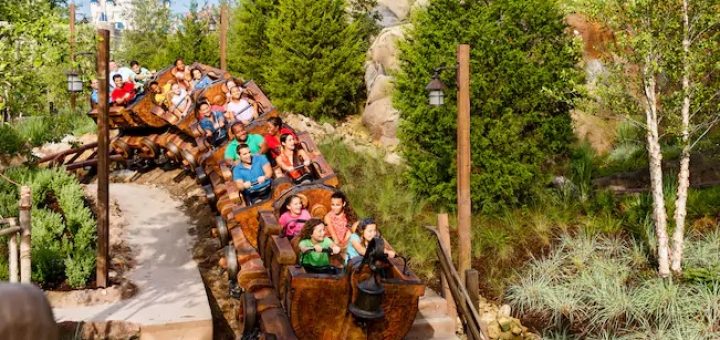
- Seven Dwarfs Mine Train – 94 minutes, up 12
- Peter Pan’s Flight – 78 minutes, up 8
- Space Mountain – 65 minutes, up 17
- Jungle Cruise – 60 minutes, up 10
- Big Thunder Mountain Railroad – 57 minutes, up 15
- Haunted Mansion – 50 minutes, up 12
- Buzz Lightyear’s Space Ranger Spin – 44 minutes, up 13
- Many Adventures of Winnie the Pooh – 40 minutes, up 11
- Splash Mountain – 39 minutes, down 15
- Town Square Theater – 35 minutes, down 1
- Astro Orbiter – 34 minutes, up 2
- Pete’s Silly Sideshow – 33 minutes, n/a
- The Barnstormer – 32 minutes, up 15
- Princess Fairytale Hall – 32 minutes, up 2
- It’s a Small World – 30 minutes, up 7
- Dumbo the Flying Elephant – 29 minutes, up 18
- Magic Carpets of Aladdin – 29 minutes, up 13
- Under the Sea ~ Journey of the Little Mermaid – 25 minutes, up 7
- Tomorrowland Speedway – 24 minutes, up 11
- Tomorrowland Transit Authority PeopleMover – 18 minutes, up 7
- Mad Tea Party – 16 minutes, up 8
- Mickey’s PhilharMagic – 15 minutes, up 4
- Prince Charming Regal Carrousel – 10 minutes, up 4
- Monsters, Inc. Laugh Floor – 8 minutes, down 2
- Walt Disney’s Carousel of Progress – 5 minutes, no change
- Country Bear Jamboree – 5 minutes, no change
Credit: Disney
At Magic Kingdom, guests waited for an average of 32 minutes per attraction. That’s five minutes more than last time.
So, this is one of those rare weeks when Magic Kingdom attractions required the shortest waits. It’s extremely rare for that to happen compared to EPCOT in particular.
There’s your proof that the Festival of the Arts has become a destination event at Walt Disney World.
![]()
Thanks for visiting MickeyBlog.com! Want to go to Disney? For a FREE quote on your next Disney vacation, please fill out the form below, and one of the agents from MickeyTravels, a Diamond level Authorized Disney Vacation Planner, will be in touch soon!
Feature Photo: Disney