Walt Disney World Wait Times for Third Week of September 2022
We’re in the middle of the slow season at Walt Disney World, presuming such a thing even exists these days.
While the terribly named “revenge travel” has kept the parks more crowded than usual, September has still witnessed calmer parks.
How was Walt Disney World recently? Let’s check the Walt Disney World wait times for the third week of September 2022.
Disney’s Animal Kingdom
Okay, we’ve got a surprise at the top this week. It’s one of the rare weeks when Avatar Flight of Passage doesn’t come with the longest lines at Animal Kingdom.

Photo: DisneyFor the first time in ages, something else topped it. And that ride is Na’vi River Journey, which averaged a wait of 61 minutes, an increase of seven minutes.
Meanwhile, the other attraction at Pandora – The World of Avatar, Avatar Flight of Passage, dropped two minutes to 56.
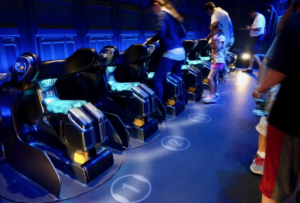
Photo: Undercover tourist
So, both attractions require a wait in the one-hour range, while everything else at Animal Kingdom is reasonable. Here’s the proof:
- Adventurers Outpost – 36 minutes, down 2
- Kilimanjaro Safaris – 34 minutes, down 6
- Kali River Rapids – 30 minutes, down 7
- Expedition Everest – 25 minutes, no change
- DINOSAUR – 17 minutes, down 1
- It’s Tough to Be a Bug! – 10 minutes, no change
- TriceraTop Spin – 6 minutes, no change
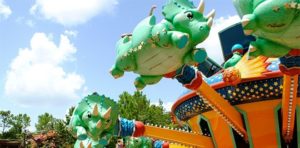
Photo: Disney
Overall, guests waited an average of 30 minutes, a drop of two minutes from last week.
So, crowds diminished slightly, but Animal Kingdom was basically the same as last time.
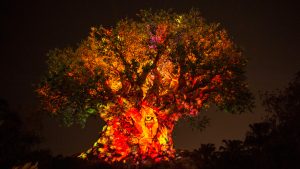
Photo: Disney
Disney’s Hollywood Studios
I always hold my breath when we talk about Hollywood Studios, as tourists cannot get enough of this park.
As usual, the top ride here is Star Wars: Rise of the Resistance, which came with an 89-minute wait, down two minutes from last week.

Photo: Matt Stroshane
Meanwhile, Slinky Dog Dash hovered at 77 minutes, a drop of three minutes week over week.
Here are the other Hollywood Studios waits:
- Rock ‘n’ Roller Coaster Starring Aerosmith – 57 minutes, down 3
- Mickey & Minnie’s Runaway Railway – 56 minutes, down 5
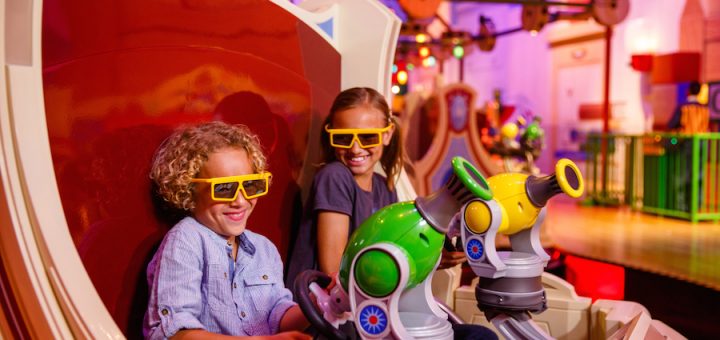
- Toy Story Mania! – 55 minutes, down 3
- Millennium Falcon: Smugglers Run – 54 minutes, down 11
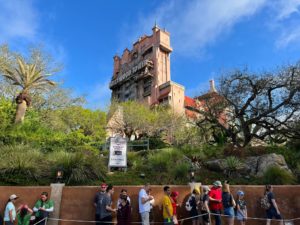
- Twilight Zone Tower of Terror – 47 minutes, down 1
- Red Carpet Dreams – 41 minutes, down 1
- Meet Sulley at Walt Disney Presents – 36 minutes, down 2
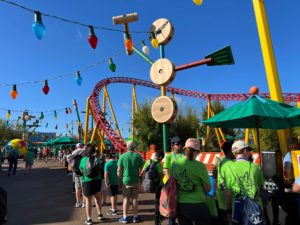
- Alien Swirling Saucers – 34 minutes, down 3
- Celebrity Spotlight – 24 minutes, no change
- Star Tours – The Adventures Continue – 16 minutes, down 3
- Lightning McQueen’s Racing Academy – 14 minutes, no change
- Muppet*Vision 3D – 10 minutes, no change
Overall, guests averaged a wait of 38 minutes, four minutes lower than last time.
Average line time of 38 minutes is really good at Hollywood Studios. It helps that only two attractions required a wait of 60+ minutes, which is way low for this park.
EPCOT
After a couple of months of chaos, we haven’t had many shakeups with the top three at EPCOT lately.
During the past week, Frozen Ever After once again averaged the longest wait of 59 minutes, down two minutes from last time.
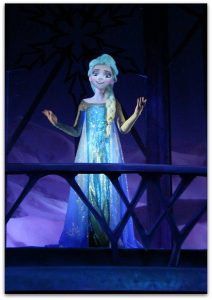
Photo: Disney
Meanwhile, Remy’s Ratatouille Attraction is one of the few attractions that increased this week. It averaged a 54-minute wait, up five minutes.
Finally, Test Track held ground at 43 minutes, just like last week.
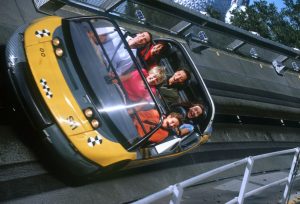
Photo: Disney
Here are the other EPCOT waits:
- Royal Sommerhus – 20 minutes, no change
- Mission: SPACE – 16 minutes, no change
- Living with the Land – 10 minutes, up 2
- Spaceship Earth – 8 minutes, no change
- Journey into Imagination with Figment – 7 minutes, up 1
- Turtle Talk with Crush – 7 minutes, down 3
- Gran Fiesta Tour Starring the Three Caballeros – 6 minutes, no change
- The Seas with Nemo & Friends – 5 minutes, no change
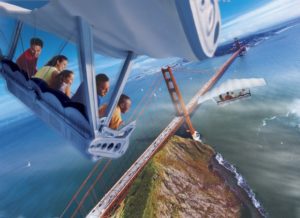
Photo: Touring Plans
Once again, EPCOT hosted six (!) attractions that were effectively walk-ons. Overall, guests averaged a wait of – 19 minutes, the same as last week.
Magic Kingdom
Here are the average waits at Magic Kingdom:
- Peter Pan’s Flight – 56 minutes, up 5
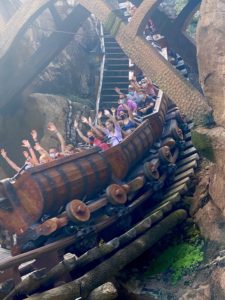
- Seven Dwarfs Mine Train – 55 minutes, no change
- Jungle Cruise – 45 minutes, up 3
- Town Square Theater – 42 minutes, up 4
- Splash Mountain – 37 minutes, up 15
- Haunted Mansion – 35 minutes, up 7
- Princess Fairytale Hall – 32 minutes, up 2
- Space Mountain – 28 minutes, up 5
- Big Thunder Mountain Railroad – 27 minutes, up 6
- Pirates of the Caribbean – 24 minutes, up 14
- Buzz Lightyear’s Space Ranger Spin – 21 minutes, up 7
- Astro Orbiter – 17 minutes, down 1
- Under the Sea ~ Journey of the Little Mermaid – 14, up 7
- It’s a Small World – 13 minutes, up 8
- Tomorrowland Speedway – 11 minutes, up 2
- Magic Carpets of Aladdin – 9 minutes, up 4
- Dumbo the Flying Elephant – 8 minutes, up 3
- The Barnstormer – 7 minutes, up 2
- Mad Tea Party – 7 minutes, up 2
- Monsters, Inc. Laugh Floor – 7 minutes, up 2
- Tomorrowland Transit Authority PeopleMover – 6 minutes, no change
- Prince Charming Regal Carrousel – 5 minutes, no change
- Walt Disney’s Carousel of Progress – 5 minutes, no change
- Country Bear Jamboree – 5 minutes, no change
Overall, guests waited for an average of 25 minutes for Magic Kingdom attractions. That’s an increase of three minutes over last time.
You may wonder why Magic Kingdom attractions have increased while the other parks behaved differently.
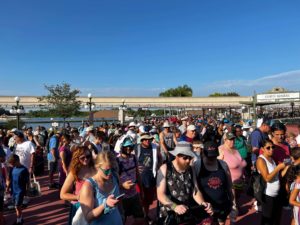
The explanation is Mickey’s Not-So-Scary Halloween Party. Guests must leave Magic Kingdom at 6 p.m. on these nights.
So, the park doesn’t have those slow hours after dark when most guests leave. Instead, Magic Kingdom only tracks wait times until dinner.
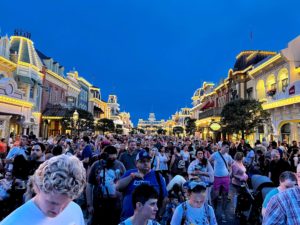
You can see what an impact that has on the overall park wait times.
Thanks for visiting MickeyBlog.com! Want to go to Disney? For a FREE quote on your next Disney vacation, please fill out the form below and one of the agents from MickeyTravels, a Platinum level Authorized Disney Vacation Planner, will be in touch soon!
Feature Photo: Disney