Walt Disney World Wait Times for Week of July 4th, 2024
We’ve reached a hilarious time on the annual calendar, as the fates toy with the hearts and minds of Disney fans.
Each year, Disney theme park crowds swell in size during the week of July 4th.
Simultaneously, the weather torments fans. In 2023, July 4th was the hottest day on record in the history of civilization.
That’s a real thing that happened. While we’d all hoped for better, history repeated itself in 2024.

The Central Florida area experienced heat advisories on and around July 4th.
What did this do to crowds? Let’s find out! Here are Walt Disney World’s wait times for the week of July 4th, 2024.
Disney’s Animal Kingdom

Photo: Disney
Historically, I’ve always indicated that the heat is not a major factor in theme park attendance.
Then, 2023 happened, and we had some proof that something caused a dip in holiday crowds.
I suspect a bigger factor was the calendar configuration, with July 4th falling on a Tuesday.
So, many potential tourists had to work on Monday and/or Wednesday, reducing the convenience of a quick trip to Disney.
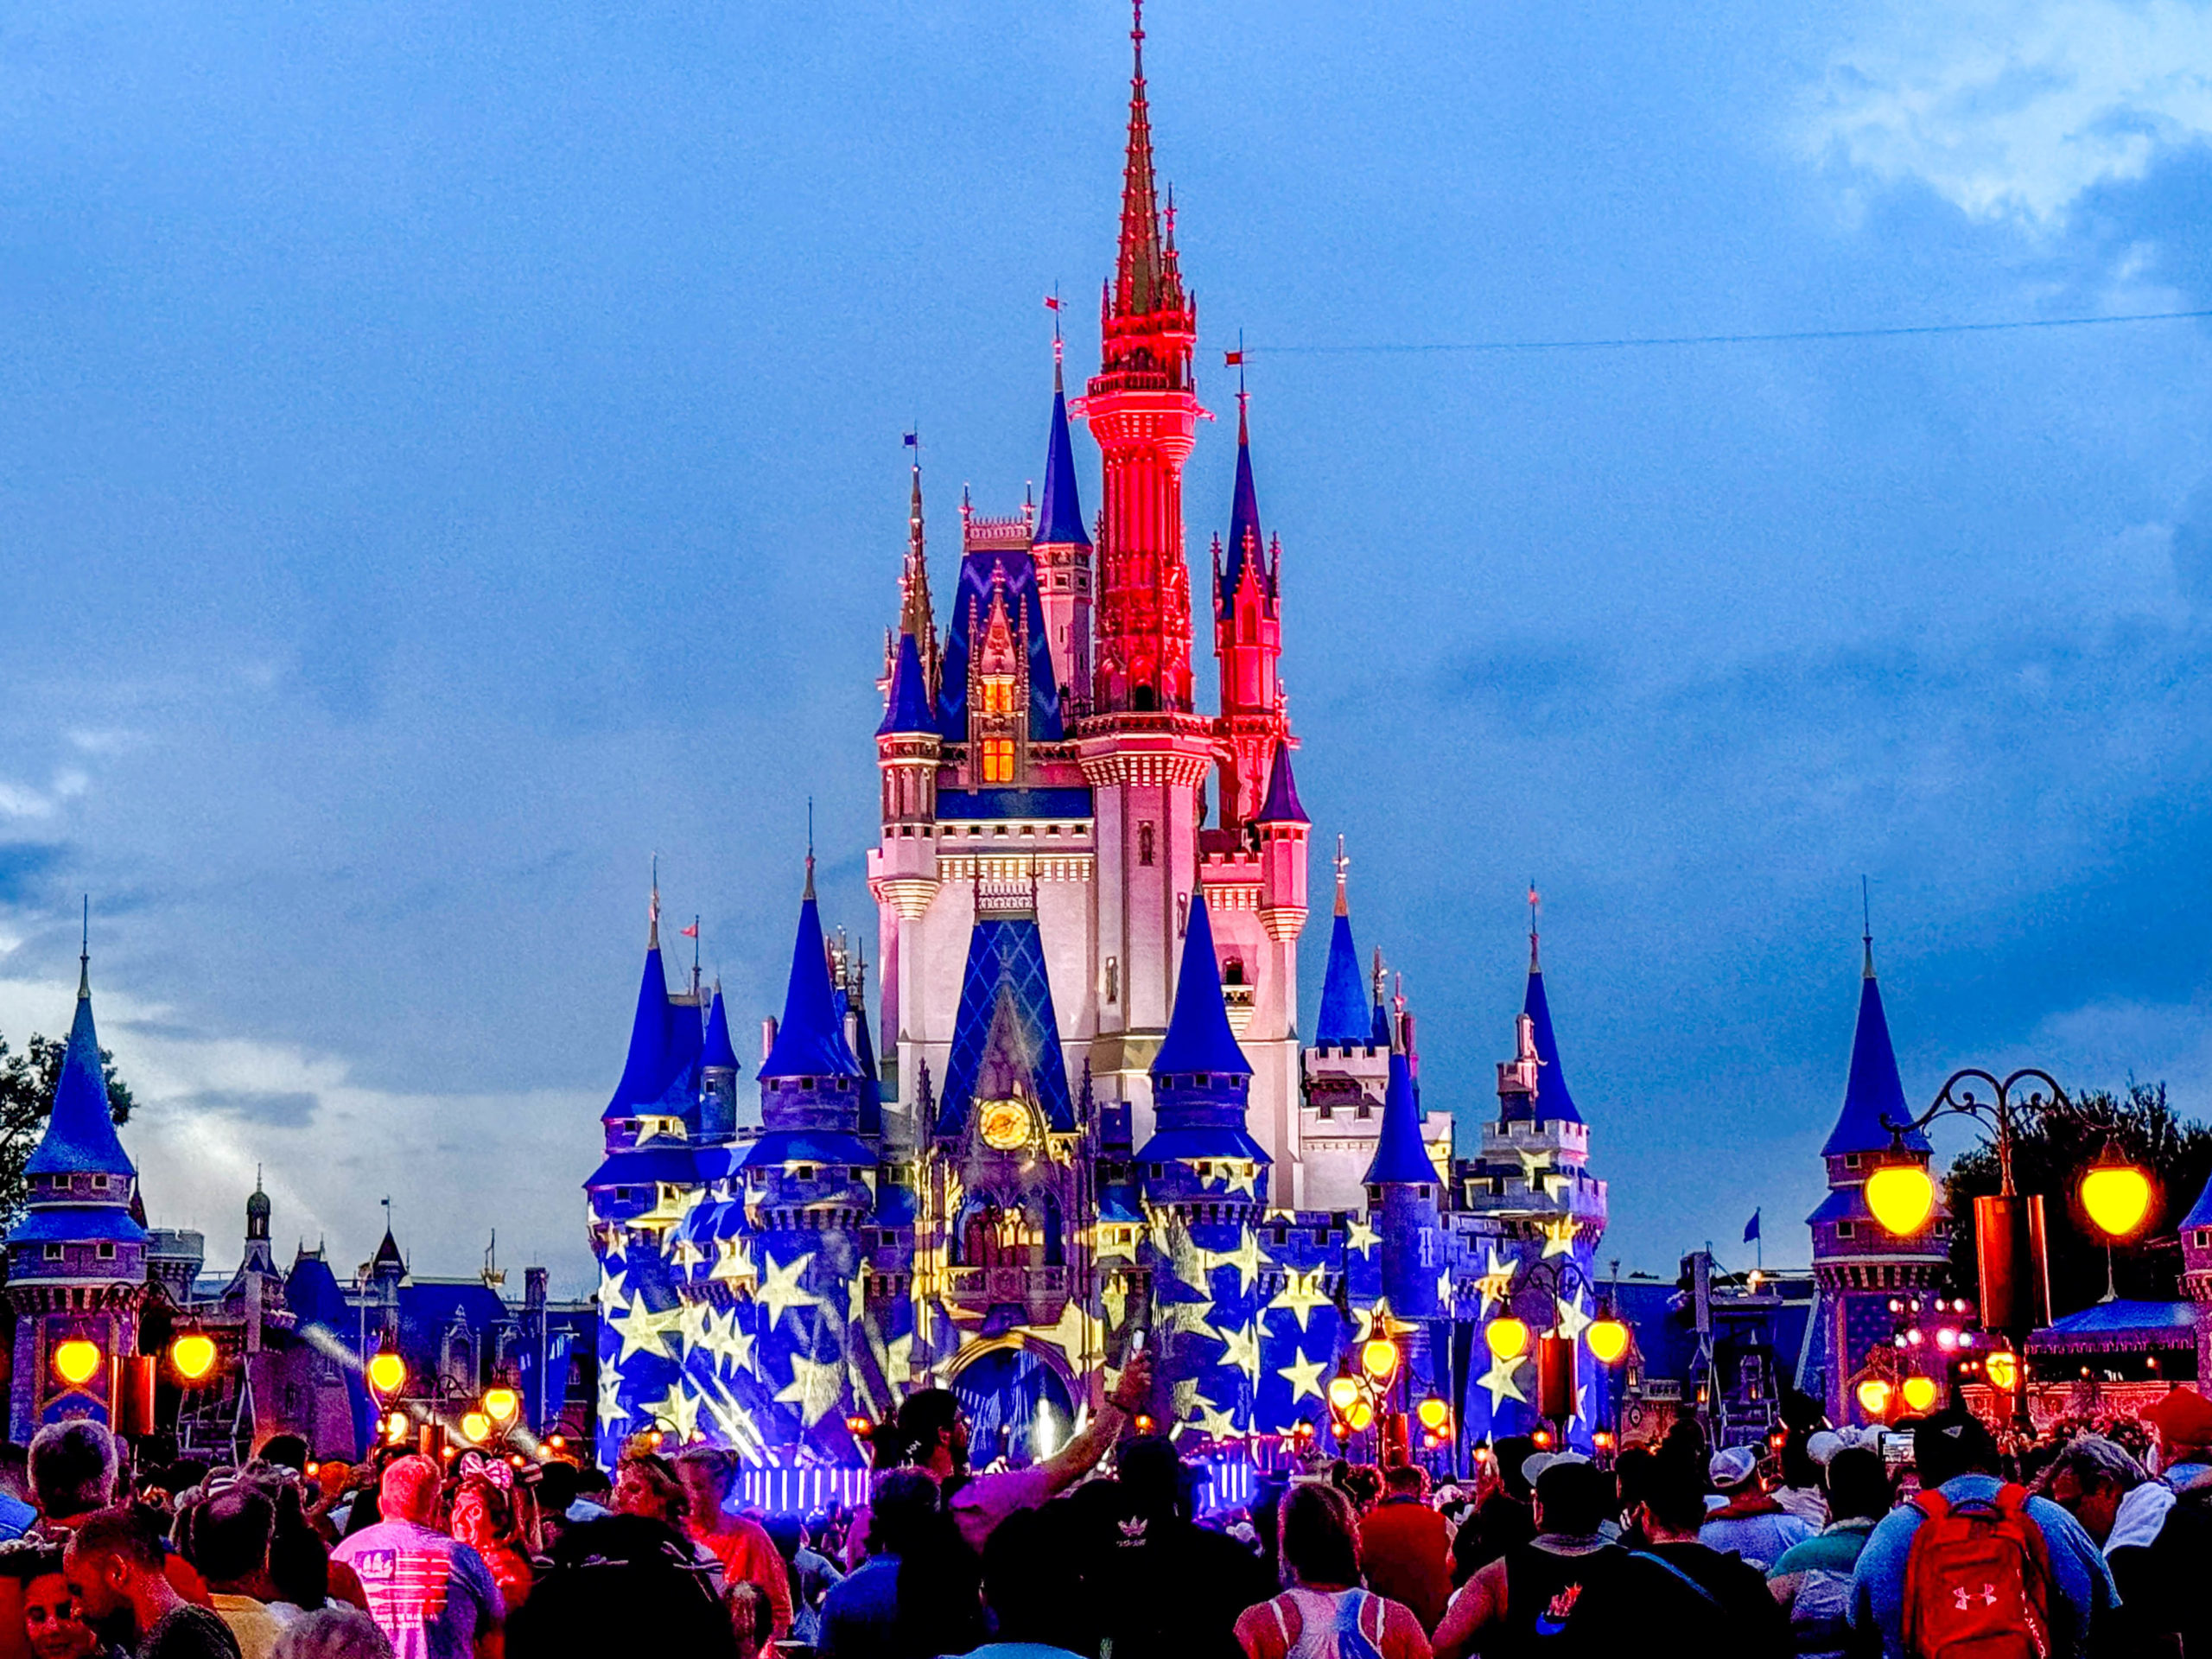
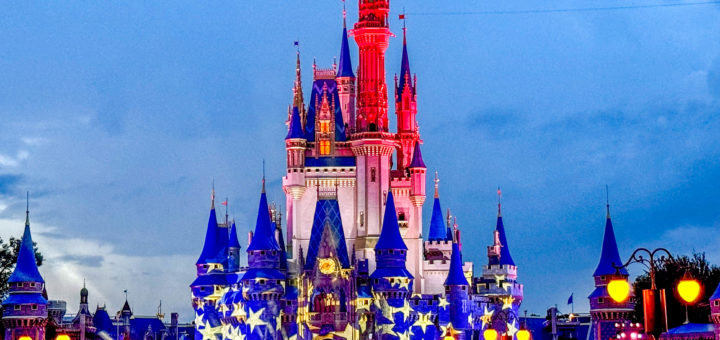
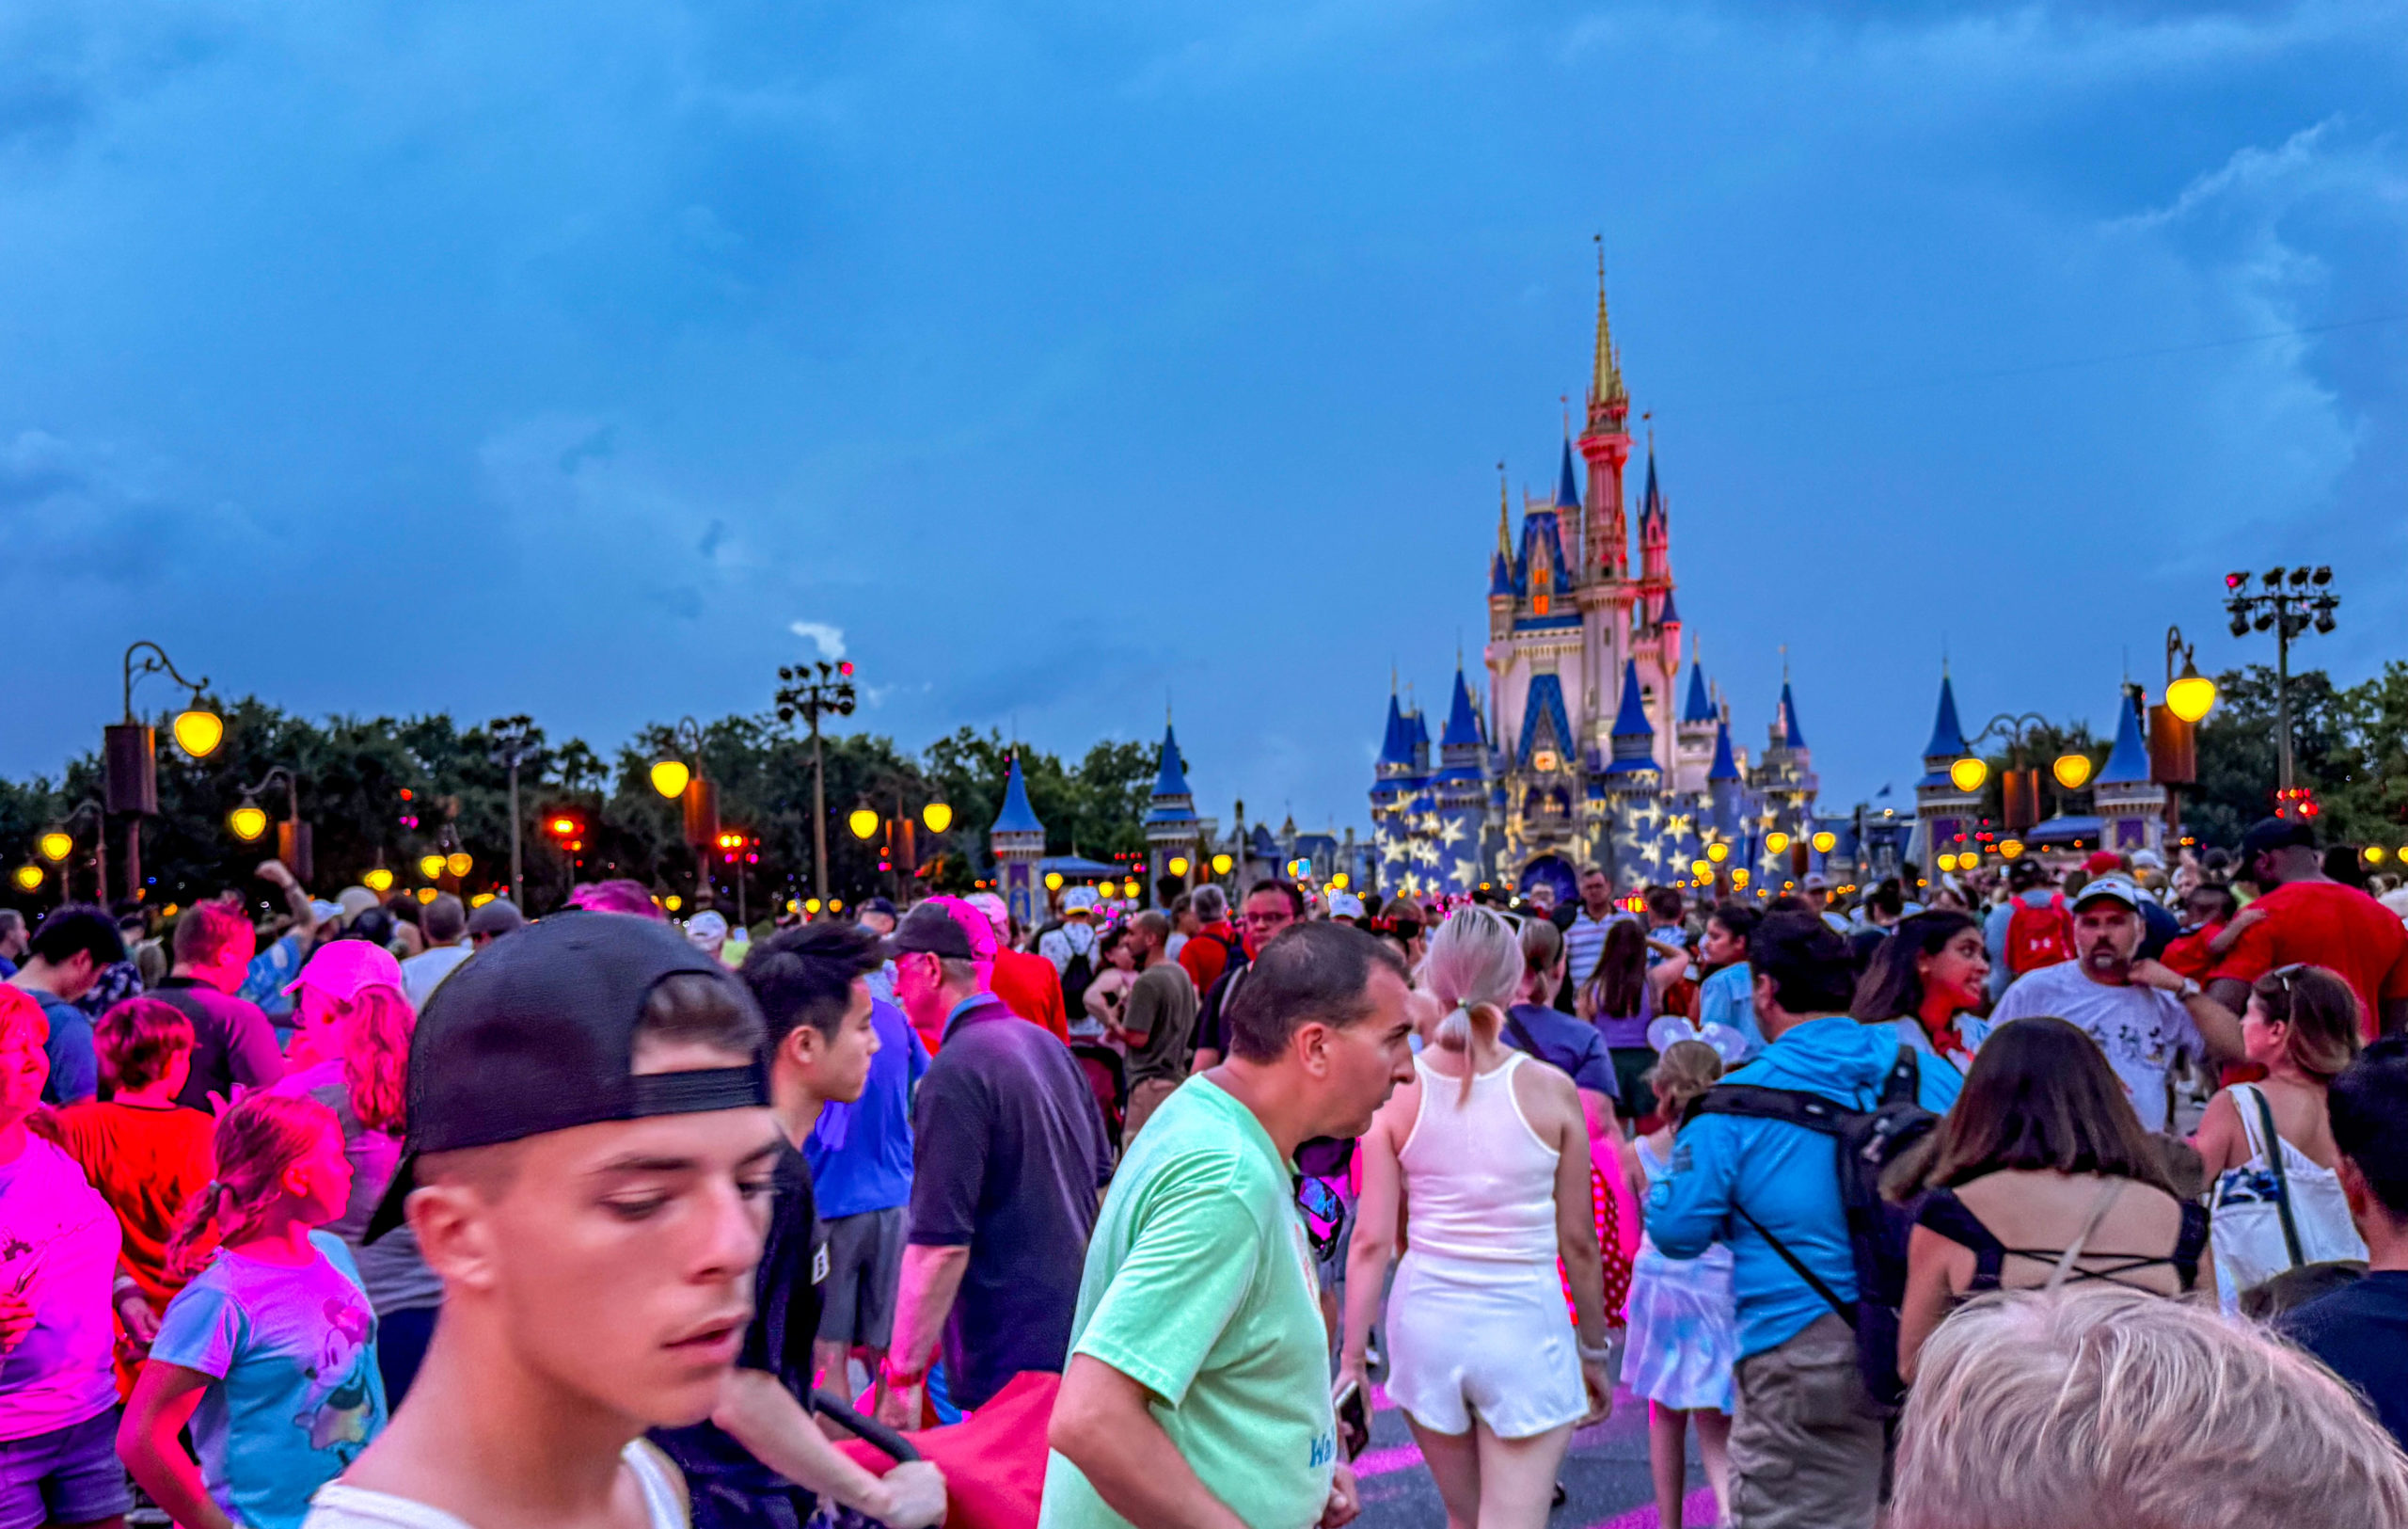
Cinderella Castle
Thanks to the magic of Leap Year, this year’s holiday occurred on Thursday.
That aspect allowed some guests to take Friday off and spend four days at Disney World.
As such, I’d expect larger crowds…but then there’s that heat concern.
Which factor won out? Here are Animal Kingdom’s average wait times last week:
- Avatar Flight of Passage – 82 minutes, down 6
- Kali River Rapids – 56 minutes, down 1
- Na’vi River Journey – 53 minutes, down 4
- Expedition Everest – 41 minutes, down 6
- Adventurers Outpost – 36 minutes, down 1
- Kilimanjaro Safaris – 25 minutes, down 10
- DINOSAUR – 23 minutes, down 5
- It’s Tough to Be a Bug! – 10 minutes, no change
- TriceraTop Spin – 8 minutes, down 2

Overall, guests waited for an average of 37 minutes, which is four minutes less than last time.
So, the first data point suggests that we didn’t have an influx of holiday crowds this past week.
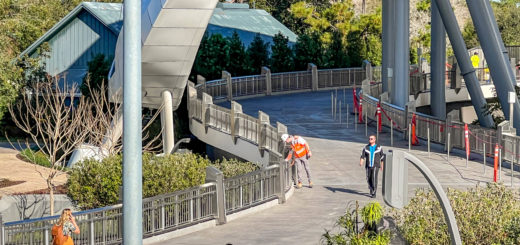
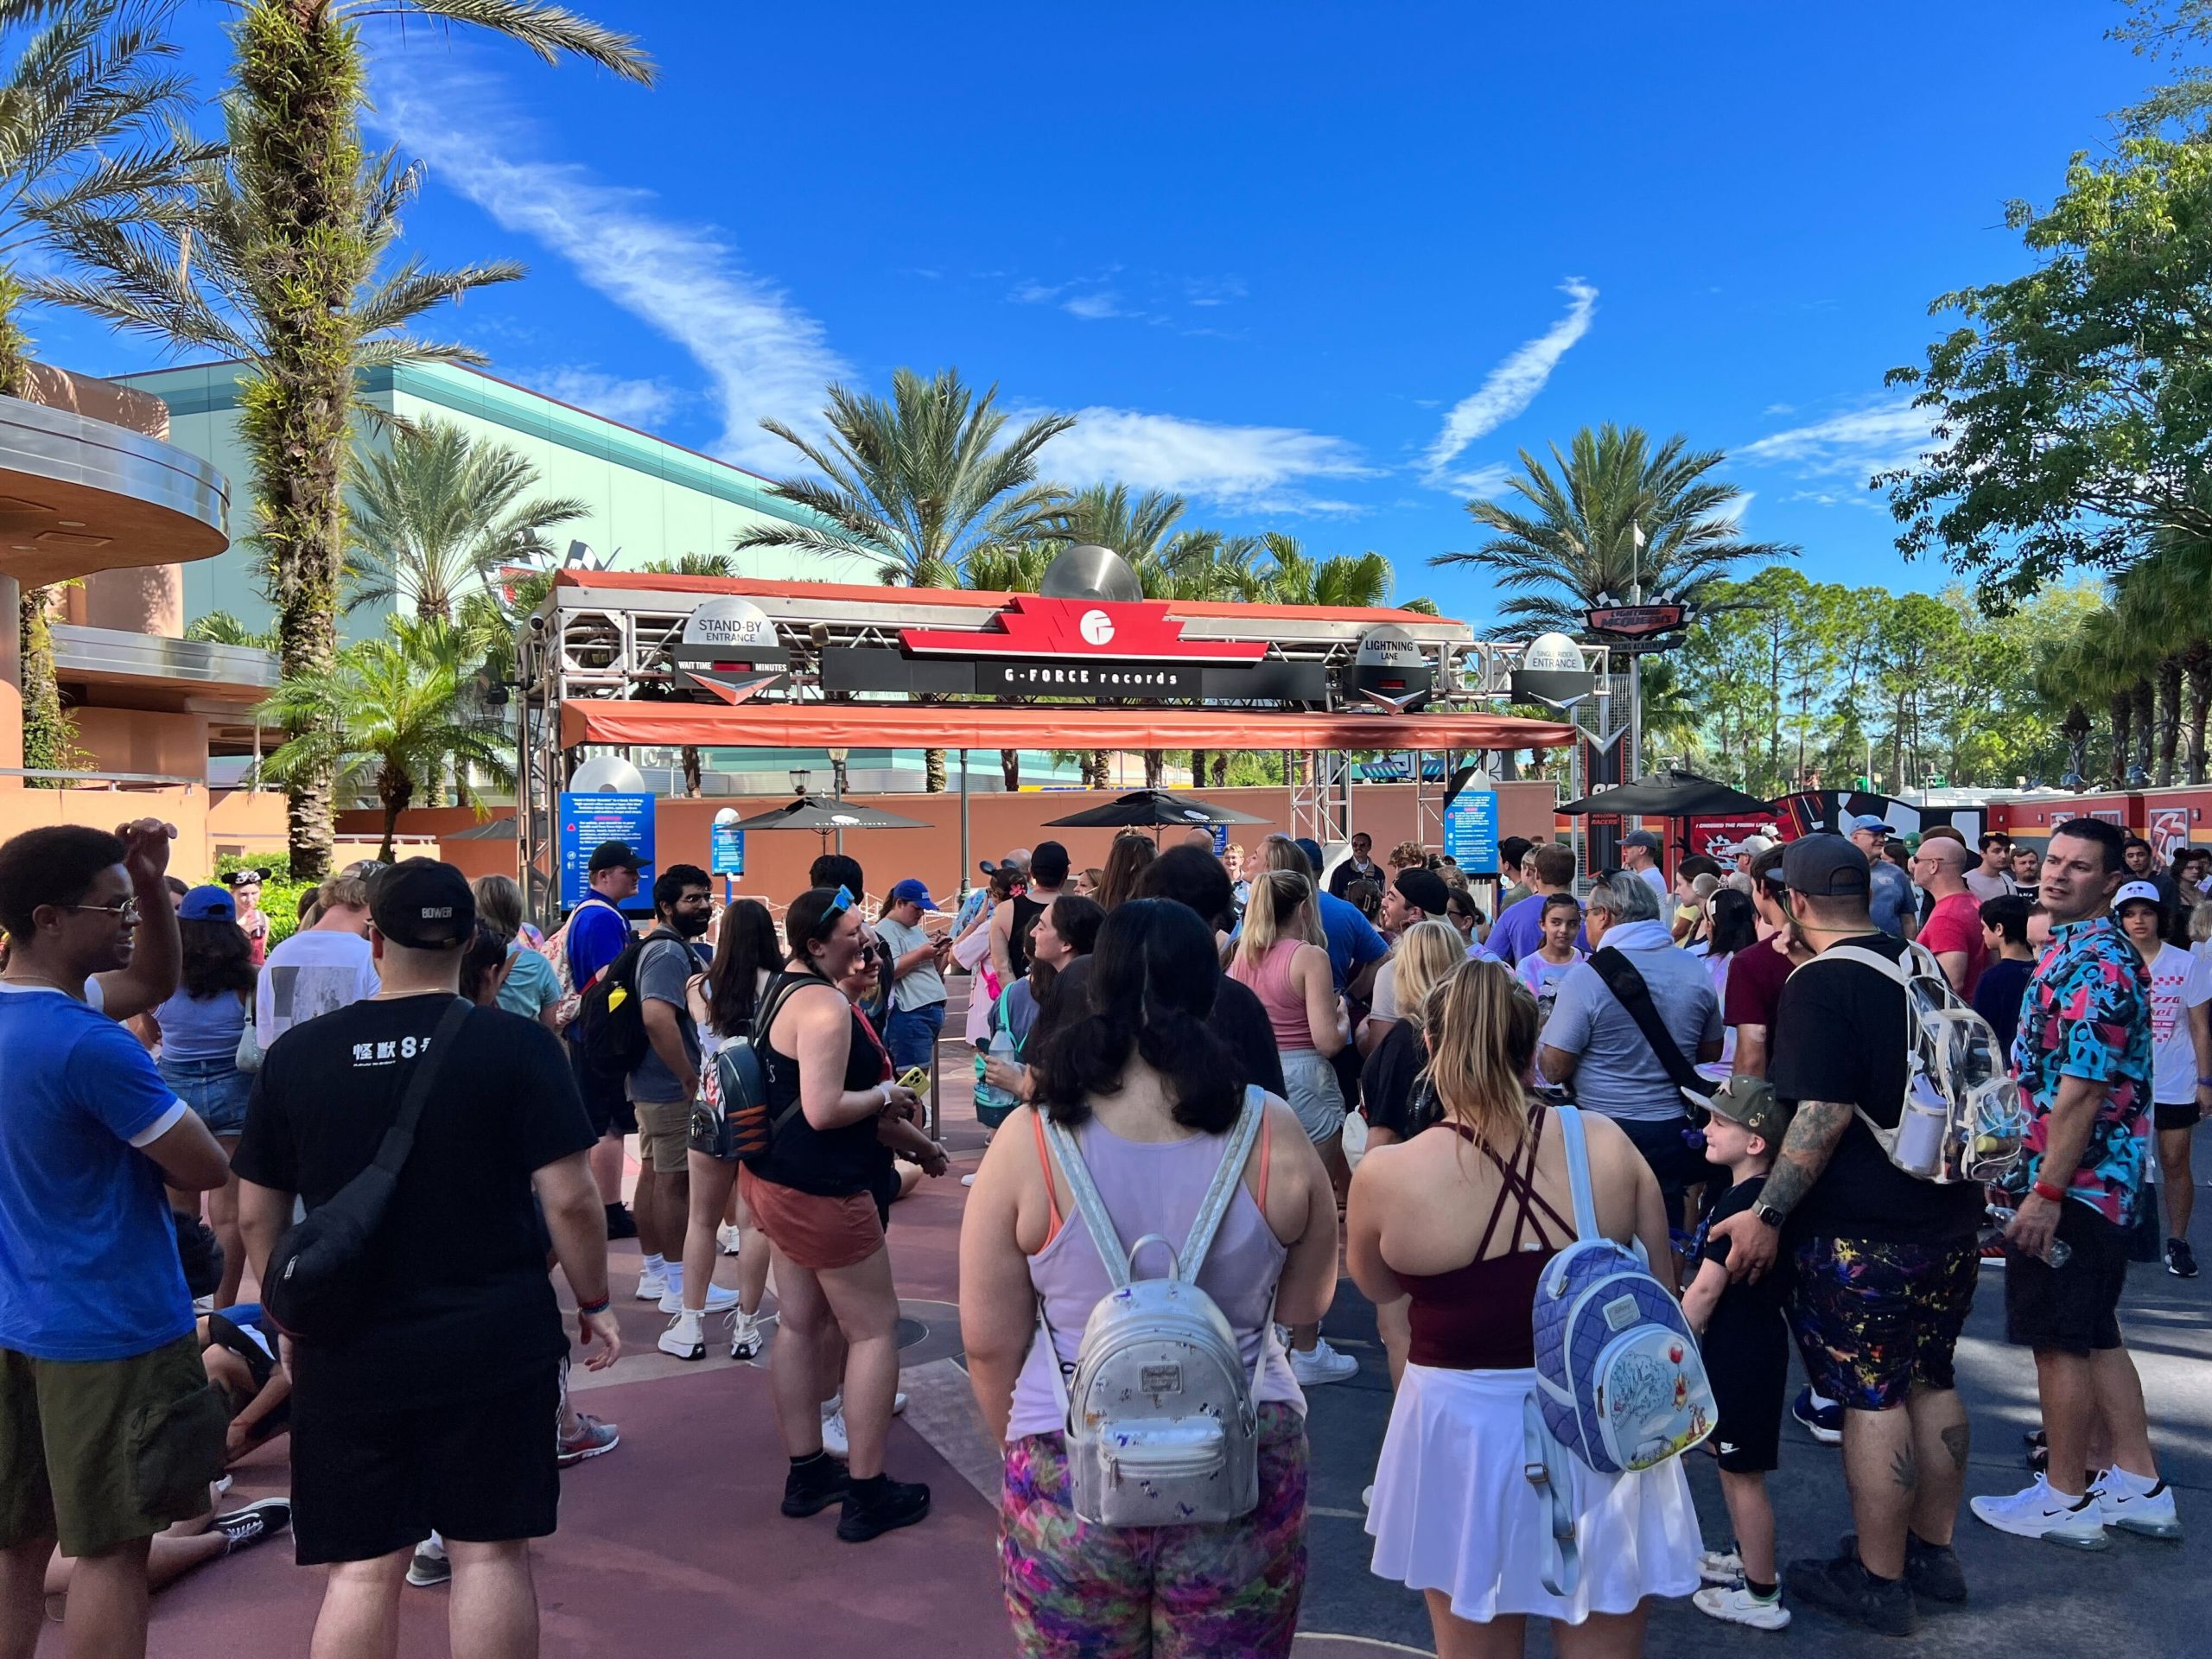
Disney’s Hollywood Studios

Photo: Playbuzz.com
Did the trend continue at Hollywood Studios? This park can fluctuate the most, depending on crowd sizes.
Also, we’ve got an x-factor this week, as Rock ‘n’ Roller Coaster Starring Aerosmith reopened after being offline throughout 2024.
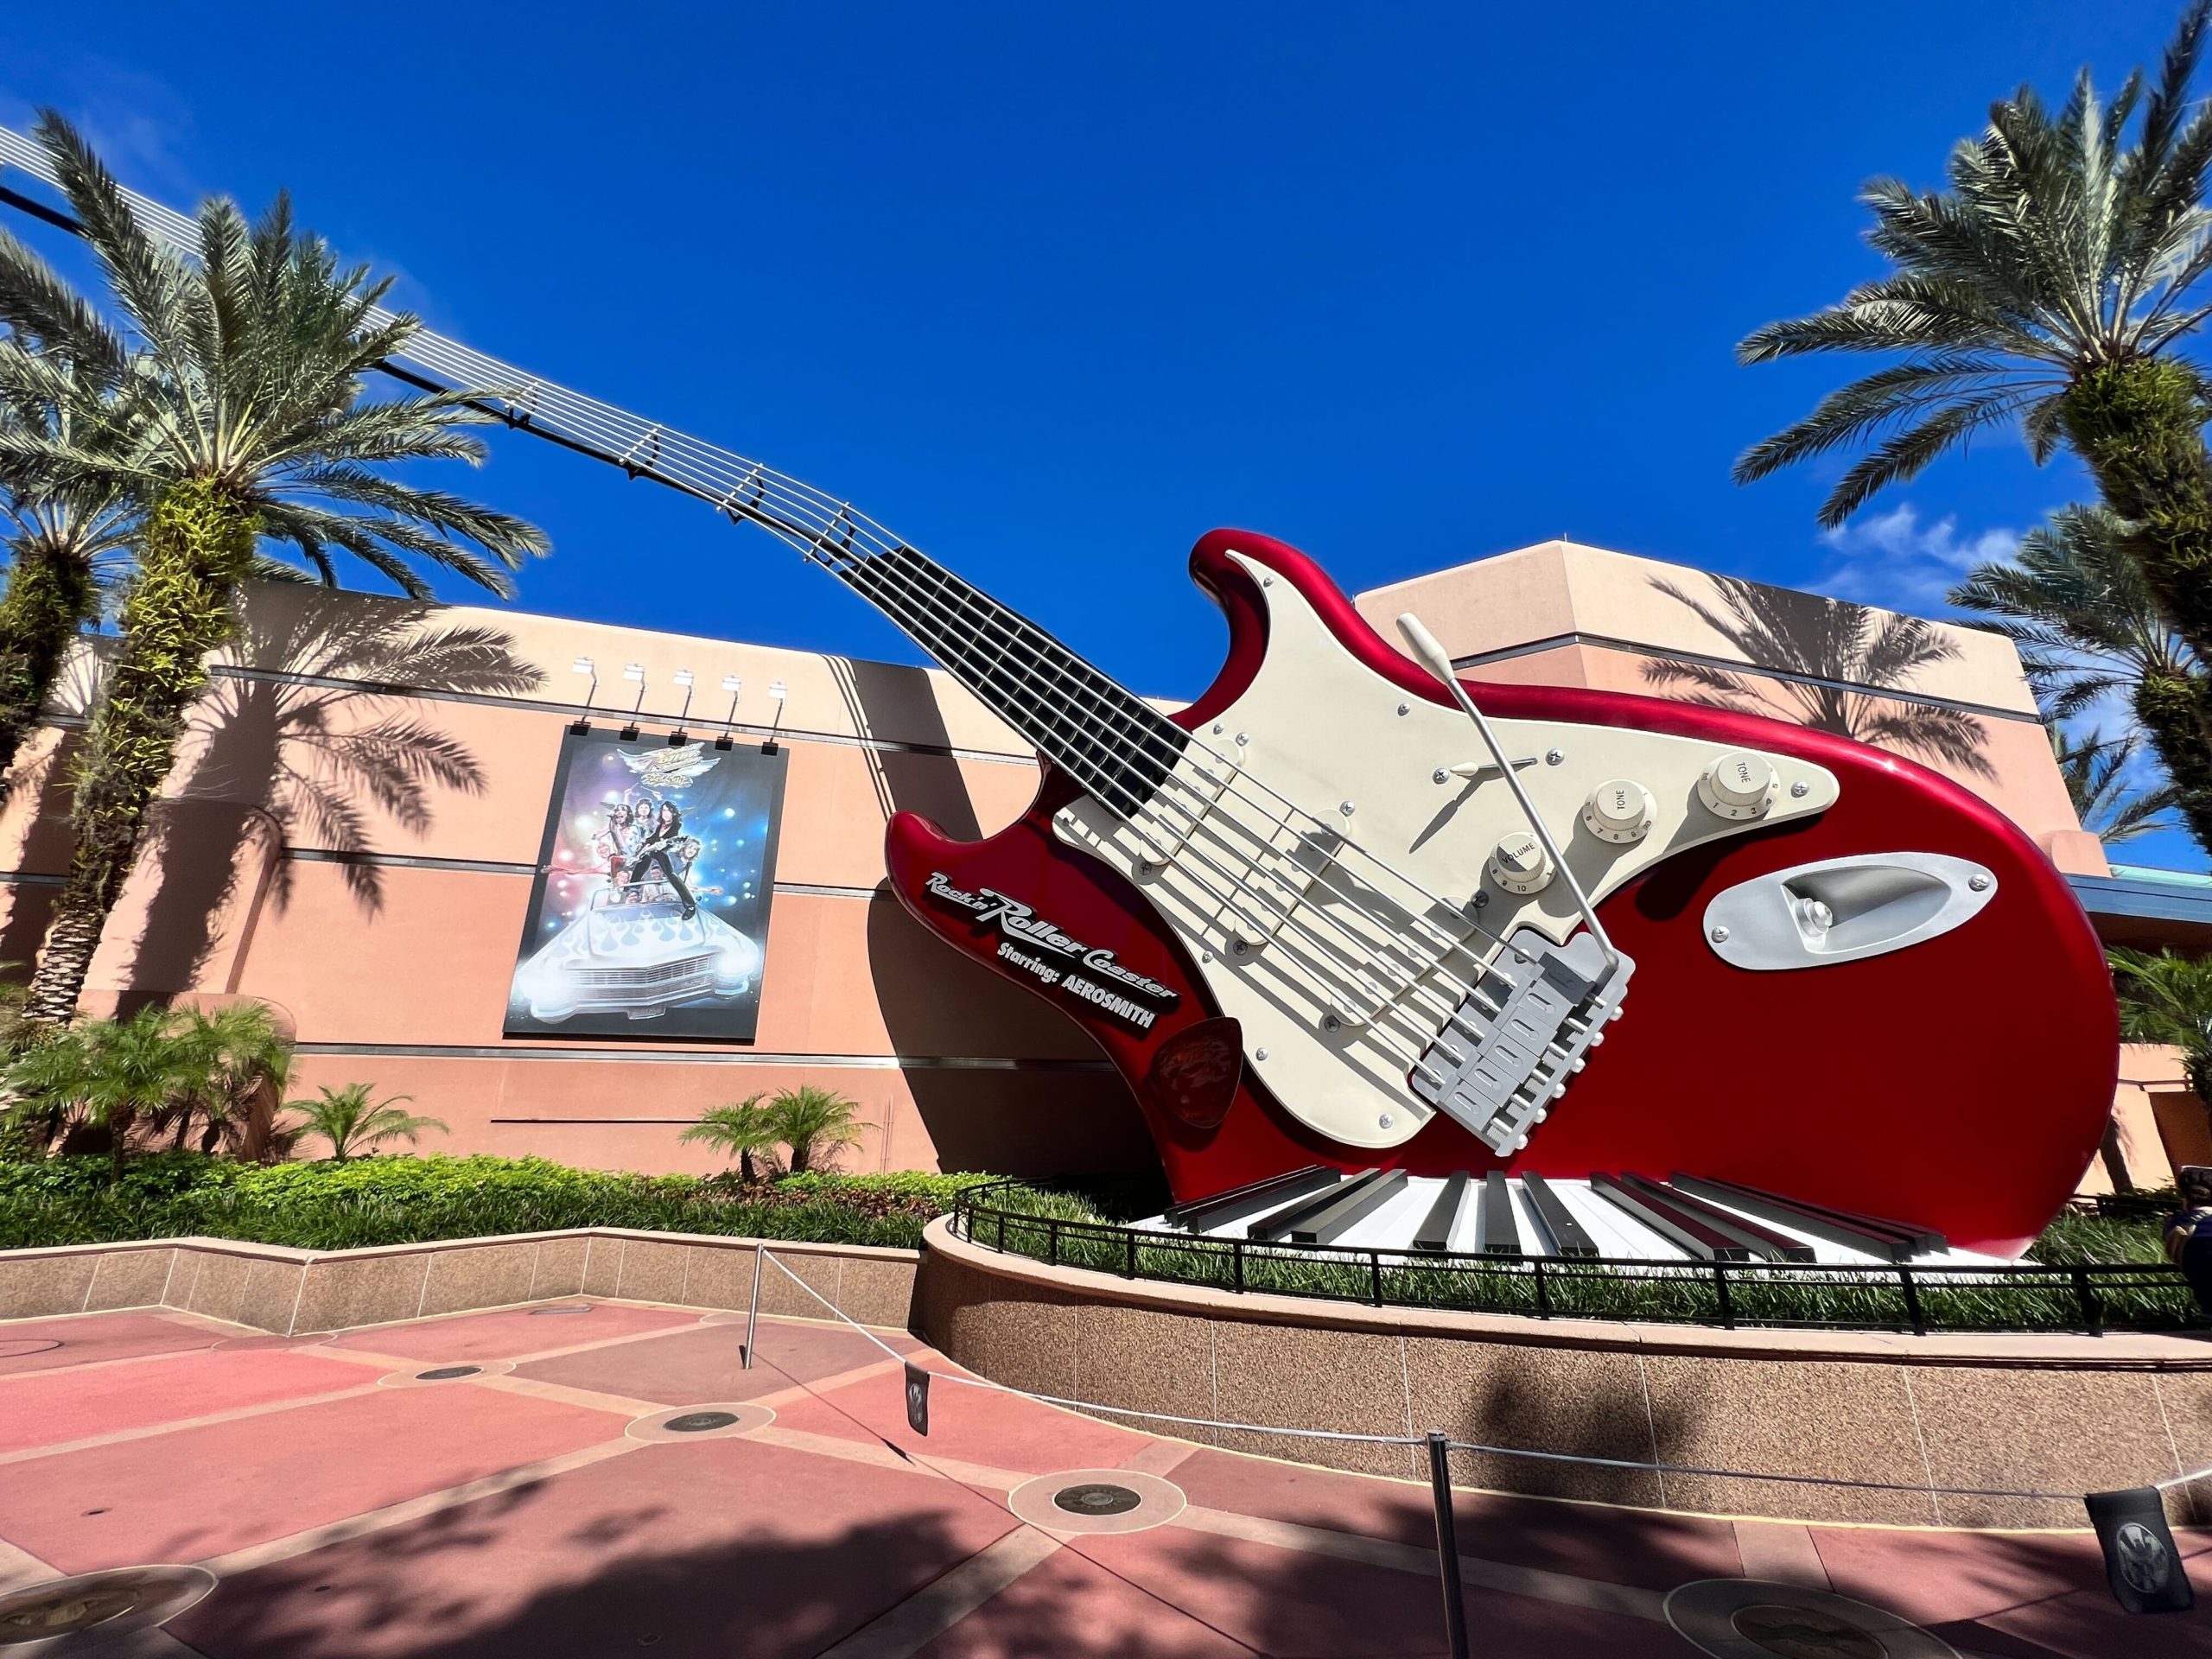
With one more E-ticket ride available, the wait times at the other attractions should have fallen.
That’s the very reason why Disney builds new rides. It helps manage the crowds through load-balancing.
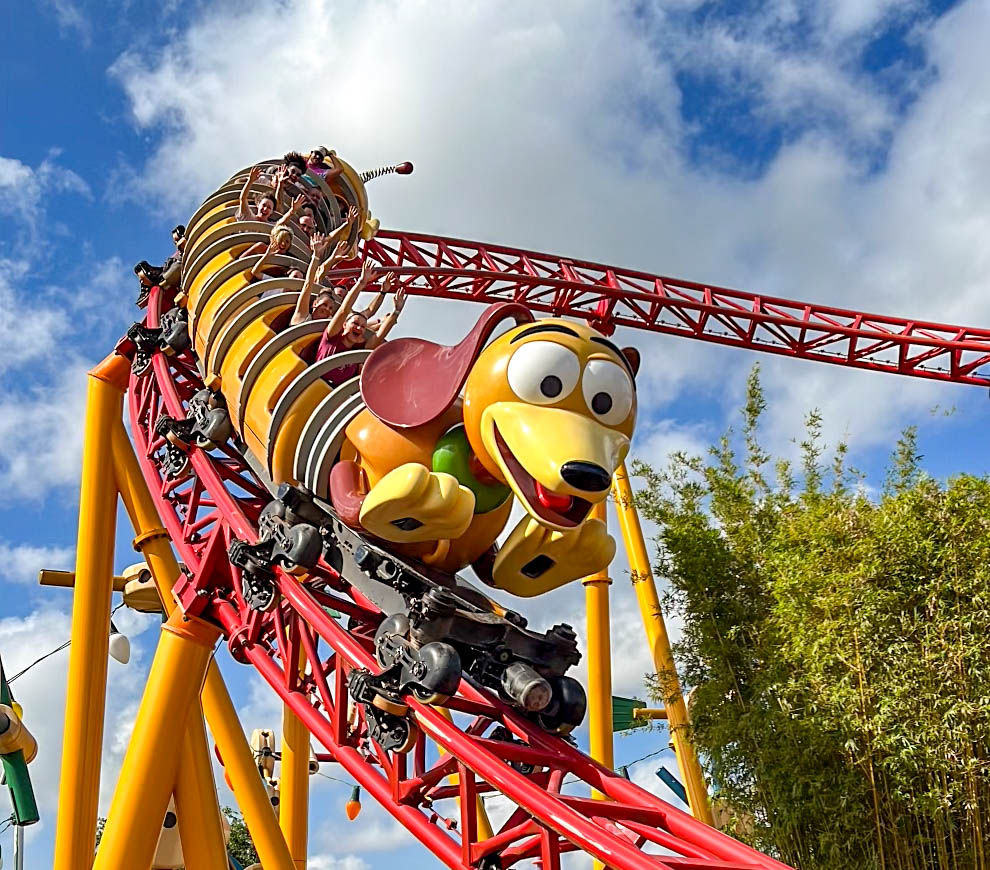
Slinky Dog Dash
Is that what happened this time? Here are the average wait times at Hollywood Studios last week:
- Slinky Dog Dash – 72 minutes, down 24
- Rock ‘n’ Roller Coaster Starring Aerosmith – 67 minutes, n/a
- Star Wars: Rise of the Resistance – 59 minutes, down 17
- Millennium Falcon: Smugglers Run – 56 minutes, down 10
- Twilight Zone Tower of Terror – 53 minutes, up 1
- Mickey & Minnie’s Runaway Railway – 49 minutes, down 7
- Toy Story Mania! – 49 minutes, down 5
- Red Carpet Dreams – 34 minutes, down 1
- Alien Swirling Saucers – 31 minutes, down 8
- Lightning McQueen’s Racing Academy – 17 minutes, up 2
- Celebrity Spotlight – 14 minutes, down 3
- Star Tours – The Adventures Continue – 13 minutes, down 5
- Muppet*Vision 3D – 10 minutes, no change
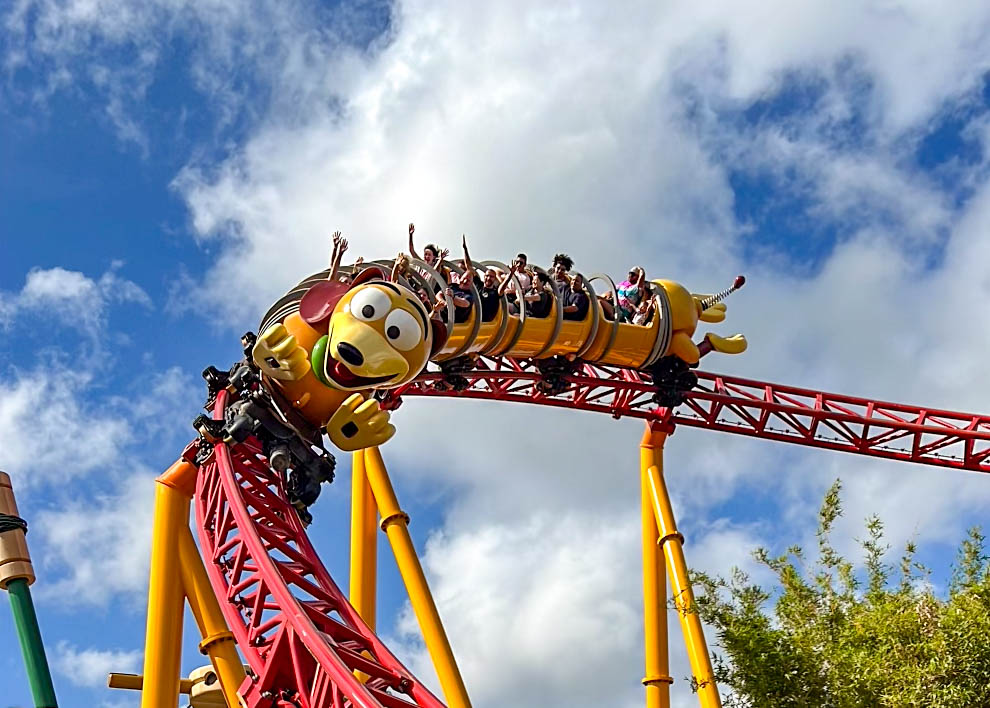
Slinky Dog Dash
Overall, we can follow the throughline here quite easily, with Hollywood Studios attractions averaging a wait of 35 minutes.
That’s four minutes less than last time, partially because Slinky Dog Dash dropped significantly.
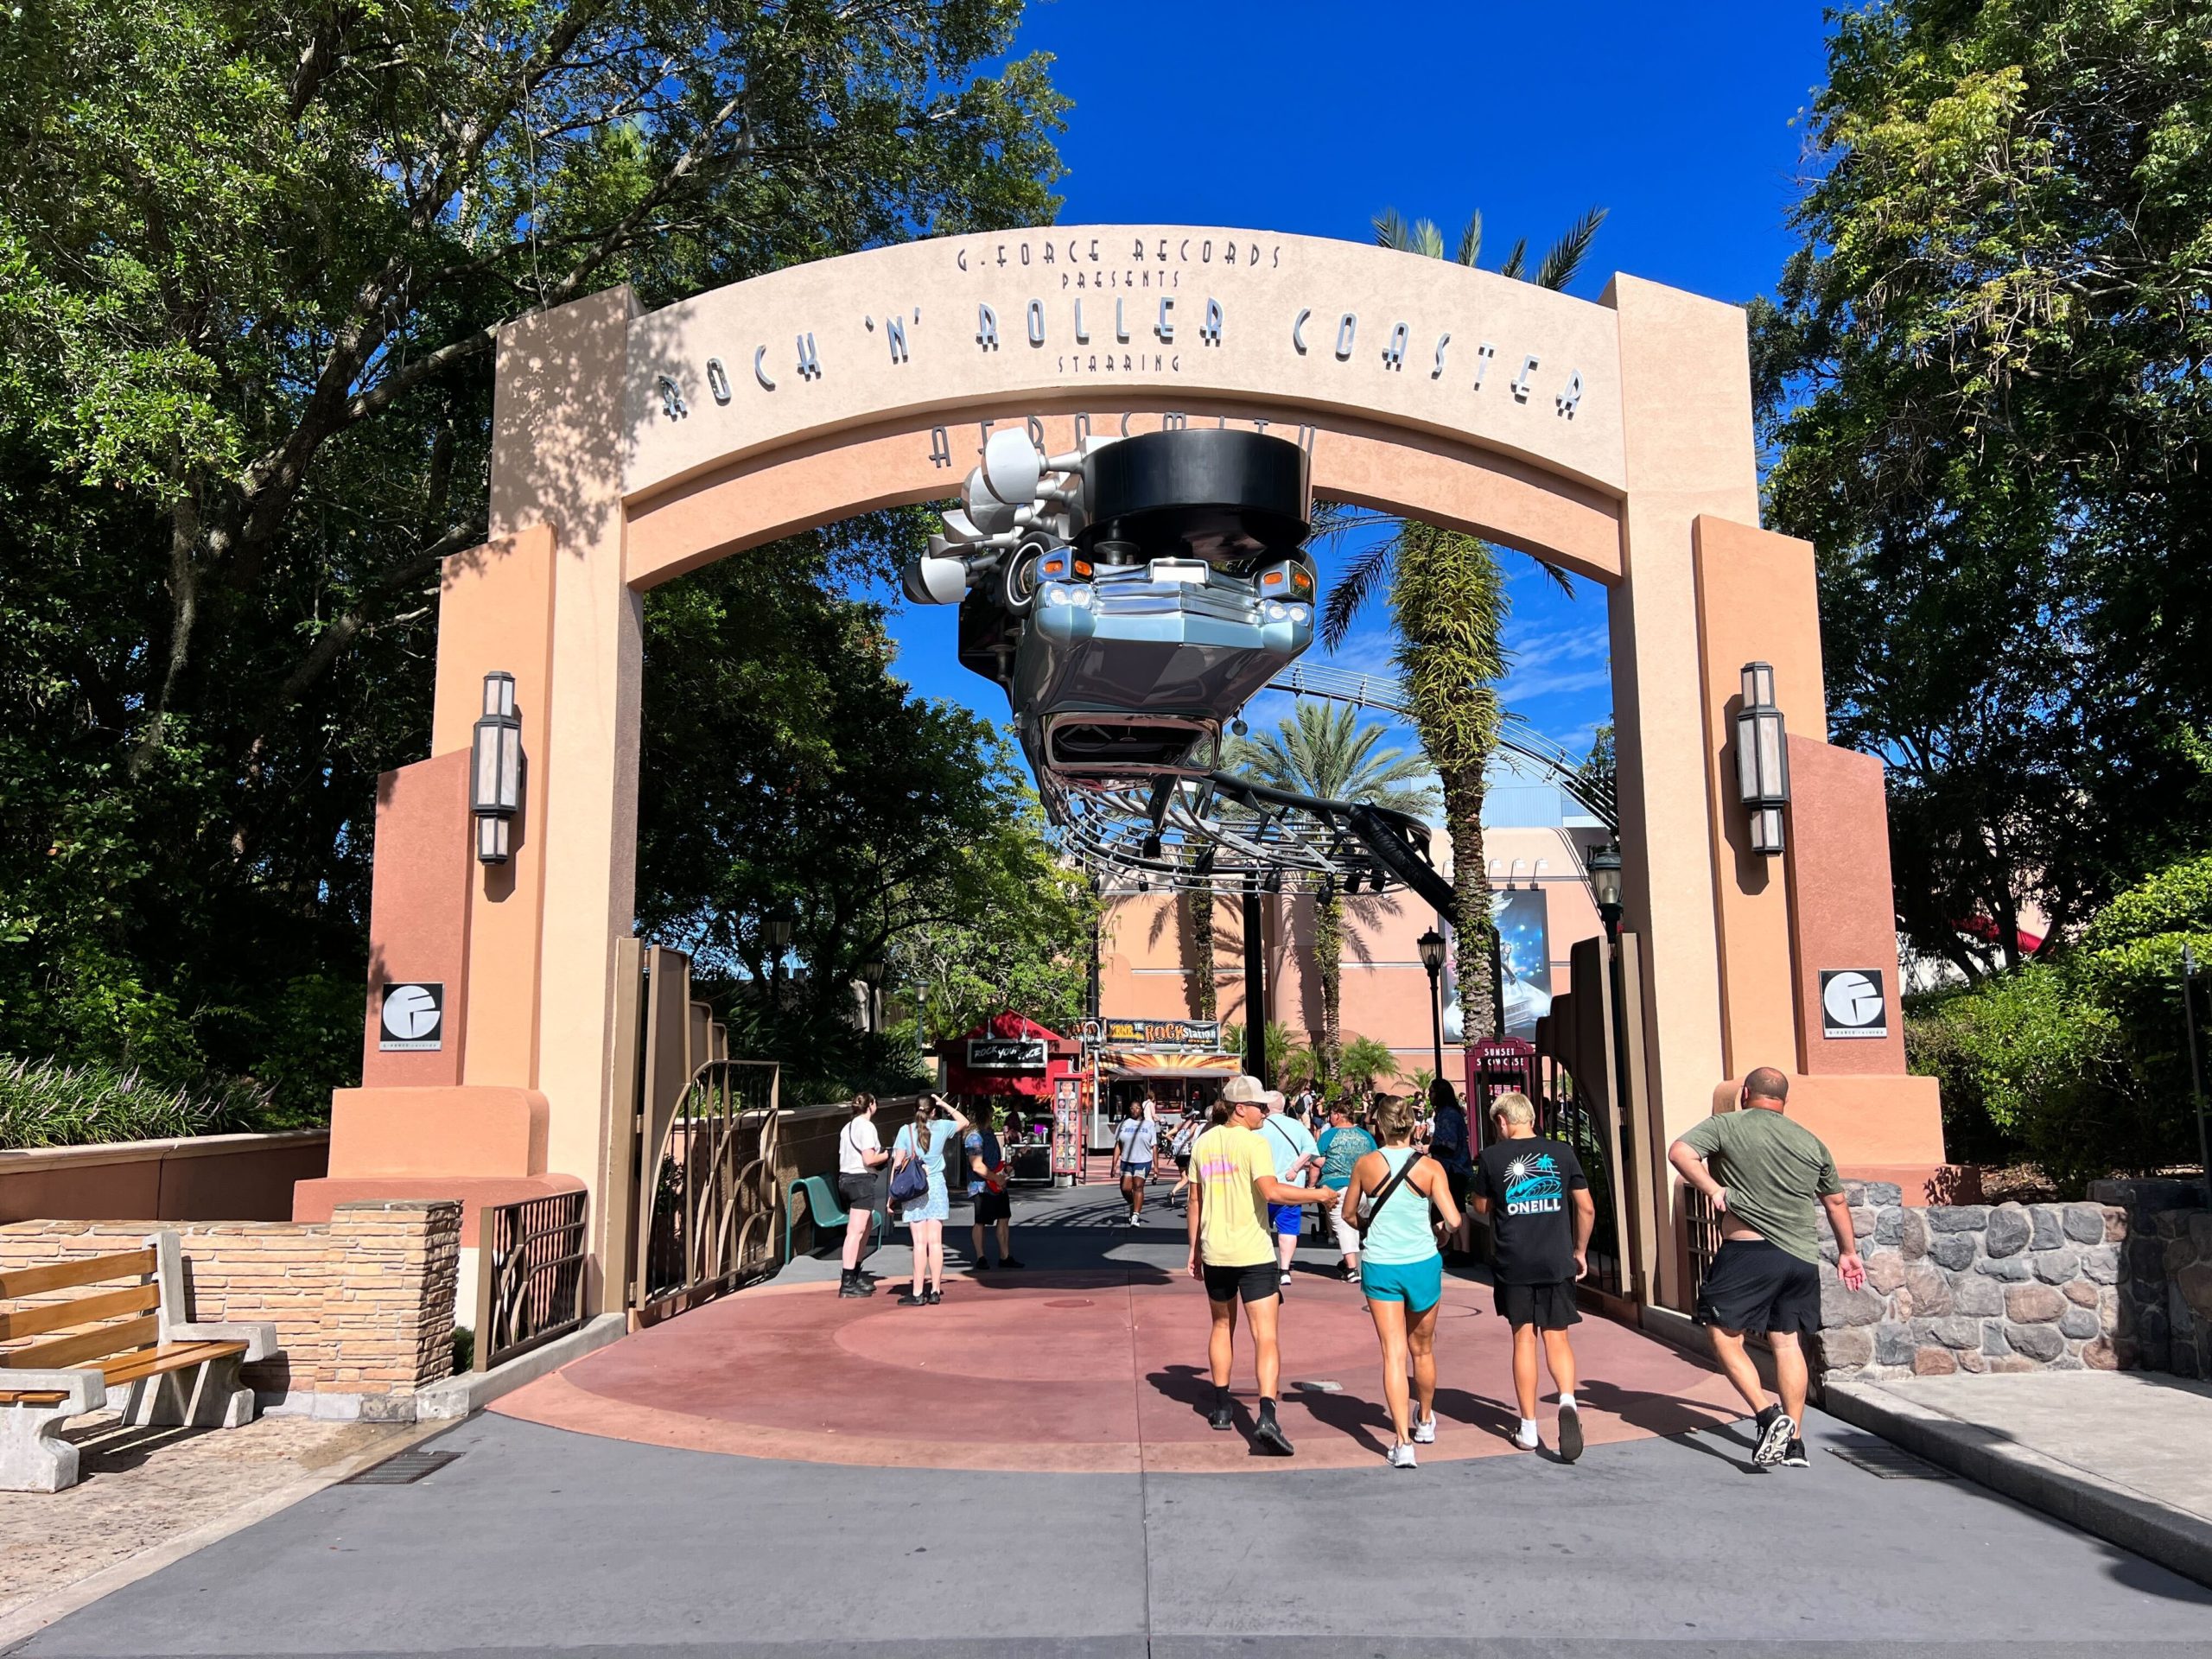
However, the real story is that with Rock ‘n’ Roller Coaster back up and running, guests spent more time on that side of the park.
After evaluating two theme parks, only two attractions have increased their wait times.
Not coincidentally, those are the ones closest to the Aerosmith coaster. That’s cause and effect.
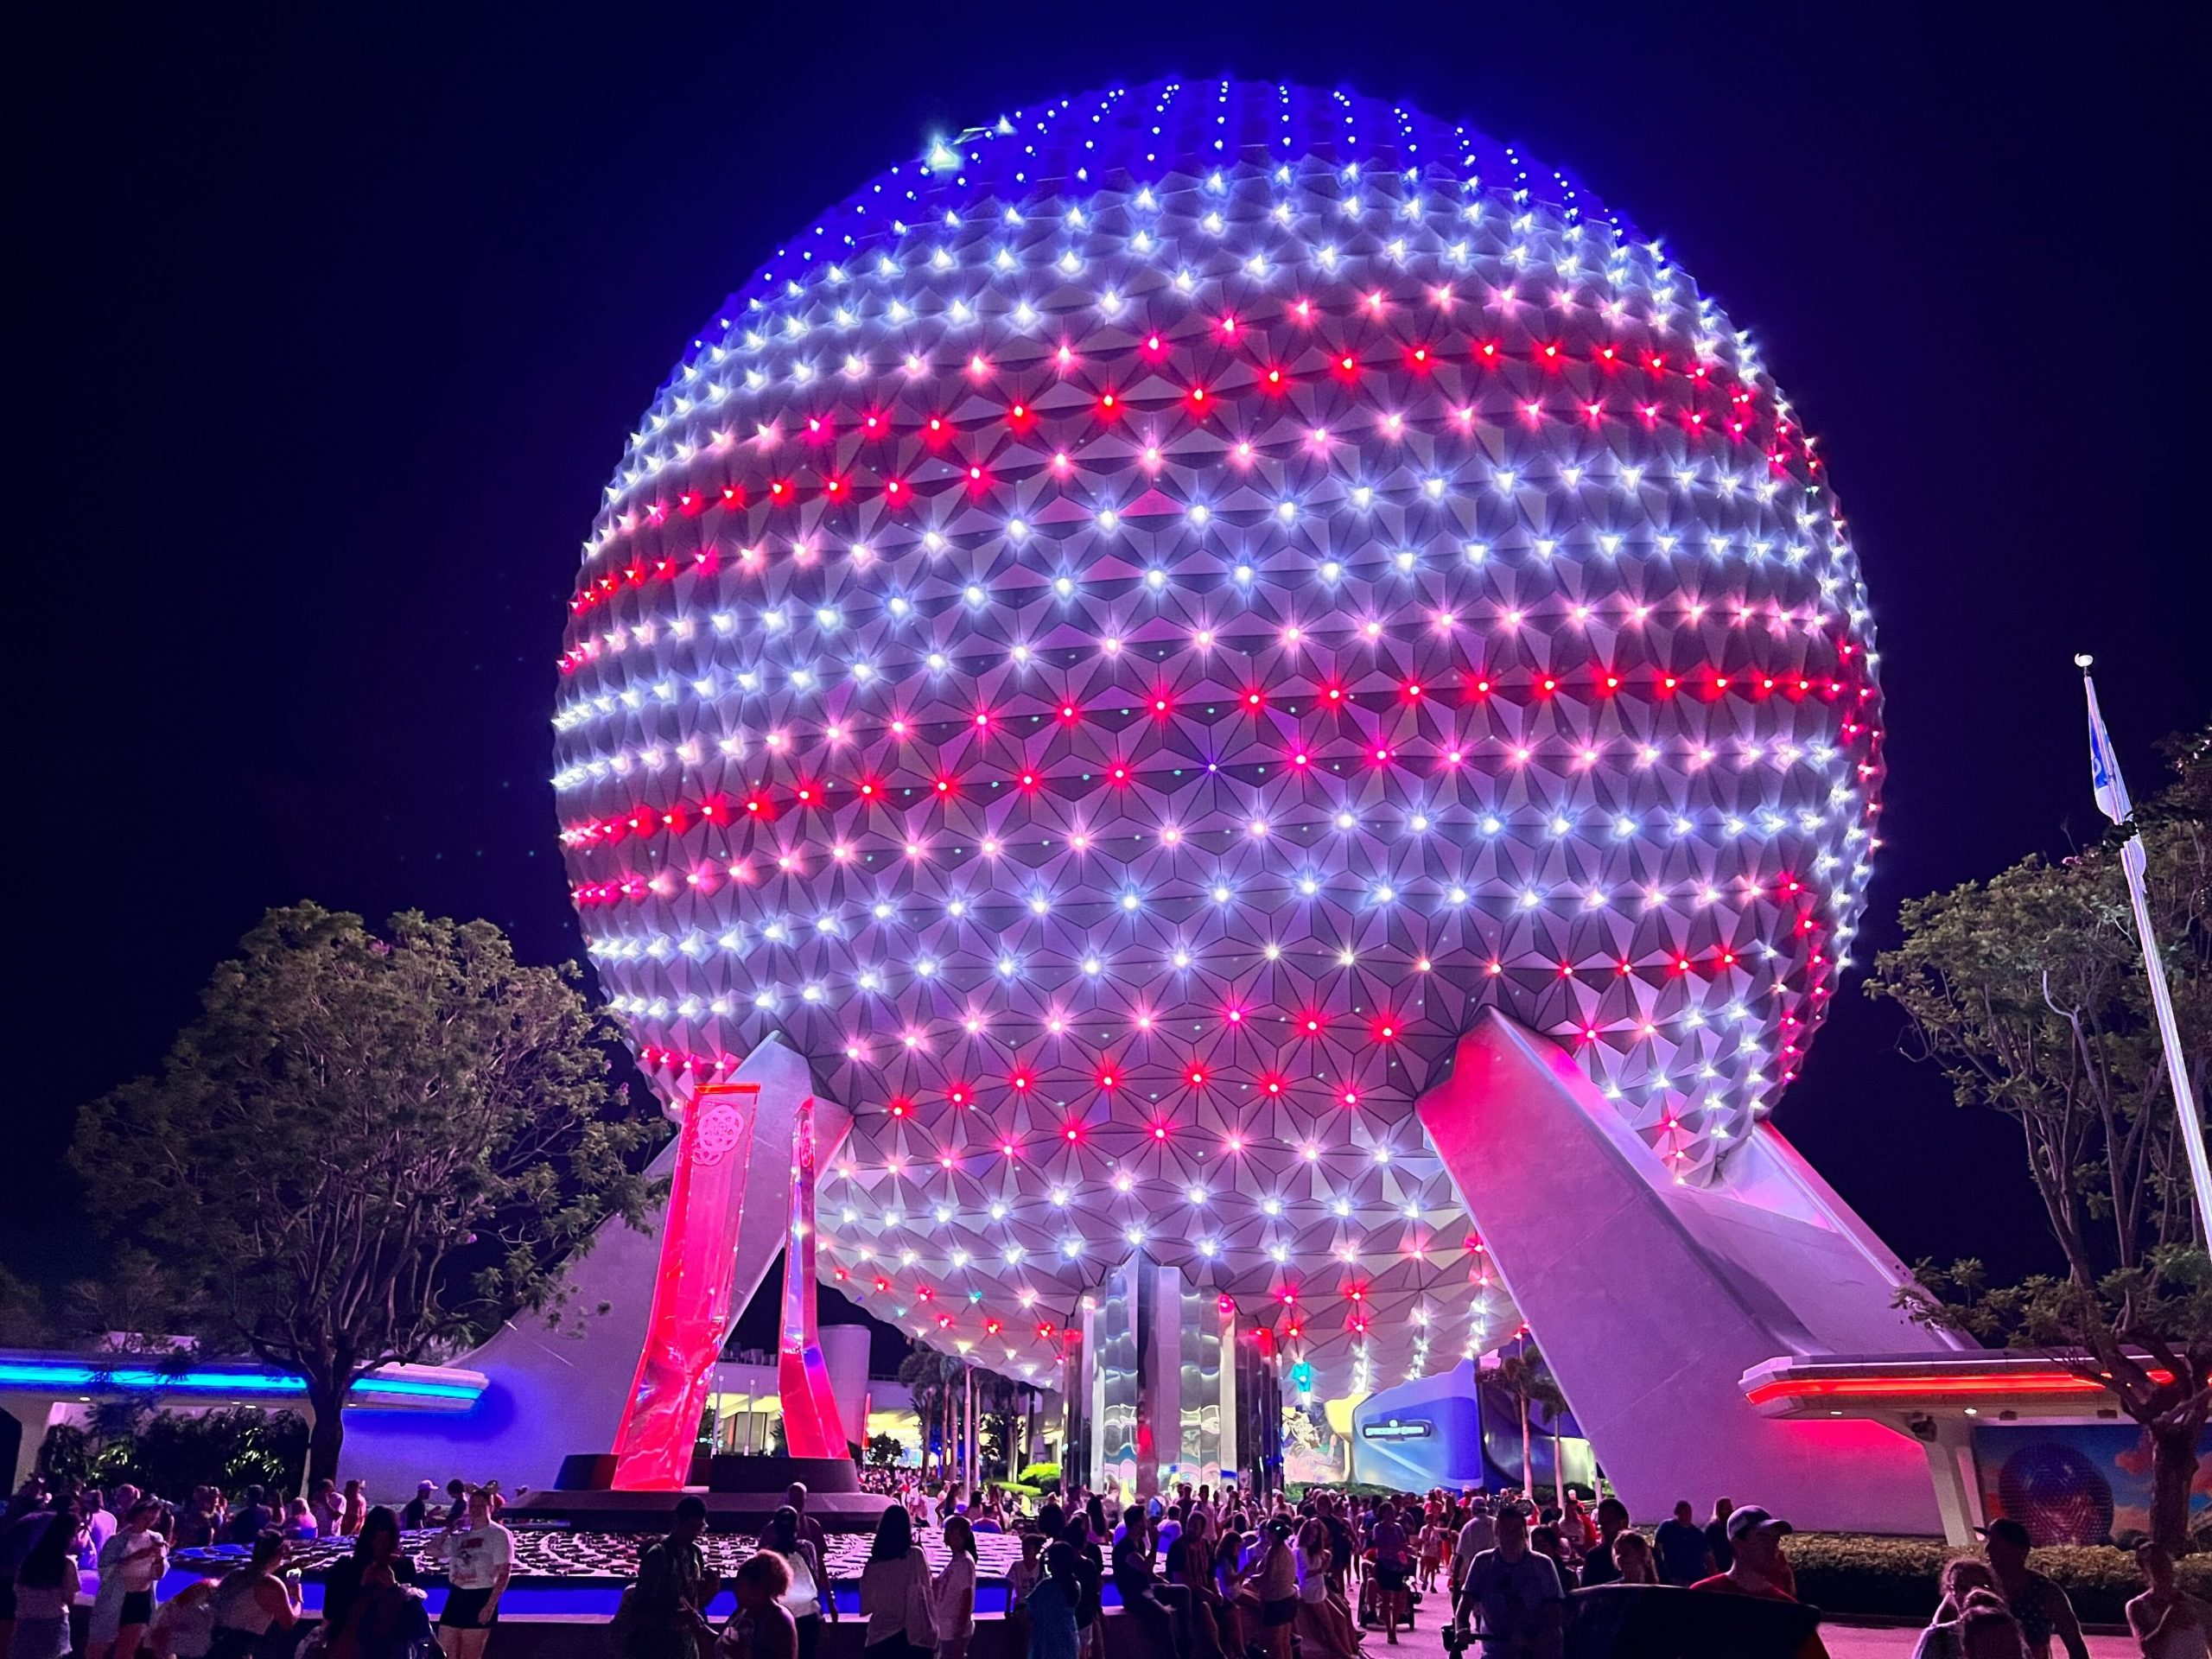
EPCOT
Still, the trend here appears to be lower wait times during the week of July 4th.
Did that pattern hold at EPCOT? Here are the park’s average wait times last week:
- Remy’s Ratatouille Adventure – 55 minutes, down 13
- Frozen Ever After – 53 minutes, down 2
- Soarin’ Around the World – 30 minutes, down 14
- Meet Mickey & Friends – 28 minutes, down 7
- Mission: SPACE – 26 minutes, down 9
- Royal Sommerhus – 25 minutes, down 6
- Turtle Talk with Crush – 19 minutes, no change
- Spaceship Earth – 17 minutes, down 5
- The Seas with Nemo & Friends – 13 minutes, down 4
- Journey into Imagination with Figment – 12 minutes, down 6
- Gran Fiesta Tour Starring the Three Caballeros – 8 minutes, down 5
- Living with the Land – 7 minutes, down 7
Okay, this data speaks for itself. EPCOT attractions averaged a wait of 25 minutes, which is five minutes less than last time.
To a larger point, it’s rare for no ride at EPCOT to average a 60-minute wait.

Credit: Disney
For that to happen during the week of July 4th is…quite stunning.
How much of a factor are the new, untimed experiences like Journey of Water | Inspired by Moana and CommuniCore Hall & Plaza?
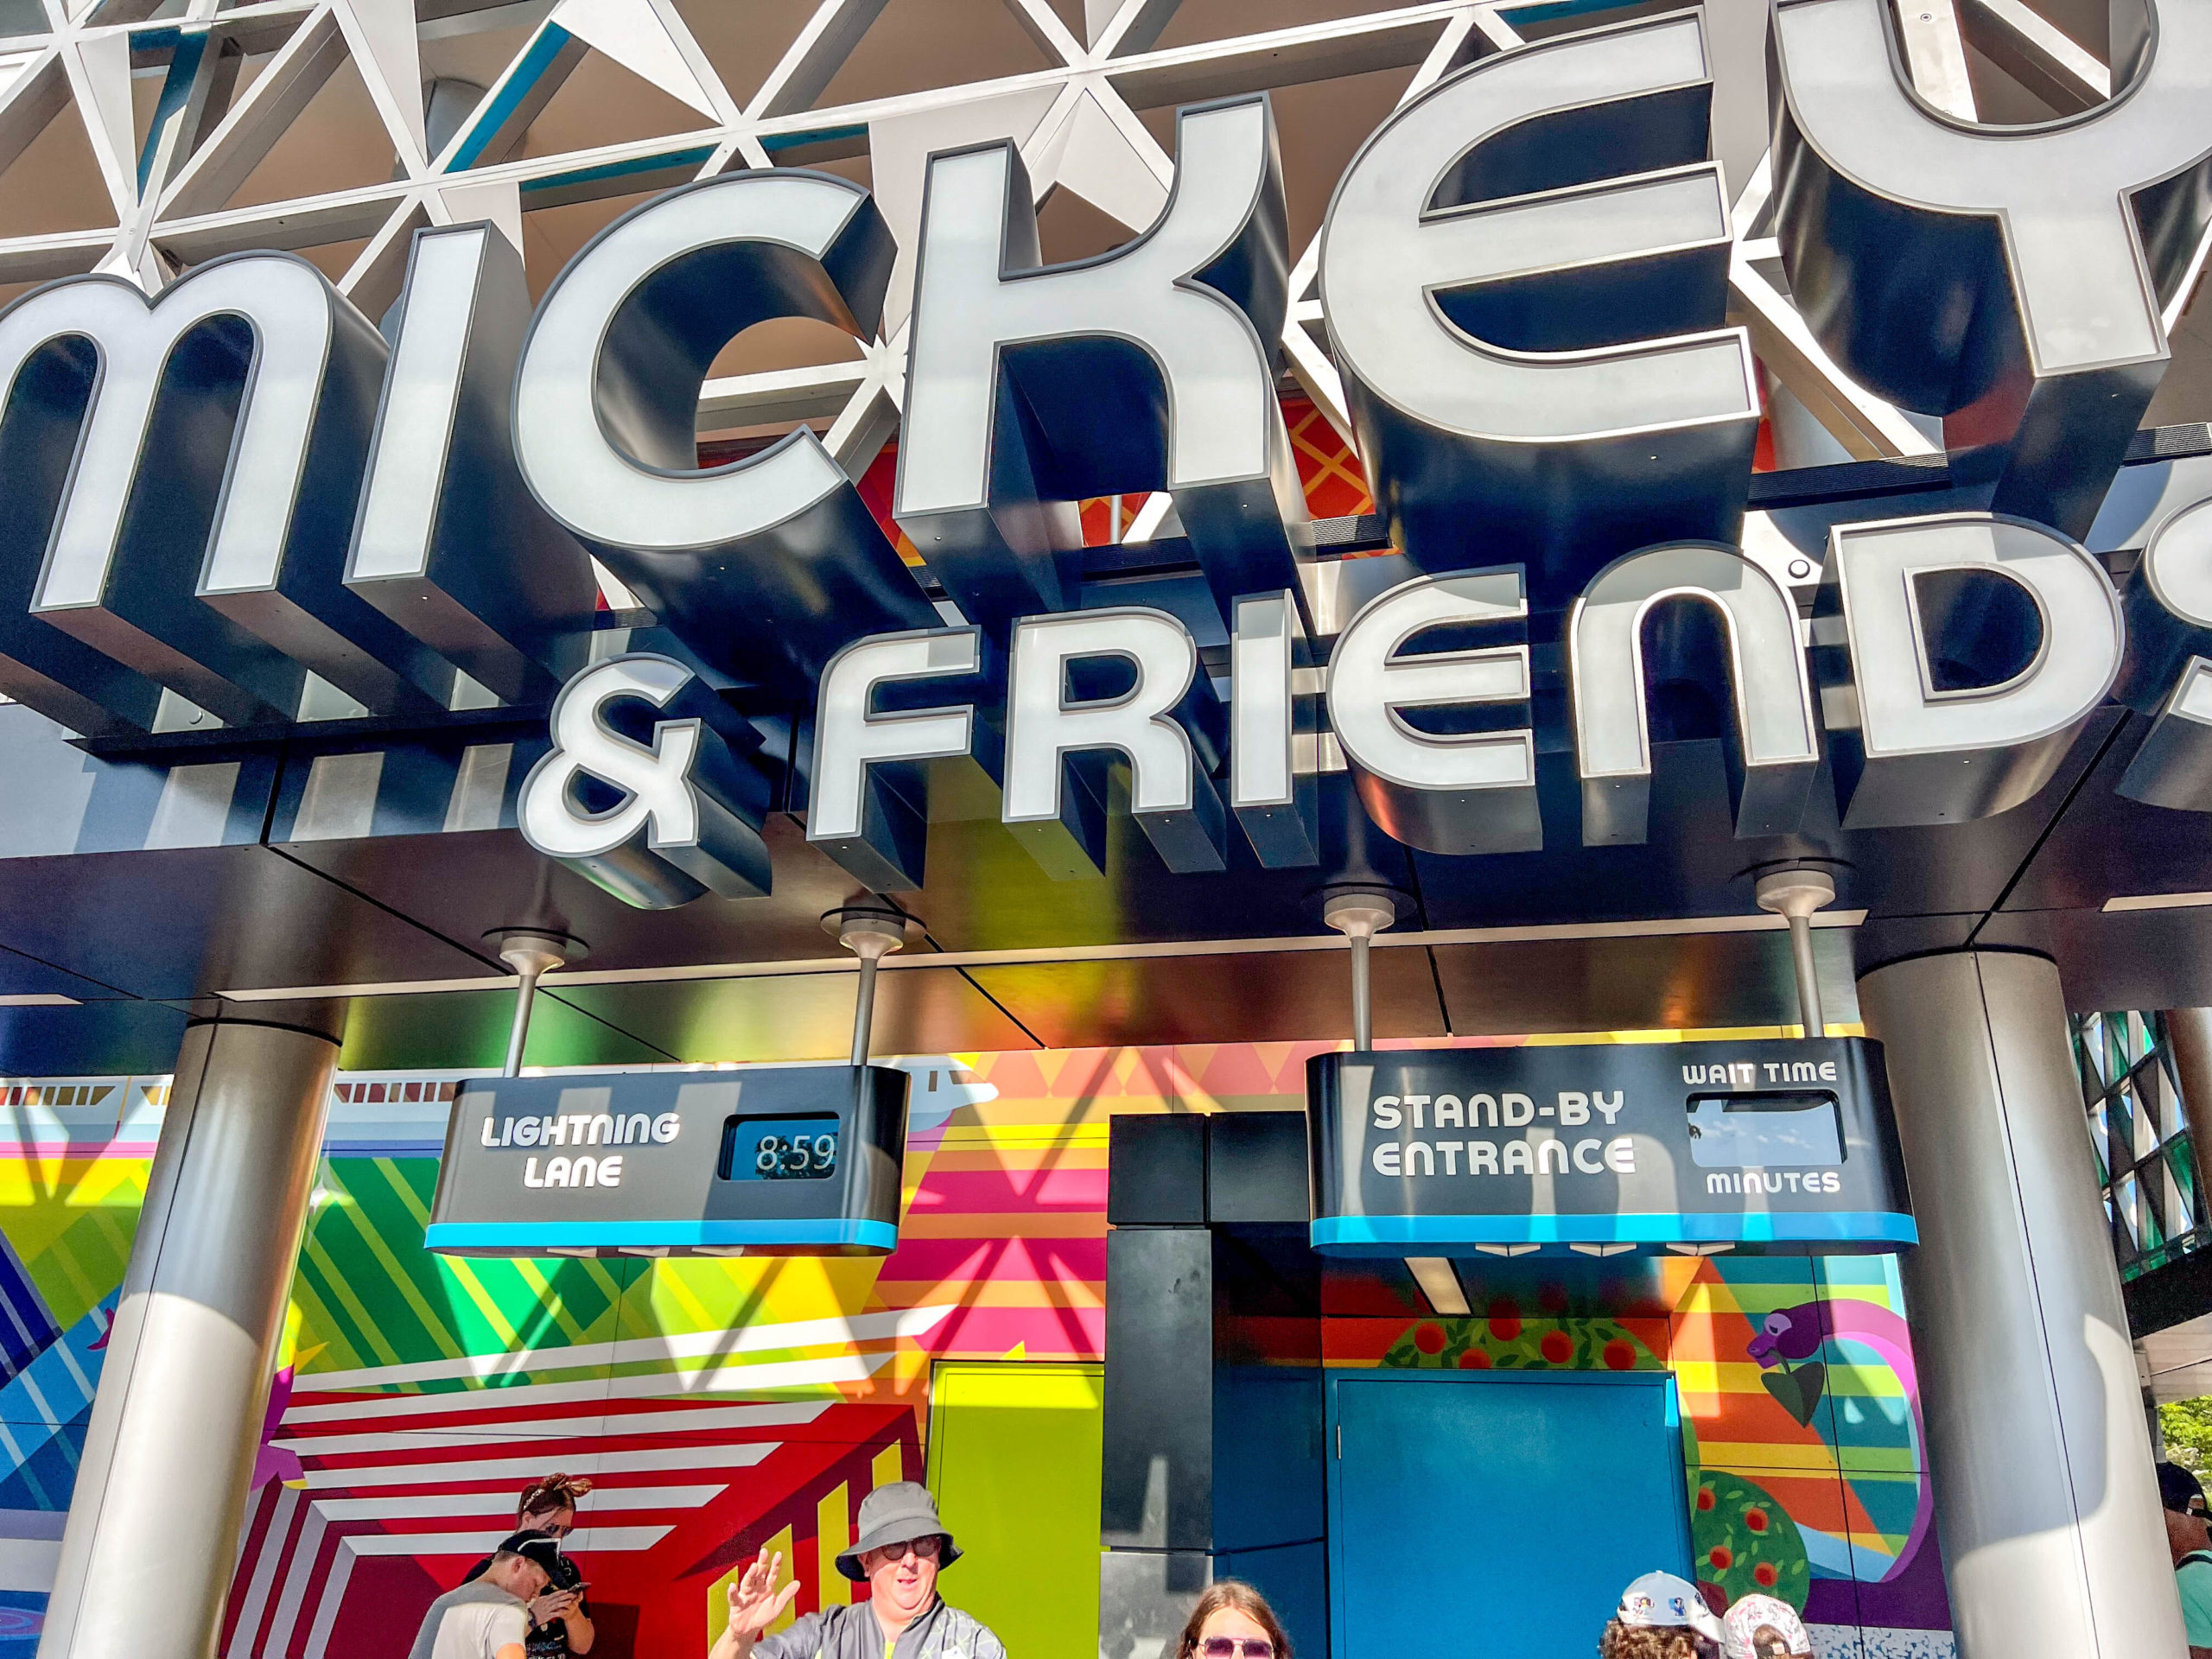
That’s challenging to say, although we do include the Mickey Mouse greeting.
Still, this is a surprising turn of events.
Magic Kingdom

Photo: Disney
I think we know the deal by now. So, here are Magic Kingdom’s average wait times last week:
- Seven Dwarfs Mine Train – 60 minutes, down 6
- Space Mountain – 52 minutes, down 3
- Peter Pan’s Flight – 49 minutes, down 5
- Big Thunder Mountain Railroad – 45 minutes, no change
- Jungle Cruise – 42 minutes, down 6
- Princess Fairytale Hall – 40 minutes, down 3
- Haunted Mansion – 36 minutes, down 8
- Town Square Theater – 34 minutes, down 3
- Ariel’s Grotto – 32 minutes, down 3
- The Many Adventures of Winnie the Pooh – 32 minutes, down 5
- Buzz Lightyear’s Space Ranger Spin – 31 minutes, down 6
- Pete’s Silly Sideshow – 27 minutes, down 4
- Astro Orbiter – 26 minutes, down 5
- Enchanted Tales with Belle – 25 minutes, down 3
- Pirates of the Caribbean – 25 minutes, down 9
- It’s a Small World – 23 minutes, down 6
- Under the Sea ~ Journey of the Little Mermaid – 19 minutes, down 13
- Mickey’s PhilharMagic – 18 minutes, no change
- The Barnstormer – 16 minutes, down 7
- Monsters, Inc. Laugh Floor – 16 minutes, down 3
- Tomorrowland Speedway – 16 minutes, down 2
- The Magic Carpets of Aladdin – 14 minutes, down 2
- Walt Disney World Railroad – 14 minutes, down 2
- Mad Tea Party – 12 minutes, down 2
- Tomorrowland Transit Authority PeopleMover – 12 minutes, down 4
- Dumbo the Flying Elephant – 11 minutes, down 7
- Prince Charming Regal Carrousel – 10 minutes, down 1
- Walt Disney’s Carousel of Progress – 5 minutes, no change
Final Thoughts
Overall, guests stood in line for an average of 26 minutes per Magic Kingdom attraction, which is three minutes less than last time.
To a larger point, the data is clear throughout the parks. People spent less time waiting to experience their favorite attractions.
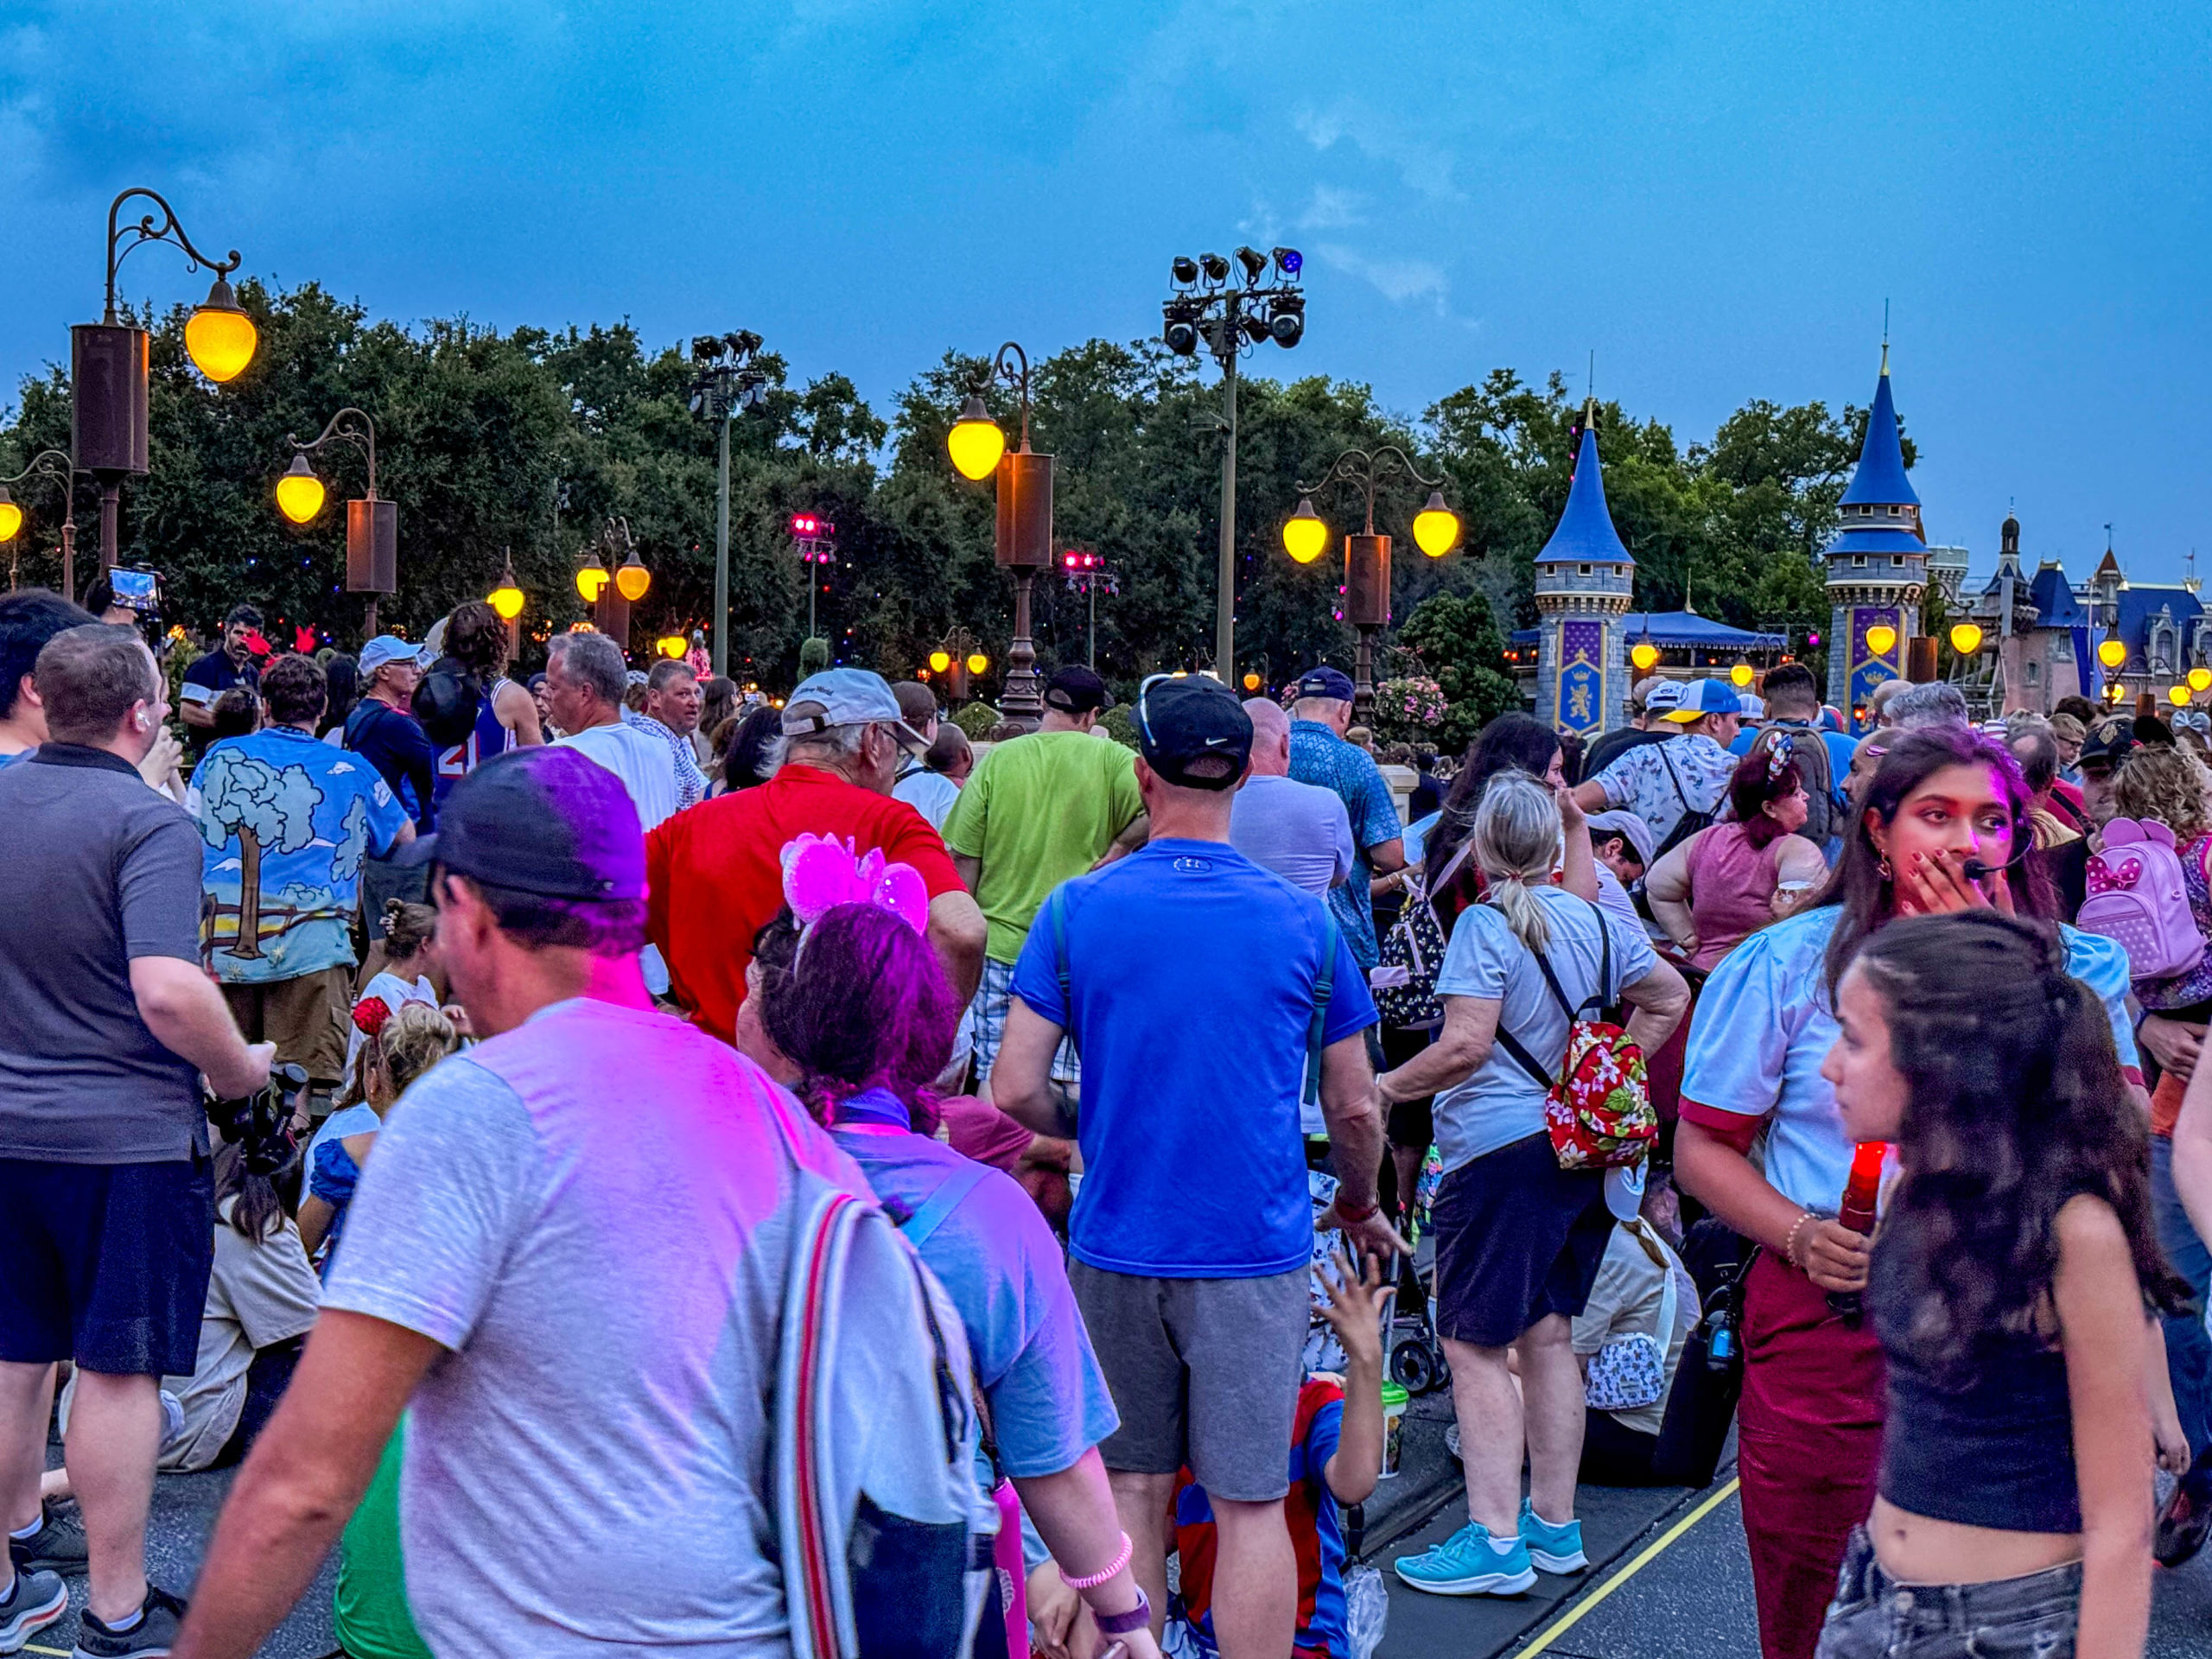
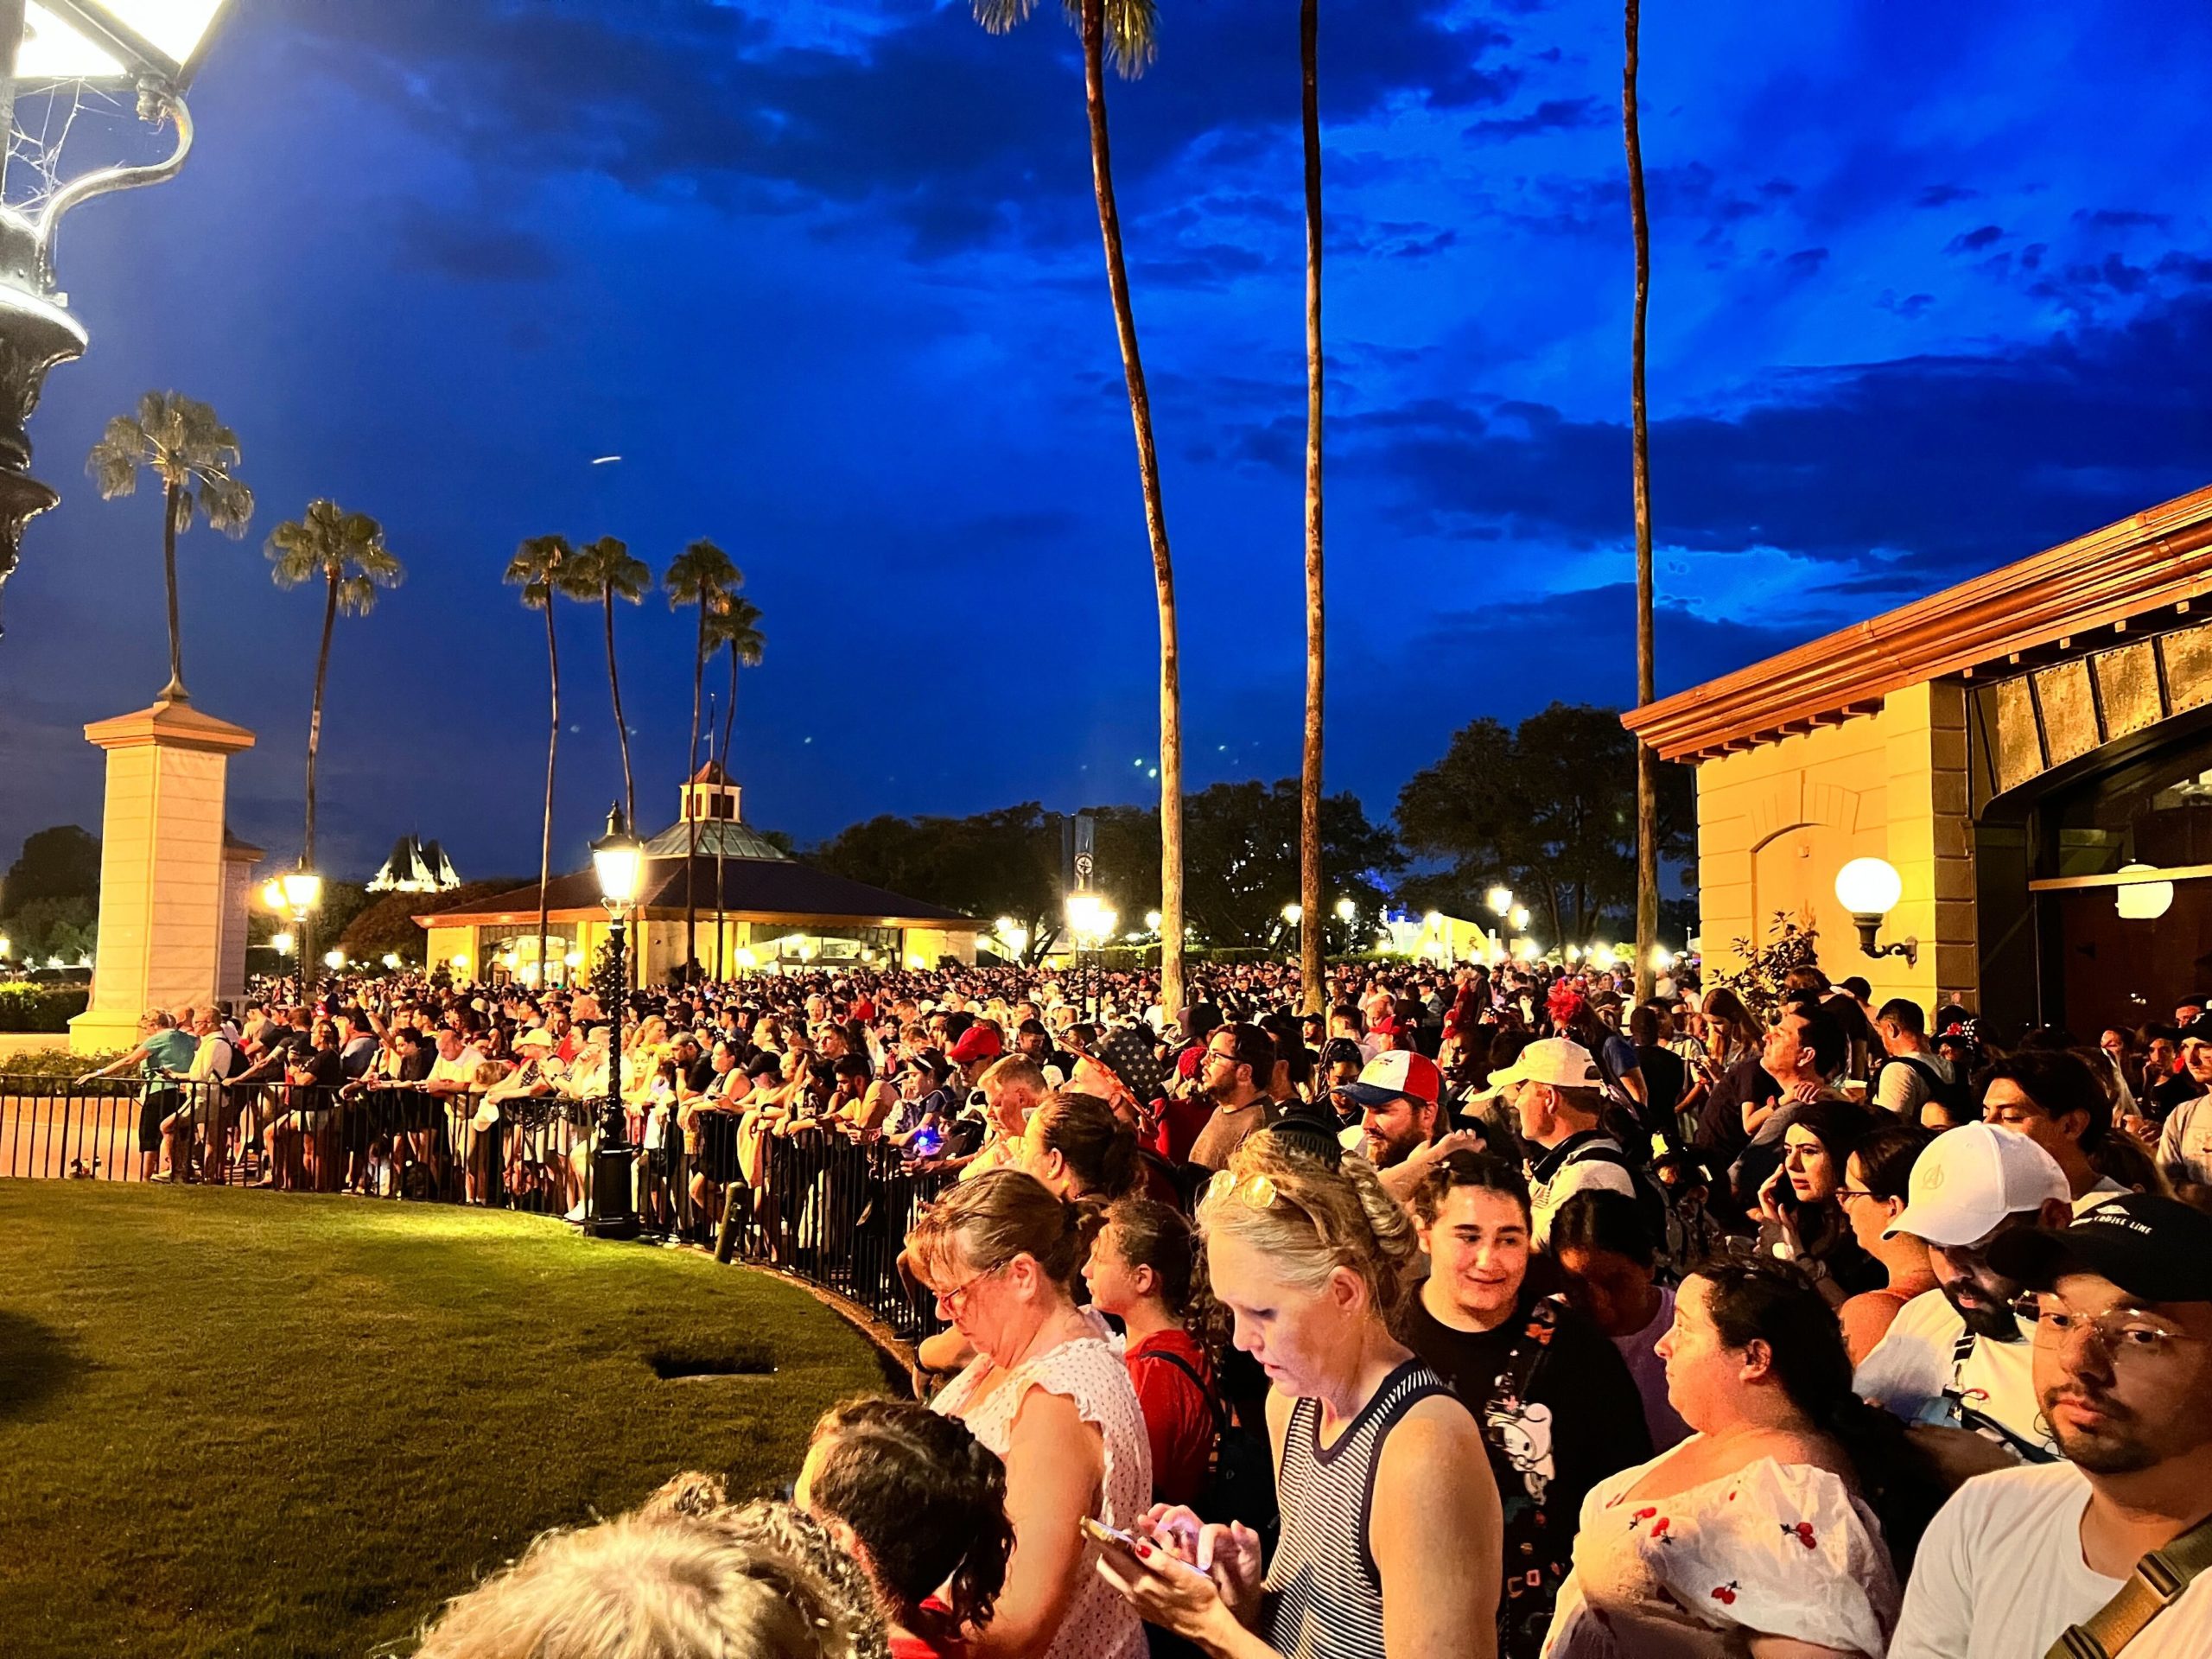
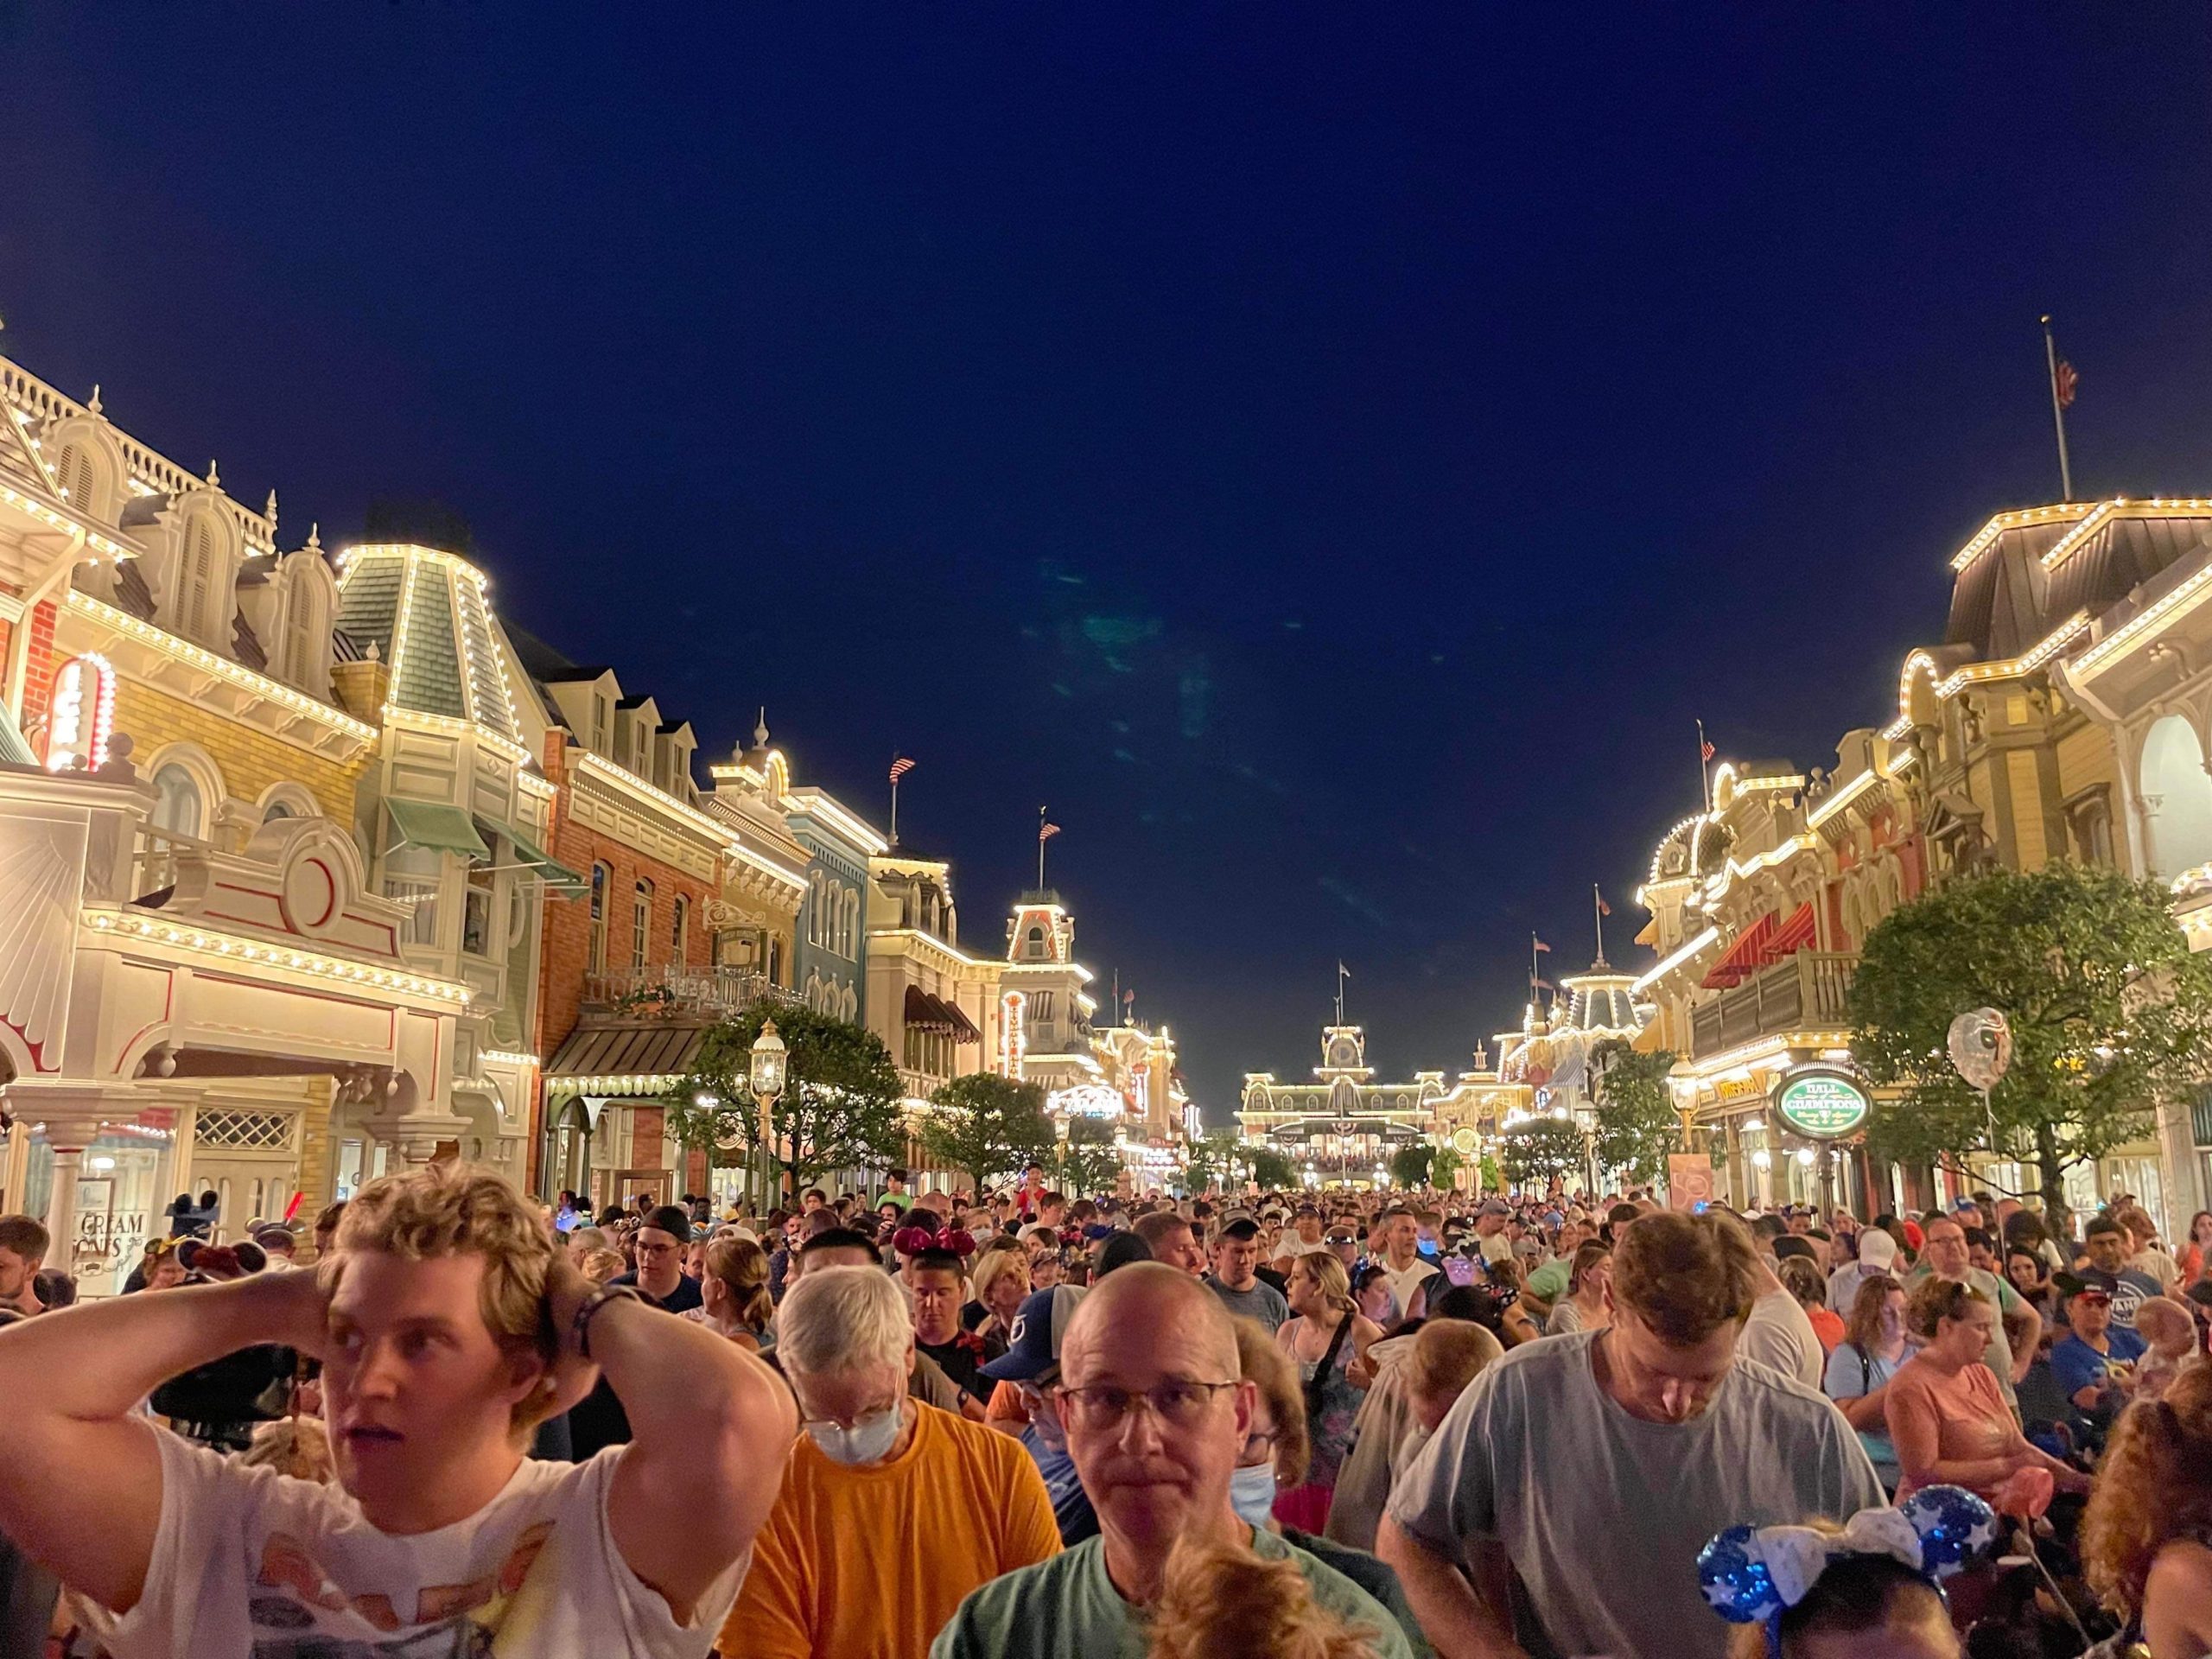
Crowds
While this information suggests a lack of July 4th crowds, we should also consider a different possibility.
Part of the difference could be that after 18 months of post-pandemic crowd management, Disney has gotten better at controlling the lines.
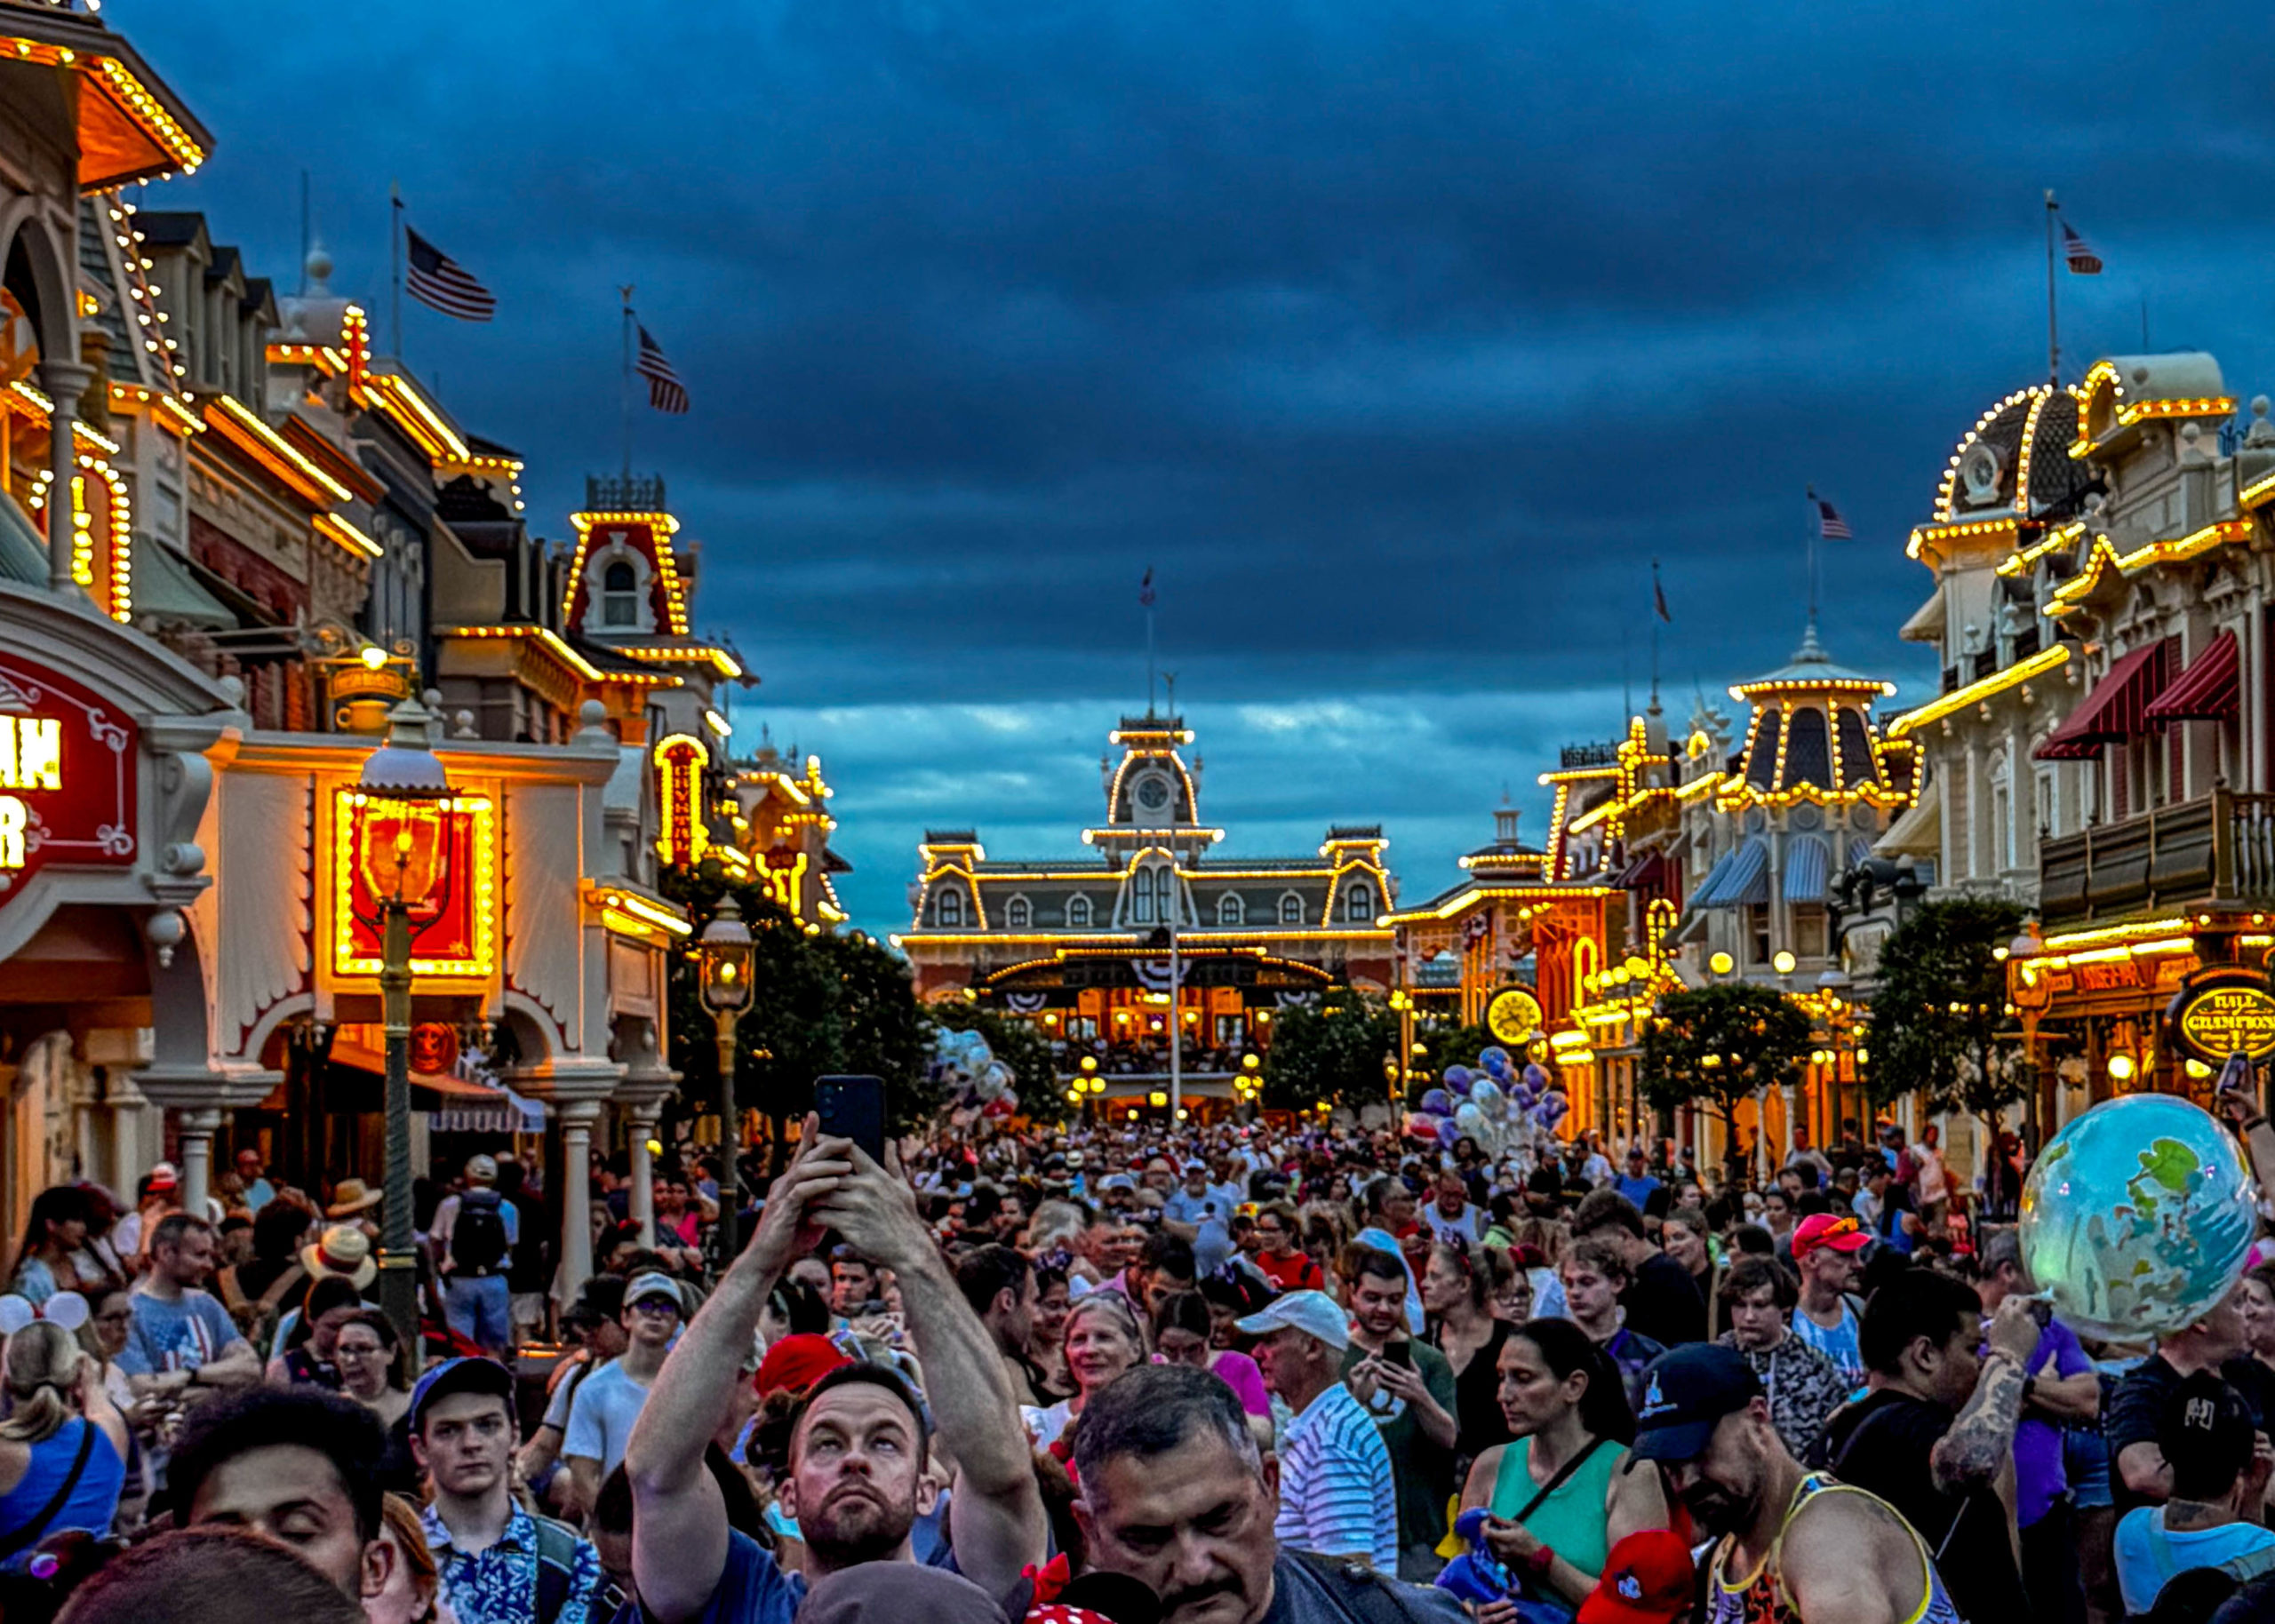
Crowds
I’m not saying that’s definitely the primary reason, but I suspect it’s at least a partial cause.
I feel this way because the past month of Disney World crowds have been as large as ever, but the wait times don’t reflect that fact.
![]()
Thanks for visiting MickeyBlog.com! Want to go to Disney? For a FREE quote on your next Disney vacation, please fill out the form below, and one of the agents from MickeyTravels, a Diamond Level Authorized Disney Vacation Planner, will be in touch soon!