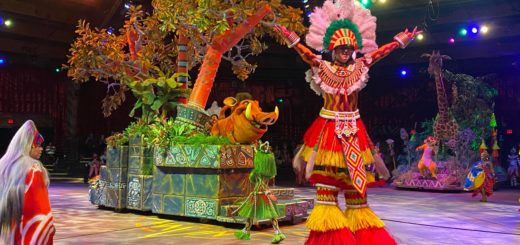
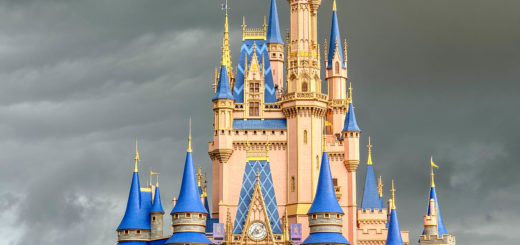
Disneyland Wait Times for January 2023
How were the holiday crowds at Disneyland this past month? Large.
Here are Disneyland’s wait times for the past 30 days.
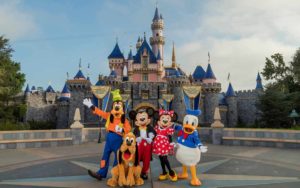
Photo: Travel and Leisure
Disneyland Resort
We are ready to review the crowd sizes at the Happiest Place on Earth during the 2022 holiday season.
Before we get started, you should know some things, though. As always, we’re examining the previous month.
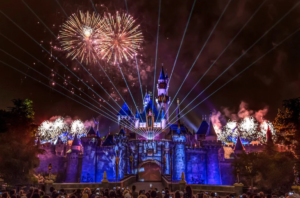
Photo: Disneyland
So, even though this article is called January 2023, the wait times are from December. And that month contains some of the busiest days on the annual calendar.
In fact, Disneyland Resort sold out its Disney Genie+ allotment on several consecutive days between Christmas and New Year’s Eve.
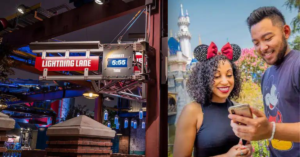
Photo: Disney
Like, that shouldn’t even be possible. It’s a digital product. The supply is theoretically infinite.
However, Disney sets a target number of potential sales for each date. If the park sells more than that, Disney Genie+ will lose its value.

Photo: Disney
You don’t need to know anything about park attendance to know that the place must be mobbed for that to happen.
Still, we’re evaluating the entire month, and the first half of December is usually pretty slow. Will that be enough to offset a wild end of 2022? Let’s check!
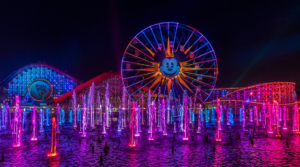
Photo: DIsneyland
Average Waits at Disneyland Park
Here are the average waits at Disneyland Park for the past 30 days:
- Star Wars: Rise of the Resistance – 90 minutes, up 10
- Millennium Falcon: Smugglers Run – 87 minutes, up 38
- Space Mountain – 81 minutes, up 24
- Indiana Jones Adventure – 77 minutes, up 24
- Matterhorn Bobsleds – 76 minutes, up 28
- Haunted Mansion Holiday – 68 minutes, up 14
- Star Tours – The Adventures Continue – 60 minutes, up 33
- It’s a Small World Holiday – 57 minutes, up 21
- Big Thunder Mountain Railroad – 56 minutes, up 14
- Peter Pan’s Flight – 51 minutes, up 13
- Buzz Lightyear Astro Blasters – 45 minutes, up 12
- Pirates of the Caribbean – 44 minutes, up 15
- Finding Nemo Submarine Voyage – 42 minutes, up 14
- Jungle Cruise – 38 minutes, up 6
- Alice in Wonderland – 35 minutes, up 8
- Dumbo the Flying Elephant – 34 minutes, up 3
- Toad’s Wild Ride – 33 minutes, up 10
- Autopia – 32 minutes, up 5
- Snow White’s Enchanted Wish – 31 minutes, up 9
- Astro Orbiter – 30 minutes, up 1
- Splash Mountain – 28 minutes, down 2
- Pinocchio’s Daring Journey – 27 minutes, up 9
- Casey Jr. Circus Train – 23 minutes, up 8
- The Many Adventures of Winnie the Pooh – 21 minutes, up 4
- Disneyland Railroad – 20 minutes, up 11
- Storybook Land Canal Boats – 19 minutes, down 1
- King Arthur Carrousel – 17 minutes, up 6
- Mad Tea Party – 16 minutes, no change
- Disneyland Monorail – 7 minutes, down 2
- Davy Crockett’s Explorer Canoes – 6 minutes, down 4
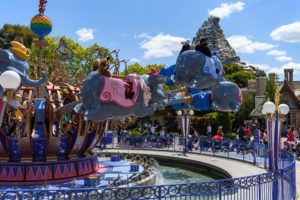
(Richard Harbaugh/Disneyland Resort)
Overall, guests waited for an average of 45 minutes per attraction. That’s 15 minutes or 50 percent more than in November.
So, yeah. The parks have been pretty mobbed in December. Remember that the tail end of December is that much worse, too.

Photo: Disneyland
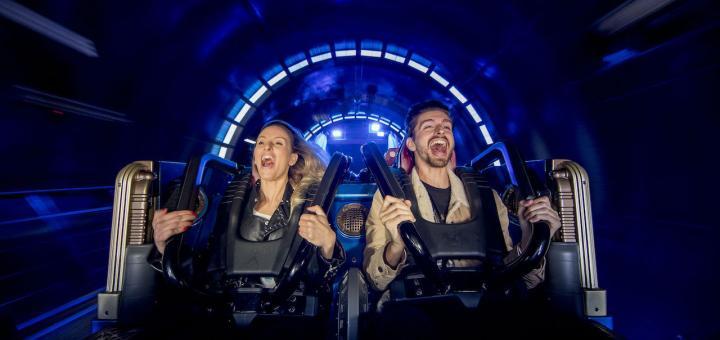
You would not believe some of the wait times MickeyBlog tracked over the past 10 days.
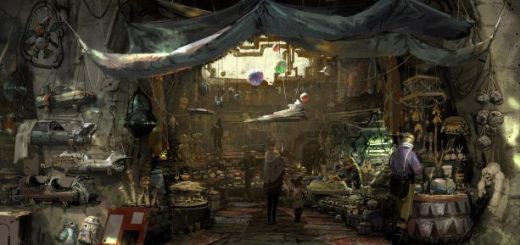
Disney California Adventure
Much of what I said about Disneyland Park applies to Disney California Adventure (DCA) as well.
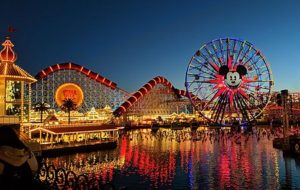
Photo: CrispyCream27
In recent years, the attendance gap between the two parks has shrunk. The arrival of Avengers Campus has dramatically enhanced the appeal of DCA.
While an older attraction remains the top draw virtually every day, the various shows and character greetings at Avengers Campus put it over the top overall.
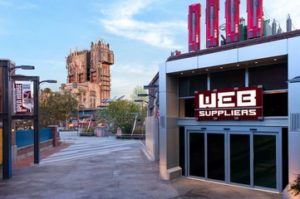
Photo: Disney
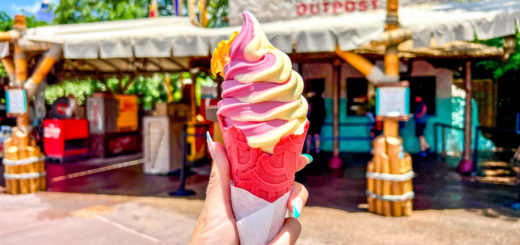
Last month, we mentioned the holiday overlays at DCA. In December, Mater’s Jingle Jamboree averaged a 29-minute wait, seven minutes more than last time.
Meanwhile, Luigi’s Joy to the Whirl came with a wait of 38 minutes, an increase of five minutes.
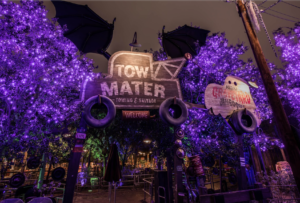
Photo: Extra Magic Minutes
So, while there was more demand for the holiday overlays, it wasn’t by a ridiculous amount. It’s more in the 15-33 percent range.
Average Waits at Disney California Adventure
Here are the other average wait times at the park for December 2022:
- Radiator Springs Racers – 93 minutes, up 3
- WEBSLINGERS: A Spider-Man Adventure – 86 minutes, up 23
- Toy Story Midway Mania! – 80 minutes, up 19
- Guardians of the Galaxy – Mission: BREAKOUT! – 80 minutes, up 26
- Goofy’s Sky School – 72 minutes, up 30
- Soarin’ Around the World – 70 minutes, up 15
- Monsters, Inc. Mike & Sulley to the Rescue! – 65 minutes, up 20
- The Incredicoaster – 61 minutes, up 23
- Pixar Pal-A-Round – 54 minutes, up 27
- Inside Out Emotional Whirlwind – 30 minutes, up 12
- The Little Mermaid ~ Ariel’s Undersea Adventure – 27 minutes, up 12
- Silly Symphony Swings – 25 minutes, up 15
- Grizzly River Run – 21 minutes, up 2
- Golden Zephyr – 20 minutes, up 12
- Jumpin’ Jellyfish – 18 minutes, up 6
- Jessie’s Critter Carousel – 5 minutes, no change
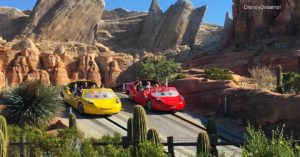
Photo: DisneyDreamer.com
Overall, guests at Disney California Adventured waited for an average of 47 minutes per attraction. That’s 17 minutes more than last time.
Just as interestingly, DCA had a longer average wait than Disneyland Park in December. That’s not super-rare, but we don’t tend to see it during the holidays.
Thanks for visiting MickeyBlog.com! Want to go to Disney? For a FREE quote on your next Disney vacation, please fill out the form below and one of the agents from MickeyTravels, a Platinum level Authorized Disney Vacation Planner, will be in touch soon!
Feature Photo: Disney