Disneyland Wait Times for November 2022
The offseason has ended at the Happiest Place on Earth.
During September, fewer guests travel due to the start of the school year and other factors. Then, as we enter October, people turn into tourists again.

Photo: Disneyland
So, let’s look at the wait times for last month to determine what typical Halloween crowds are like at Disneyland in 2022.
Disneyland Resort
As usual, we’re calling this article the November update, but its wait times cover the month of October.
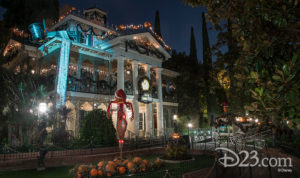
Photo: D23
At Disneyland, this time of the year means Halloween. But, more importantly, it involves the ascension of Haunted Mansion Holiday.
That’s the ride that people wait nine months out of the year to experience. We got a glimpse of its crowds in the previous article.
Now, we’ll normalize the data with a full sample size. That’s nerd talk for evaluating the crowds at the Haunted Mansion overlay for an entire month.
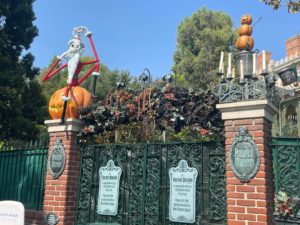
The other Halloween x-factor is Oogie Boogie Bash, which causes the park to close early for most guests.
Since crowds diminish in size later in the day, these after-hours events have the odd ripple effect of increasing overall wait times.
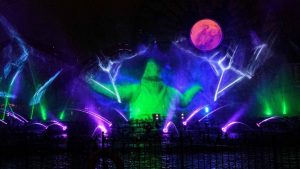
Photo: Disneyland
Average Waits at Disneyland Park
Keeping all this in mind, we can now look at October’s wait times.
- Star Wars: Rise of the Resistance – 75 minutes, up 17
- Haunted Mansion Holiday – 62 minutes, up 9
- Space Mountain – 53 minutes, up 6
- Indiana Jones Adventure – 50 minutes, up 4
- Millennium Falcon: Smugglers Run – 47 minutes, up 4
- Splash Mountain – 43 minutes, down 19
- Matterhorn Bobsleds – 42 minutes, n/a
- Big Thunder Mountain Railroad – 41 minutes, up 2
- Peter Pan’s Flight – 38 minutes, up 3
- Alice in Wonderland – 34 minutes, up 2
- Pirates of the Caribbean – 31 minutes, no change
- Jungle Cruise – 30 minutes, down 4
- Dumbo the Flying Elephant – 29 minutes, up 1
- Finding Nemo Submarine Voyage – 29 minutes, down 8
- Buzz Lightyear Astro Blasters – 28 minutes, down 2
- Autopia – 24 minutes, down 5
- Astro Orbiter – 22 minutes, down 4
- Toad’s Wild Ride – 21 minutes, up 3
- Snow White’s Enchanted Wish – 20 minutes, up 1
- Star Tours – The Adventures Continue – 19 minutes, down 4
- It’s a Small World – 18 minutes, up 6
- Storybook Land Canal Boats – 18 minutes, down 2
- Pinocchio’s Daring Journey – 17 minutes, up 2
- The Many Adventures of Winnie the Pooh – 14 minutes, down 2
- Mad Tea Party – 11 minutes, up 3
- Davy Crockett’s Explorer Canoes – 10 minutes, no change
- Disneyland Railroad – 10 minutes, up 3
- Casey Jr. Circus Train – 9 minutes, down 4
- King Arthur Carrousel – 8 minutes, up 3
- Disneyland Monorail – 5 minutes, no change

Photo: Disney
Overall, guests waited an average of 28 minutes last month, only one minute more than during September.
This number would have been higher if not for the cold weather spells. They cratered the wait time at Splash Mountain.
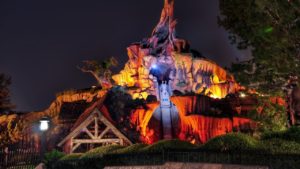
Photo: Disney/Skyvador on YouTube
Disney California Adventure
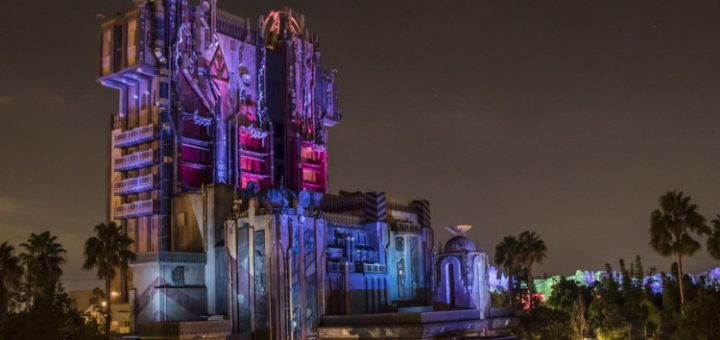
As a reminder, Disneyland Park isn’t the only place with popular holiday overlays. You’ll find three of them at Disney California Adventure as well.
For this reason, Guardians of the Galaxy: Monsters After Dark, Luigi’s Honkin’ Haul-O-Ween, and Mater’s Graveyard Jam-Boo-ree all claim larger crowds.
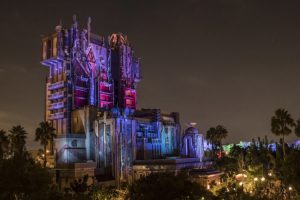
Photo: Disneyland
Overall, DCA is spinning its wheels a bit, though. Avengers Campus has driven attendance to its attractions, but the park crowds have remained static.
Still, at Monsters After Dark, guests waited an average of 100 minutes, which is up 20 minutes from September.
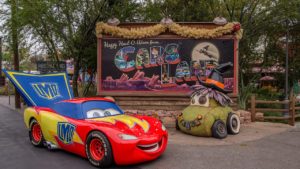
Photo: Disneyland
Meanwhile, Luigi’s Honkin’ Haul-O-Ween averaged 30 minutes, five minutes more than last time.
Finally, Mater’s Graveyard Jam-Boo-ree massively increased to 25 minutes, which is eight minutes or nearly 50 percent.
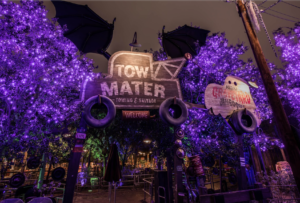
Photo: Extra Magic Minutes
As you can see, DCA packs in the guests for its holiday overlays. Frankly, Disney should add more since they all do so well.
Let’s be honest that the Luigi and Mater rides are on the lower end of Disney attractions in terms of quality.
Image: Disney
If they’re increasing by this much, Disney’s missing out by not adding more overlays.
Average Waits at Disney California Adventure
Here are the wait times at DCA for the past month:
- Radiators Springs Racers – 105 minutes, up 27
- Soarin’ Around the World – 65 minutes, up 23
- WEBSLINGERS: A Spider-Man Adventure – 60 minutes, up 19
- Toy Story Midway Mania! – 59 minutes, up 8
- Monsters, Inc. Mike & Sulley to the Rescue – 43 minutes, up 8
- The Incredicoaster – 39 minutes, up 10
- Goofy’s Sky School – 38 minutes, up 9
- Pixar Pal-A-Round – 28 minutes, up 9
- Grizzly River Run – 27 minutes, down 12
- Inside Out Emotional Whirlwind – 20 minutes, up 4
- The Little Mermaid – Ariel’s Undersea Adventure – 18 minutes, down 2
- Jumpin’ Jellyfish – 9 minutes, up 3
- Silly Symphony Swings – 8 minutes, up 1
- Golden Zephyr – 7 minutes, down 3
- Jessie’s Critter Carousel – 5 minutes, no change

Photo: Disney
Overall, guests waited an average of 32 minutes in October, an increase of six minutes from September.
Seriously, Disney, we’ve got empirical evidence that ride overlays work. GIVE US MORE!!!