
Walt Disney World Wait Times for Second Week of February 2023

Anecdotally, Walt Disney World fans noticed something over the past few days.
For whatever reason, the parks didn’t seem as crowded. Notably, Disney executives stated otherwise. They indicated that park attendance looks strong throughout 2023.

However, Disney has increased revenue while keeping attendance below pre-pandemic levels. We’re tracking this trend throughout the year to check Disney’s math.
Here are the Walt Disney World wait times for the second week of February 2023.
Disney’s Animal Kingdom

The Tree of Life
Again, everything I discuss with friends is anecdotal rather than based on data.
However, friends were telling me the other day that Pandora – The World of Avatar was the emptiest they ever saw it.

Photo: Disney
While you can tell that they weren’t visiting Disney World during the earliest days of the pandemic, when Avatar Flight of Passage was walk-on, I still found that interesting.
Last week’s data suggests that they’re wrong, at least with the biggest ride here.

Flight of Passage
Guests waited for 117 minutes for Avatar Flight of Passage. That’s a sizable increase of 24 minutes from last time. I guess people really do brace for the worst on this ride.
Anywhere, here are the other average waits at Animal Kingdom:

Photo: Disney
- Na’vi River Journey – 70 minutes
- Kilimanjaro Safaris – 46 minutes, up 8
- Adventurers Outpost – 42 minutes, no change
- Expedition Everest – 36 minutes, up 8
- DINOSAUR – 25 minutes, up 2
- TriceraTop Spin – 11 minutes, no change
- It’s Tough to Be a Bug! – 10 minutes, no change

Photo: Disney
Overall, guests waited 44 minutes per attraction at Animal Kingdom. That’s six minutes longer than last time and also on the high side for this park.
The moral of the story: never trust your friends about anything!
Disney’s Hollywood Studios
Photo credit: DisneyWorldVacationGuide.com
Last week, Hollywood Studios continued a trend that I discussed last week.
The park added several character greetings, some of which appeared on My Disney Experience. Over the past few days, Disney has added even more of them!
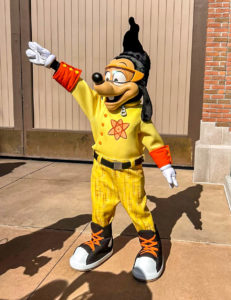
Max at Hollywood Studios
Did the new character offerings draw attention away from the lines this week? Here are the attraction averages:
- Slinky Dog Dash – 99 minutes, up 11
- Star Wars: Rise of the Resistance – 97 minutes, down 2
- Twilight Zone Tower of Terror – 95 minutes, down 3
- Rock ‘n’ Roller Coaster Starring Aerosmith – 80 minutes, up 16
- Mickey & Minnie’s Runaway Railway – 68 minutes, up 1
- Toy Story Mania! – 63 minutes, no change
- Millennium Falcon: Smugglers Run – 61 minutes, up 2
- Alien Swirling Saucers – 41 minutes, up 2
- Red Carpet Dreams – 41 minutes, no change
- Meet Sulley at Walt Disney Presents – 32 minutes, up 2
- Star Tours – The Adventures Continue! – 28 minutes, no change
- Celebrity Spotlight – 22 minutes, down 2
- Lightning McQueen’s Racing Academy – 15 minutes, no change
- Muppet*Vision 3D – 10 minutes, no change

Image Credit: Kent Phillips, photographer
Overall, guests waited an average of 50 minutes last week. That’s four minutes more than the previous week for each Hollywood Studios attraction.
In other words, the anecdotes appear dead wrong, and my friends should consider themselves quite lucky if they waited less than this.
EPCOT

Photo: Disney
We’re definitely trending upward, and EPCOT’s the park hosting a festival right now. So, I have concerns.
Here are EPCOT’s wait times for the past week:
- Frozen Ever After – 74 minutes, up 2
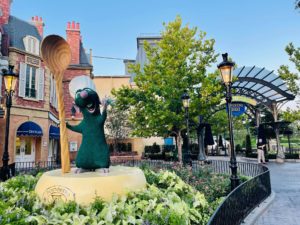
- Remy’s Ratatouille Adventure – 71 minutes, down 1
- Test Track – 63 minutes, up 6
- Soarin’ Around the World – 42 minutes, no change
- Royal Sommerhus – 35 minutes, no change
- Mission: SPACE – 19 minutes, up 1
- Living with the Land – 17 minutes, up 3
- Spaceship Earth – 16 minutes, up 3
- Turtle Talk with Crush – 15 minutes, no change
- Journey into Imagination with Figment – 12 minutes, down 5
- The Seas with Nemo & Friends – 11 minutes, no change
- Gran Fiesta Tour Starring the Three Caballeros – 10 minutes, no change
Overall, guests waited a modest 32 minutes per EPCOT attraction. That’s one minute more than last week. So, at least EPCOT was static.
Magic Kingdom

Photo: TripAdvisor
We’ve got one park left. Was Magic Kingdom closer to EPCOT or Animal Kingdom with its wait times this week? Let’s find out!
Here are the average Magic Kingdom attraction waits for last week:
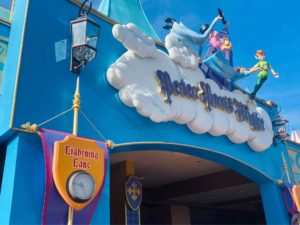
Peter Pan’s Flight
- Seven Dwarfs Mine Train – 79 minutes, down 1
- Peter Pan’s Flight – 67 minutes, down 5
- Jungle Cruise – 55 minutes, down 1
- Space Mountain – 54 minutes, up 4
- Big Thunder Mountain Railroad – 45 minutes, up 5
- Haunted Mansion – 44 minutes, up 1
- Ariel’s Grotto – 42 minutes, no change
- Buzz Lightyear’s Space Ranger Spin – 37 minutes, down 2
- The Many Adventures of Winnie the Pooh – 36 minutes, up 1
- Princess Fairytale Hall – 34 minutes, up 3
- Pirates of the Caribbean – 32 minutes, down 2
- Town Square Theater – 30 minutes, no change
- Pete’s Silly Sideshow – 28 minutes, down 4
- Astro Orbiter – 29 minutes, no change
- It’s a Small World – 27 minutes, no change
- Under the Sea ~ Journey of the Little Mermaid – 24 minutes, down 2
- The Barnstormer – 23 minutes, no change
- The Magic Carpets of Aladdin – 21 minutes, down 2
- Dumbo the Flying Elephant – 19 minutes, down 4
- Tomorrowland Speedway – 17 minutes, down 4
- Mad Tea Party – 12 minutes, down 1
- Monsters, Inc. Laugh Floor – 10 minutes, down 5
- Tomorrowland Transit Authority PeopleMover – 10 minutes, down 1
- Prince Charming Regal Carrousel – 9 minutes, down 1
- Country Bear Jamboree – 5 minutes, no change
- Walt Disney’s Carousel of Progress – 5 minutes, no change

Image Credit: Disney
Overall, guests waited an average of 29 minutes for Magic Kingdom attractions. That’s two minutes less than last time.
More importantly, Magic Kingdom required the shortest average wait of any park at Walt Disney World last week, which is always terrific when it happens.

Photo: MickeyBlog
Thanks for visiting MickeyBlog.com! Want to go to Disney? For a FREE quote on your next Disney vacation, please fill out the form below and one of the agents from MickeyTravels, a Diamond level Authorized Disney Vacation Planner, will be in touch soon!
Feature Photo: Disney


Thank you for sharing this data. I didn’t see the date range this covers. Are you comparing 2/12-18 with 2/5-11? It would really be nice if you created a graph showing total park attendance over the past 12 weeks. Make it a rolling graph by updating it every week. I trust your data more than any other source.