Walt Disney World Wait Times for Last Week of January 2023
Ordinarily, Walt Disney World crowds diminish toward the end of January.
The cold weather doesn’t entice guests to visit Florida as much as you might expect.

Festival of the Arts
In 2023, we’ve got two factors that could change that. The first is the EPCOT International Festival of the Arts, which we’ve shown does increase crowds.
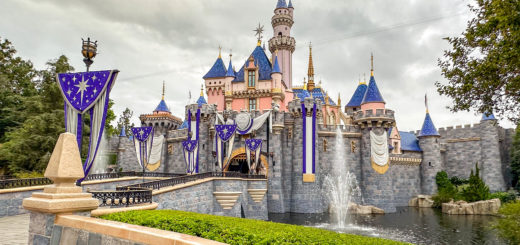
As of this past week, we’ve got a second factor that’s a complete wild card. The Disney100 event kicked off on Friday, January 27th.
Photo: Disney
Did that impact Walt Disney World wait times? Let’s find out!
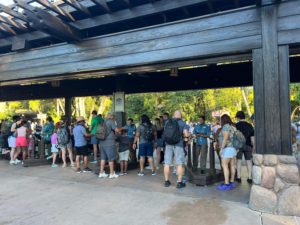
Disney’s Animal Kingdom
Realistically, only half the week involved the Disney100 event. Also, Disney has positioned Disneyland as the park of choice for this celebration.
Disneyland Disney 100 Celebration
Sure, Walt Disney World guests can find exclusive food, drinks, and merchandise for the event…and MickeyBlog readers know it’s wonderful!
Still, the fanciest decorations went live at the Happiest Place on Earth the other day. So, I honestly don’t expect a gigantic bump in Orlando.
Photo: Theme Park Tourist via Wikipedia
Am I wrong? Well, Avatar Flight of Passage increased to a 106-minute last week, which is ten minutes more than last time.
Meanwhile, Na’vi River Journey also went up a bit. It had a five-minute bump to 75 minutes.

Photo: TouringPlans.com
Did the other Animal Kingdom attractions trend upward? Let’s check:
- Kilimanjaro Safaris – 51 minutes, up 6
- Adventurers Outpost – 45 minutes, up 5
- Expedition Everest – 33 minutes, up 3
- DINOSUAR – 27 minutes, up 9
- TriceraTop Spin – 14 minutes, up 2
- It’s Tough to Be a Bug! – 10 minutes, no change

Photo: Disney
Guests waited an average of 45 minutes for Animal Kingdom attractions last week, which is five minutes more than last time.
I’m genuinely curious about how Disney100 impacts the parks. So, I’ll throw in a different comparison this week.
Animal Kingdom Lines
Animal Kingdom wait times are up dramatically from the last week of January in 2022, when the average wait was 33 minutes.
Of course, we’re also past the pandemic now, which is a factor. Guests were still wearing masks at this time last year, and Florida had just experienced an outbreak.

Photo: WHO
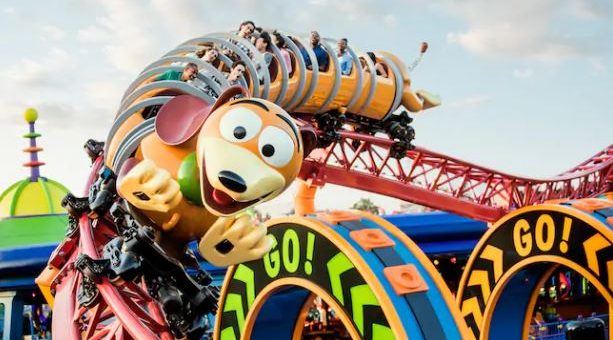
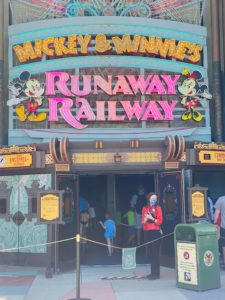
Disney’s Hollywood Studios
Still, the early results hint at bigger crowds in 2023. Was that true at Disney’s most hectic park, Hollywood Studios?
Here are the average waits:
- Twilight Zone Tower of Terror – 107 minutes, up 7
- Star Wars: Rise of the Resistance – 102 minutes, up 9
- Slinky Dog Dash – 96 minutes, up 6
- Mickey & Minnie’s Runaway Railway – 70 minutes, up 7
- Rock ‘n’ Roller Coaster Starring Aerosmith – 68 minutes, up 8
- Toy Story Mania! – 67 minutes, up 2
- Millennium Falcon: Smugglers Run – 61 minutes, up 11
- Red Carpet Dreams – 45 minutes, up 3
- Alien Swirling Saucers – 42 minutes, up 7
- Meet Sulley at Walt Disney Presents – 35 minutes, up 5
- Celebrity Spotlight – 31 minutes, up 4
- Star Tours – The Adventures Continue – 30 minutes, up 8
- Lightning McQueen’s Racing Academy – 15 minutes, no change
- Muppet*Vision 3D – 10 minutes, no change
Overall, guests waited for an average of 51 minutes at Hollywood Studios. That’s an increase of five minutes from last week.
Also, Hollywood Studios’ waits have increased by eight minutes from the same time last year.

Photo: Matt Stroshane
The other trend I’m noticing is that every non-show attraction has increased from last week.
Thus far, Disney100 definitely appears to have drawn larger crowds.
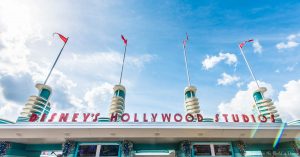
Photo credit: DisneyWorldVacationGuide.com
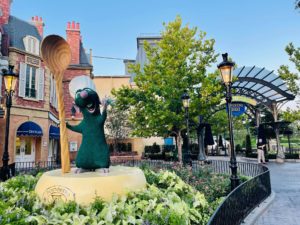
EPCOT
Did the trend continue at EPCOT? Let’s check. Here are the park’s average waits:
- Frozen Ever After – 79 minutes, up 9
- Remy’s Ratatouille Adventure – 75 minutes, down 3
- Test Track – 58 minutes, up 1
- Soarin’ Around the World – 44 minutes, up 3
- Royal Sommerhus – 36 minutes, up 1
- Mission: SPACE – 21 minutes, up 1
- Spaceship Earth – 18 minutes, up 4
- Turtle Talk with Crush – 17 minutes, up 1
- Living with the Land – 15 minutes, up 5
- Journey into Imagination with Figment – 13 minutes, up 2
- The Seas with Nemo & Friends – 12 minutes, up 3
- Gran Fiesta Tour Starring the Three Caballeros – 10 minutes, up 2
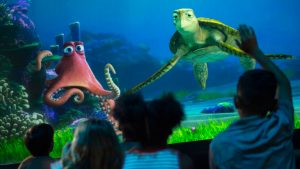
Photo: Disney
You can tell by the data how consistent EPCOT’s attractions were last week. Everything was up ever so slightly except for Ratatouille.
The average attraction’s wait time was 32 minutes, which is two minutes more than last time. That’s also three minutes more than the same week in 2022.
As such, EPCOT has experienced the smallest surge of the parks thus far.
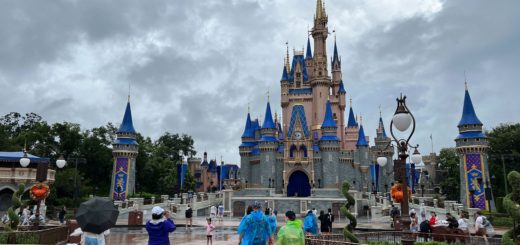
Magic Kingdom
Okay, I think we know the deal by now. Disney100 is clearly a draw, at least during its early days.
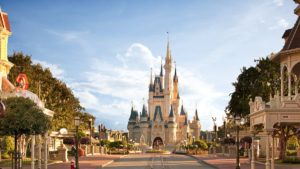
Photo: TripAdvisor
What did the event do to Magic Kingdom’s crowds? Here are the average waits (minus Splash Mountain, which is no longer a part of our calculations):
- Seven Dwarfs Mine Train – 86 minutes, up 1
- Peter Pan’s Flight – 74 minutes, up 4
- Jungle Cruise – 60 minutes, up 4
- Space Mountain – 54 minutes, up 4
- Big Thunder Mountain Railroad – 50 minutes, down 8
- Haunted Mansion – 49 minutes, no change
- Ariel’s Grotto – 46 minutes, up 11
- Buzz Lightyear’s Space Ranger Spin – 41 minutes, up 3
- Town Square Theater – 40 minutes, up 4
- Pirates of the Caribbean – 39 minutes, up 7
- The Many Adventures of Winnie the Pooh – 38 minutes, up 6
- Princess Fairytale Hall – 34 minutes, up 3
- Astro Orbiter – 33 minutes, no change
- Pete’s Silly Sideshow – 32 minutes, down 2
- It’s a Small World – 31 minutes, up 5
- Magic Carpets of Aladdin – 30 minutes, up 6
- The Barnstormer – 28 minutes, up 5
- Under the Sea ~ Journey of the Little Mermaid – 27 minutes, up 5
- Dumbo the Flying Elephant – 26 minutes, up 6
- Tomorrowland Speedway – 23 minutes, up 3
- Mickey’s PhilharMagic – 17 minutes, up 1
- Mad Tea Party – 15 minutes, no change
- Tomorrowland Transit Authority PeopleMover – 15 minutes, no change
- Monsters, Inc. Laugh Floor – 14 minutes, no change
- Prince Charming Regal Carrousel – 13 minutes, up 1
- Country Bear Jamboree – 5 minutes, no change
- Walt Disney’s Carousel of Progress – 5 minutes, no change

Photo: DIsney
Overall, guests waited 35 minutes per attraction at Magic Kingdom. That’s three minutes more than last time, but four minutes less than last time.
Looking at the data, crowds increased some, and I would credit that to Disney100. We’ll keep tracking this phenomenon for the next few weeks.
Thanks for visiting MickeyBlog.com! Want to go to Disney? For a FREE quote on your next Disney vacation, please fill out the form below and one of the agents from MickeyTravels, a Diamond level Authorized Disney Vacation Planner, will be in touch soon!
Feature Photo: Disney