
Walt Disney World Wait Times for Last Week of 2022
All year long, I warn you that the time between December 20th and January 2nd is the busiest time at Disney theme parks.
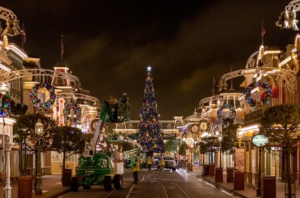
Photo: Disney
Today, I come bearing receipts. This ain’t gonna be pretty.Here are the Walt Disney World wait time averages for the final week of 2022!
Disney’s Animal Kingdom
Let’s start with an anecdote regarding a different Disney theme park.
Photo:visitorlando.com
Some folks reported on January 2nd, 2023, that multiple Walt Disney World rides posted wait times north of 300 minutes.
You may wonder what that has to do with the final week of 2022. Well, things get a bit murky when discussing the holidays at Disney.

(Matt Stroshane, photographer)
The official New Year’s Day holiday this year is January 2nd, which means people had a uniquely long amount of time and opportunities to get to the parks.
Today’s wait times reflect everything through January 1st, the Sunday of last week. And yes, everything was mobbed.
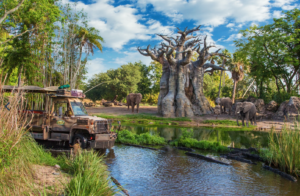
Photo: Disney
Here are the average wait times at Animal Kingdom:
- Avatar Flight of Passage — 194 minutes, up 46
- Na’vi River Journey – 112 minutes, up 42
- Kilimanjaro Safaris – 90 minutes, up 48
- Expedition Everest – 64 minutes, up 22
- Adventurers Outpost – 60 minutes, up 15
- DINOSAUR – 55 minutes, up 20
- Kali River Rapids – 30 minutes, up 25
- TriceraTop Spin – 23 minutes, up 8
- It’s Tough to Be a Bug! – 15 minutes, up 3

Photo: DisneyOverall, guests waited for an average of 71 minutes for Animal Kingdom attractions. That’s 22 minutes more than last time.
Also, I’d like to highlight a couple of curiosities. For starters, the temperature in Orlando at the start of last week remained frosty.

Photo: Disney
Somehow, this didn’t deter anyone from riding Kali River Rapids.
Meanwhile, anyone who wanted to experience the two attractions at Pandora – The World of Avatar stood in line for about five hours on average.
There’s a wow factor to that piece of information. It’s like a loyalty test about how much you love Pandora!

Photo: touring plans.com
PS: These two rides also garnered extra attention since Avatar: The Way of Water continues to dominate the movie world right now.
So, these traffic spikes aren’t solely because of holiday traffic.
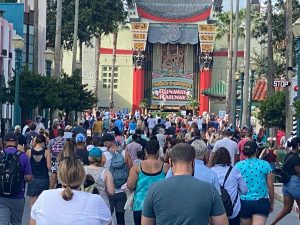
Disney’s Hollywood Studios
Photo: Disney
This isn’t going to be pretty, folks. Even during the slow season, Hollywood Studios remains packed.
According to some recent data, this park hosts three of the top ten attractions in the world in terms of average waits.

You can imagine how crowded the place was during the past week.
Here are the average wait times:
- Star Wars: Rise of the Resistance – 145 minutes, no change
- Twilight Zone Tower of Terror – 140 minutes, up 17
- Slinky Dog Dash – 125 minutes, up 15
- Rock ‘n’ Roller Coaster Starring Aerosmith – 106 minutes, up 35
- Millennium Falcon: Smugglers Run – 100 minutes, down 39
- Toy Story Mania! – 96 minutes, up 6
- Mickey & Minnie’s Runaway Railway – 91 minutes, up 4
- Alien Swirling Saucers – 55 minutes, down 5
- Red Carpet Dreams – 53 minutes, up 4
- Star Tours – The Adventures Continue – 43 minutes, down 3
- Celebrity Spotlight – 41 minutes, down 6
- Meet Sulley at Walt Disney Presents – 36 minutes, down 4
- Lightning McQueen’s Racing Academy – 16 minutes, up 1
- Muppet*Vision 3D – 10 minutes, no change
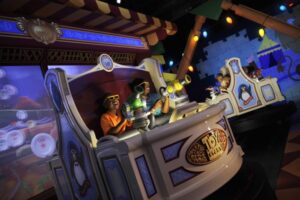
Photo: Disney
I realize this data doesn’t seem nightmarish or anything. However, you must remember the theoretical ceiling on wait times I’ve previously discussed.
The average Hollywood Studios attraction required a wait of 70 minutes! That’s just five minutes more than last time, but please focus on what it means!
I have a friend at Magic Kingdom as I type this, and he was just telling me he won’t wait for an hour to ride anything.
As an old-school Disney theme park guest, he just doesn’t believe it’s worth the aggravation.
That philosophy rules out a staggering number of Walt Disney World attractions these days!
Photo Credit: www.geek.com
He’d probably only consider everything from Star Tours down, which…wouldn’t be the greatest park visit.
That’s how crazy Disney gets during the holidays.
EPCOT
Photo: Orlando Date Night Guide
You’re getting the point, but you may hope that EPCOT, usually the slowest park, claims a better fate. Here are the average waits here:
- Remy’s Ratatouille Adventure – 131 minutes, up 31
- Test Track – 112 minutes, up 40
- Frozen Ever After – 110 minutes, up 27
- Soarin’ Around the World – 91 minutes, up 1
- Mission: SPACE – 77 minutes, up 19
- Spaceship Earth – 45 minutes, up 1
- Royal Sommerhus – 40 minutes, up 9
- The Seas with Nemo & Friends – 35 minutes, up 17
- Gran Fiesta Tour Starring the Three Caballeros – 25 minutes, up 20
- Journey into Imagination with Figment – 24 minutes, up 12
- Living with the Land – 23 minutes, up 6
- Turtle Talk with Crush – 20 minutes, up 5
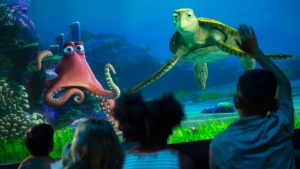
Photo: Disney
So, yes, every attraction at EPCOT suffered a longer wait last week.
Overall, guests stood in line for an average of 62 minutes, 13 minutes more than last time.
To a larger point, that’s three parks that have all averaged a per-attraction wait time of more than an hour. Yikes!
Magic Kingdom
Photo: Disney Parks
Did we go four for four?
Let’s find out! Here are the average wait times at Magic Kingdom last week:
- Seven Dwarfs Mine Train – 118 minutes, up 37
- Peter Pan’s Flight – 90 minutes, up 10
- Space Mountain – 85 minutes, up 18
- Jingle Cruise – 72 minutes, up 17
- Big Thunder Mountain Railroad – 65 minutes, up 21
- Haunted Mansion – 62 minutes, up 16
- Splash Mountain – 60 minutes, up 51 (!!!)
- Buzz Lightyear’s Space Ranger Spin – 55 minutes, up 10
- Pirates of the Caribbean – 48 minutes, up 22
- It’s a Small World – 45 minutes, up 10
- Town Square Theater – 44 minutes, down 3
- Princess Fairytale Hall – 42 minutes, up 2
- Astro Orbiter – 40 minutes, up 21
- The Many Adventures of Winnie the Pooh – 40 minutes, up 2
- Under the Sea ~ Journey of the Little Mermaid – 38 minutes, up 12
- The Barnstormer – 37 minutes, up 16
- Dumbo the Flying Elephant – 36 minutes, up 14
- Magic Carpets of Aladdin – 36 minutes, up 9
- Tomorrowland Speedway – 35 minutes, up 15
- Mad Tea Party – 22 minutes, up 6
- Monsters, Inc. Laugh Floor – 20 minutes, up 3
- Tomorrowland Transit Authority PeopleMover – 19 minutes, up 5
- Mickey’s PhilharMagic – 18 minutes, up 3
- Prince Charming Regal Carrousel – 17 minutes, up 11
- Walt Disney’s Carousel of Progress – 5 minutes, no change
- Country Bear Jamboree – 5 minutes, no change

Photo: Disney
The average wait at Magic Kingdom last week was 45 minutes, which is under an hour. So, that’s good.
However, that’s also 15 minutes more than last time, meaning guests waited 50 percent longer in line last week.
 Folks, visiting Walt Disney World during the holidays is joyous, but you’ll definitely experience fewer rides per visit!
Thanks for visiting MickeyBlog.com! Want to go to Disney? For a FREE quote on your next Disney vacation, please fill out the form below and one of the agents from MickeyTravels, a Diamond level Authorized Disney Vacation Planner, will be in touch soon!
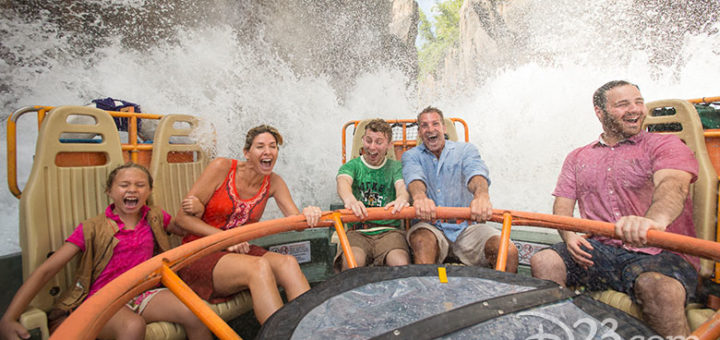
Photo: D23


I was there and can attest to these wait times. Some of them were even more than you posted…up to 300 for Tower of Terror, also. It was insane, but expected like you said at that time of year.