Walt Disney World Wait Times for Hurricane Ian Week 2022
Walt Disney World just experienced one of its strangest weeks ever, and I include the pandemic era in that.
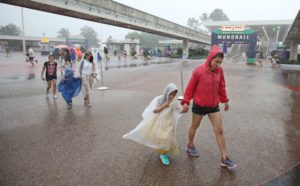
Tourists found themselves stuck in Central Florida during Hurricane Ian, which didn’t ruin vacations per se. It sure made the trips intense, though.


Image credit: Str/Xinhua/Zuma
Since Disney closed its theme parks for two days, and guests weren’t as prevalent on at least two others, this week’s wait times are probably weird.
Let’s find out just how weird in the latest Walt Disney World wait times are.

Disney’s Animal Kingdom
Okay, we can tell immediately that this week is a mess when Na’vi River Journey tops the charts.
The gorgeous boat ride averaged a wait of 56 minutes, a drop of six minutes from last week.
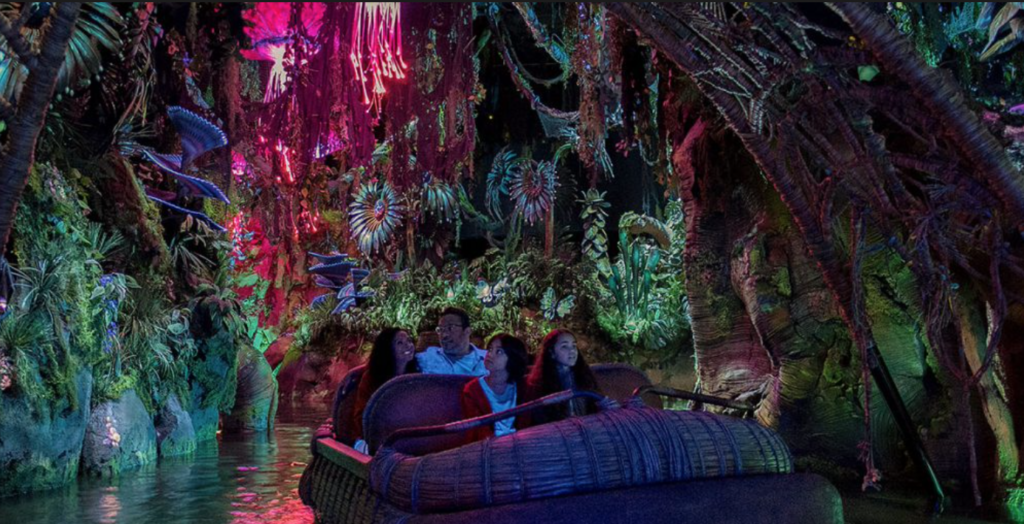

Photo: D23
Meanwhile, the other attraction at Pandora – The World of Avatar, Avatar Flight of Passage, dropped significantly.
Guests waited an average of 53 minutes, a drop of 15 minutes from last time. So, we’re trending down, which is how it should be.


Photo: Disney
Here are the other Animal Kingdom average waits:
- Kilimanjaro Safaris – 41 minutes, up 9
- Adventurers Outpost – 34 minutes, down 6
- Kali River Rapids – 25 minutes, down 3
- DINOSAUR – 17 minutes, no change
- Expedition Everest – 15 minutes, down 7
- It’s Tough to Be a Bug – 10 minutes, no change
- TriceraTop Spin – 5 minutes, down 1


Photo: Disney
Overall, the average wait for an Animal Kingdom attraction was 28 minutes, four minutes lower than last time.
I’ll add the caveat that Kilimanjaro Safaris didn’t reopen on Friday. So, we’re barely getting a half-week of data from it.
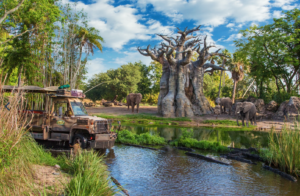

Photo: Disney
Disney’s Hollywood Studios
A friend of mine just told me that his party of 10 enjoyed a terrific Sunday at Hollywood Studios.
Whenever an infrequent Walt Disney World visitor goes to the park these days, I stress about whether they’ll have a great time.
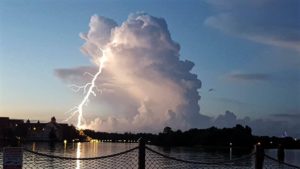

Photo Credit: Twitter/ Paul Dellegatto/ Weston Burroughs
In this case, the weather played in his favor, keeping many guests away from the parks.
For example, Star Wars: Rise of the Resistance averaged an 84-minute wait, which is 14 minutes less than usual.
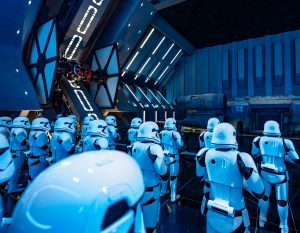

Image Credit: Disney
I also noticed it listed at 70 minutes consistently on Saturday and Sunday on the My Disney Experience app this week. So, if anything, I think the average is a bit high.
Here are the other attractions at Hollywood Studios:
- Slinky Dog Dash – 72 minutes, down 17
- Toy Story Mania! – 56 minutes, down 1
- Mickey & Minnie’s Runaway Railway – 55 minutes, down 4
- Millennium Falcon: Smugglers Run – 52 minutes, down 4
- Rock ‘n’ Roller Coaster Starring Aerosmith – 50 minutes, down 12
- Twilight Zone Tower of Terror – 47 minutes, down 11
- Red Carpet Dreams – 39 minutes, down 8
- Alien Swirling Saucers – 35 minutes, down 2
- Meat Sulley at Walt Disney Presents – 31 minutes, down 4
- Celebrity Spotlight – 25 minutes, down 1
- Lightning McQueen’s Racing Academy – 10 minutes, down 3
- Star Tours – The Adventures Continue! – 10 minutes, down 2
- Muppet*Vision 3D – 10 minutes, no change
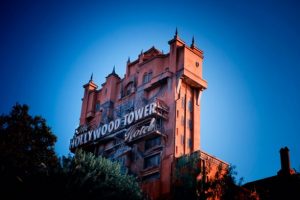

Photo: Disney
Overall, guests waited for an average of 38 minutes for Hollywood Studios attractions. That’s one of the lowest numbers in a while.
I fully understand why guests were so happy at Walt Disney World lately…at least when there wasn’t a hurricane in the area.
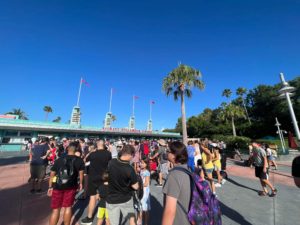
EPCOT
We’ve got a change at the top this week at EPCOT. Remy’s Ratatouille Adventure has returned as the attraction with the longest wait.
Guests waited for an average of 55 minutes at the France pavilion, a three-minute decline week-over-week.


Photo: Disney
Frozen Ever After was right behind Ratatouille. However, it only averaged a 53-minute wait, a significant drop of 14 minutes from last time.
Here are all the other attractions at EPCOT:
- Test Track – 48 minutes, down 4
- Soarin’ Around the World – 30 minutes, down 2
- Royal Sommerhus – 19 minutes, down 5
- Turtle Talk with Crush – 10 minutes, no change
- Mission: SPACE – 9 minutes, down 6
- Spaceship Earth – 8 minutes, down 4
- Living with the Land – 6 minutes, down 10
- Journey into Imagination with Figment – 5 minutes, down 6
- Gran Fiesta Tour Starring the Three Caballeros – 5 minutes, down 2
- The Seas with Nemo & Friend – 5 minutes, down 1


Photo: Disney
Overall, guests waited 19 minutes per ride at EPCOT, which is four minutes less than last time.
More importantly, only four (!) EPCOT attractions came with waits of more than 20 minutes, a staggering total.
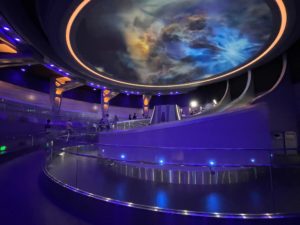

As a reminder, Guardians of the Galaxy: Cosmic Rewind still doesn’t count for any of this. To my surprise, Disney didn’t add a standby queue yet.
Now that October has arrived, park officials may wait until late in the year or possibly even early 2023.


Photo: Disney
Magic Kingdom
Here are the average waits at Magic Kingdom:
- Seven Dwarfs Mine Train – 57 minutes, down 6
- Peter Pan’s Flight – 51 minutes, down 10
- Jungle Cruise – 45 minutes, down 6
- Haunted Mansion – 38 minutes, down 4
- Splash Mountain – 36 minutes, down 5
- Town Square Theater – 33 minutes, down 16
- Buzz Lightyear’s Space Ranger Spin – 31 minutes, no change
- Big Thunder Mountain Railroad – 30 minutes, down 1
- Princess Fairytale Hall – 30 minutes, down 8
- Space Mountain – 29 minutes, down 5
- Pirates of the Caribbean – 28 minutes, up 2
- The Many Adventures of Winnie the Pooh – 26 minutes, down 1
- Astro Orbiter – 25 minutes, no change
- Under the Sea ~ Journey of the Little Mermaid – 17 minutes, down 1
- It’s a Small World – 16 minutes, down 1
- The Magic Carpets of Aladdin – 12 minutes, down 2
- Dumbo the Flying Elephant – 11 minutes, up 3
- Tomorrowland Transit Authority PeopleMover – 10 minutes, up 2
- Monsters, Inc. Laugh Floor – 9 minutes, down 1
- The Barnstormer – 8 minutes, down 2
- Mad Tea Party – 7 minutes, no change
- Mickey’s PhilharMagic – 7 minutes, down 2
- Tomorrowland Speedway – 6 minutes, down 7
- Country Bear Jamboree – 5 minutes, no change
- Prince Charming Carrousel – 5 minutes, down 2
- Walt Disney’s Carousel of Progress – 5 minutes, no change
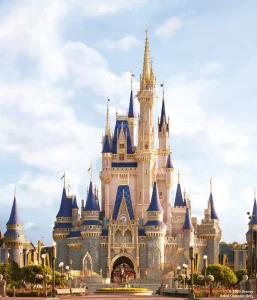

Photo: Disney Parks
Overall, Magic Kingdom attractions required a wait of only 23 minutes, a drop of five minutes from last week.
The combination of late September and heinous weather irrefutably caused a drop in crowd sizes at Walt Disney World last week.


Still, I think we’d all prefer larger crowds and zero hurricanes.


